Mixed-Use Industrial/Commercial Building For
For Sale
$1,500,000
Grand Rapids, MI 49534, Grand Rapids, MI 49534
Mixed-use building with industrial and office suites near I-96.
Property Size7,898 SF
Price / SF$189.92
Days on Market252
Property Features
General Information
Standard status
Active
Size
7,898 SF
Property subtype
Industrial
Building Details
Building Size
7,898 SF
Year Built
2018
Listing Agency:
Signature Associates
Listed By:
Joe Rizqallah
(616) 822-6310
Source:
Tcnworldwide
Added: Jan 27
Changed: Oct 4
Last Checked: Oct 5 at 3:43PM
Displayed information is deemed reliable but is not guaranteed and should be independently verified. All listing content including descriptions, pricing, images are the copyrighted material of Signature Associates
Investment Insights
Based on property information with market context.
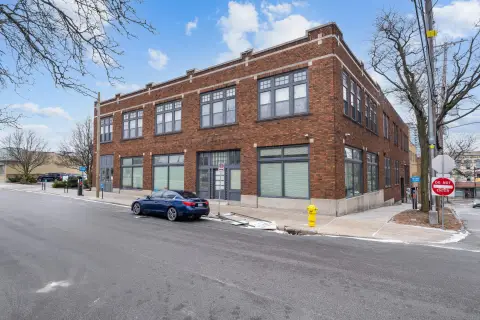
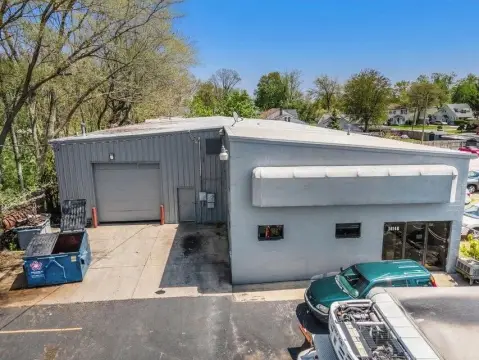
This mixed-use industrial/commercial building features three industrial/warehouse suites, each approximately 2,220 square feet, and two office suites. The property is located one block from Remembrance and 3 Mile on the northwest side of the city, and less than one mile from I-96. The industrial storage units include 10’ x 14’ overhead doors and 16’ clear span ceilings. Each suite has one ADA-compliant restroom. Zoned C-2, the property is suitable for a variety of uses. The office suites feature high-end furnishings, built-out space with restrooms, and kitchen countertops. Ample parking is available. The facade includes glass panels, large bay windows, and a decorative stone exterior. The warehouse suites are currently leased by tenants, and the office spaces may be available for immediate occupancy. The property has a total size of 7,898 square feet.
Key Highlights
- Mix‑use building with three industrial/warehouse suites and two office suites, offering diverse income potential or business use.
- Excellent location: Close proximity to Remembrance Road, 3 Mile Road, and less than 1 mile from I‑96.
- Industrial suites feature rare 10’ x 14’ overhead doors and 16’ clear span ceilings.
Financial Insights
Estimated NOI and Cap Rate
NOI / Yr
$96,470
Cap Rate
6.43%
Suggested Prices Based on Cap Rates
Cap Rate 5%
$1,929,400
$1.9M
Cap Rate 7%
$1,378,143
$1.4M
Cap Rate 9%
$1,071,889
$1.1M
Market Conditions
NOI Build-Up for 7,898 SF
Gross rent
$118.5K $15.00/SF
− Vacancy
−$5.0K −$0.63/SF
EGI
$113.5K $14.37/SF
− OpEx
−$17.0K −$2.16/SF
NOI
$96.5K $12.21/SF
Area
Grand Rapids, MI
Vacancy
4.20%
Lease Rate
$15.00 /SF/Yr
Expense Ratio
15.00%
Simulate Cap Rate and NOI
Suggested Prices Based on Cap Rates
Cap Rate 5%
$1,929,400
Cap Rate 7%
$1,378,143
Cap Rate 9%
$1,071,889
Alternative Uses
Best Use
Warehouse
$1.38M
$1.21M – $1.61M
NOI $96,470 @ 7.0% cap · market cap 6.43%
Second Best
Mixed Use
$1.25M
$1.09M – $1.45M
NOI $87,194 @ 7.0% cap · market cap 5.81%
Theoretical Best
Specialty Retail
$1.83M
$1.60M – $2.14M
NOI $128,303 @ 7.0% cap · market cap 8.55%
Zoning and permitted uses should be independently verified with authorities.
Property Analytics
Current Use
Location Intelligence
Trade Area within ½ mile
12
Businesses Nearby
Explore this area
Business Placement
Demographics for 49534, MI
23,996
Population
9,713
Households
2.5
Avg Household Size
37
Median Age
34%
College-Educated
95%
High-School Grad
35.3 sq mi
ZIP Area
680
Density / Sq Mi
$78,846
Median Household Income
$44,176
Median Earnings
$1,161
Median Rent
$270,200
Median Home Value
Market
Vacancy Rate% for Office in Midwest region

Questions? Ask Rey
Realmo’s AI knows this listing — price, zoning, demand, history. Ask anything.





Frequently Asked Questions
What type of property is this?
Mixed-use property - Mixed-use building with industrial and office suites near I-96.
Where is this mixed-use property located?
The property is located at Grand Rapids, MI.
What is the asking price?
The asking price for this property is $1,500,000.
What are key features of this property?
This property features: Mix‑use building with three industrial/warehouse suites and two office suites, offering diverse income potential or business use.; Excellent location: Close proximity to Remembrance Road, 3 Mile Road, and less than 1 mile from I‑96.; Industrial suites feature rare 10’ x 14’ overhead doors and **16’ clear span ceilings.**