Duplex with Bonus
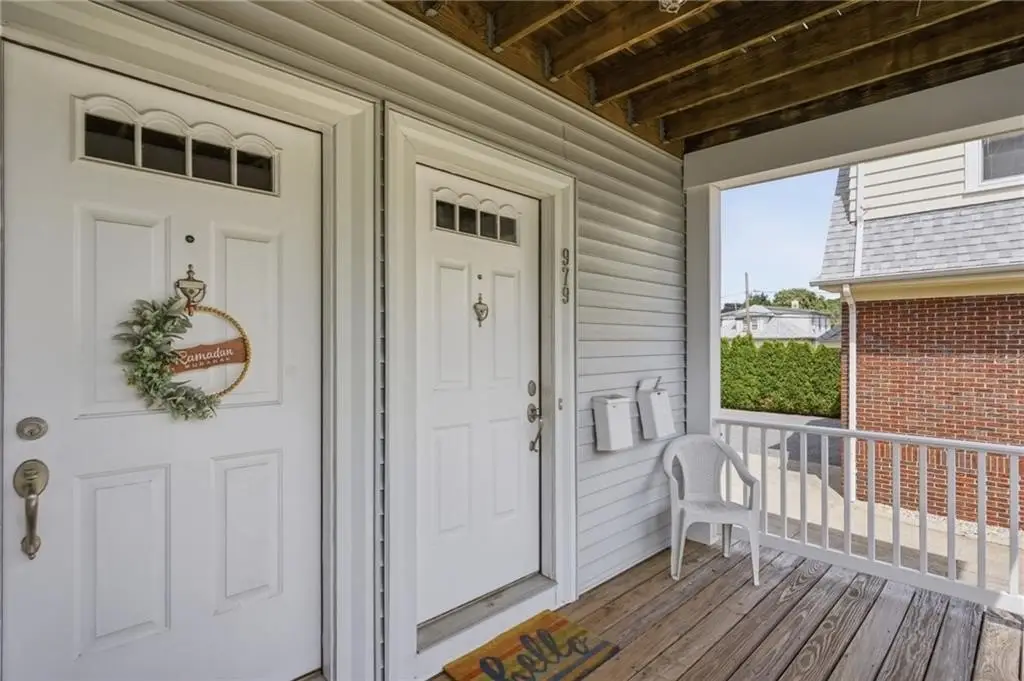
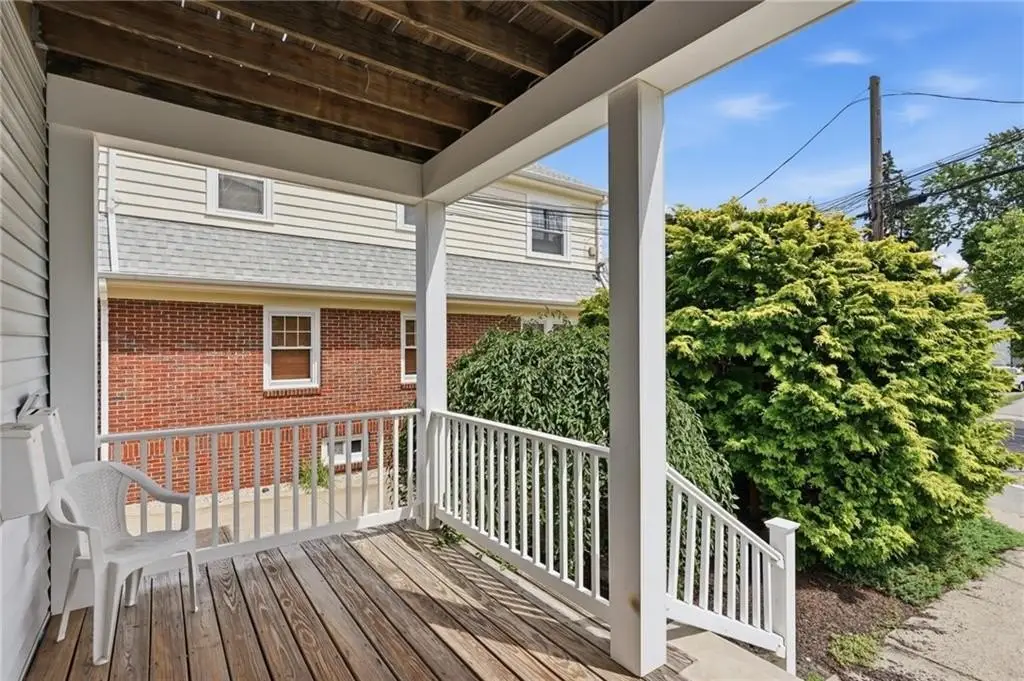
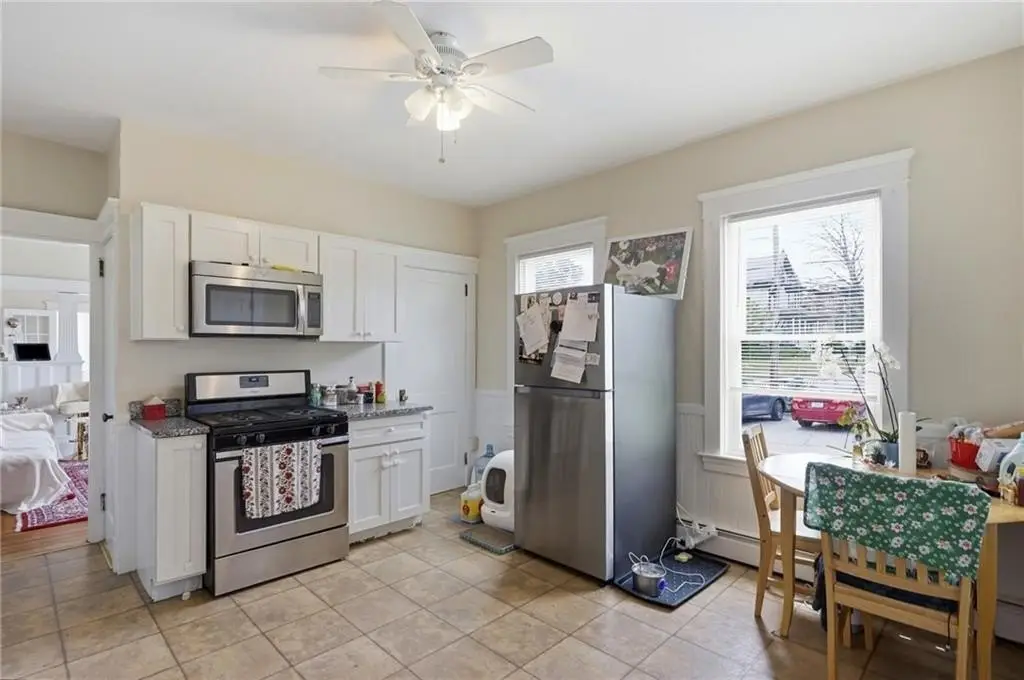
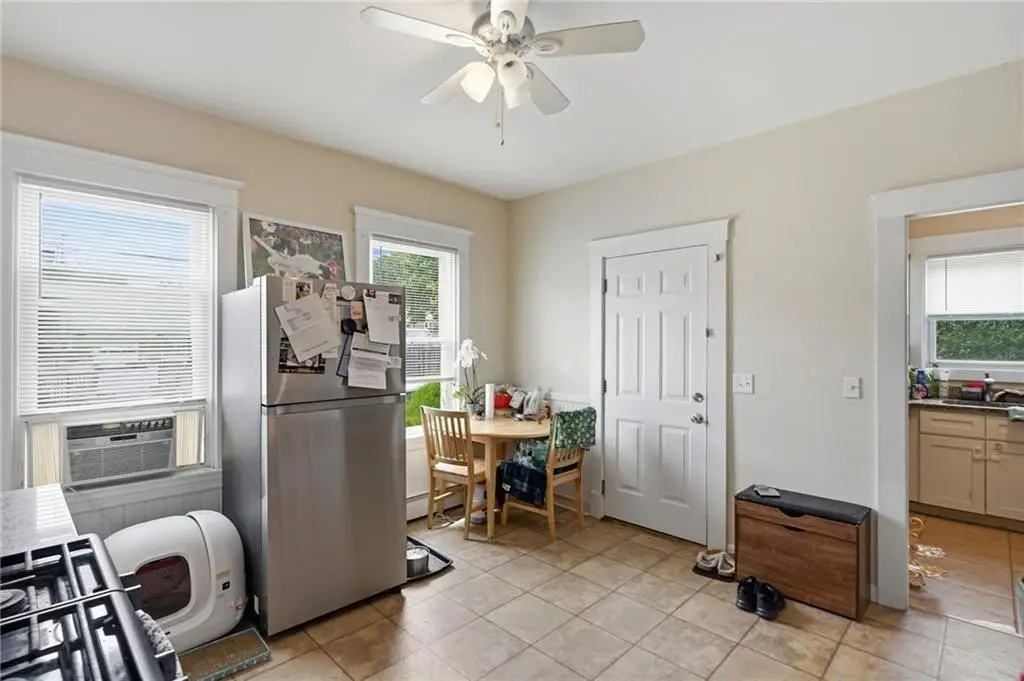
For Sale
$849,900
981 Smith Street, Providence, RI 02908
Residential Income, Providence, RI
Property Size3,080 SF
Lot Size0.12 Acres
Price / SF$275.94
Days on Market92

Ask AI about this property
Review the available facts, identify missing information and prepare questions for the agent.
Property Features for 981 Smith Street
General Information
Property type
Residential Multi Family
Property subtype
Other
Bedrooms
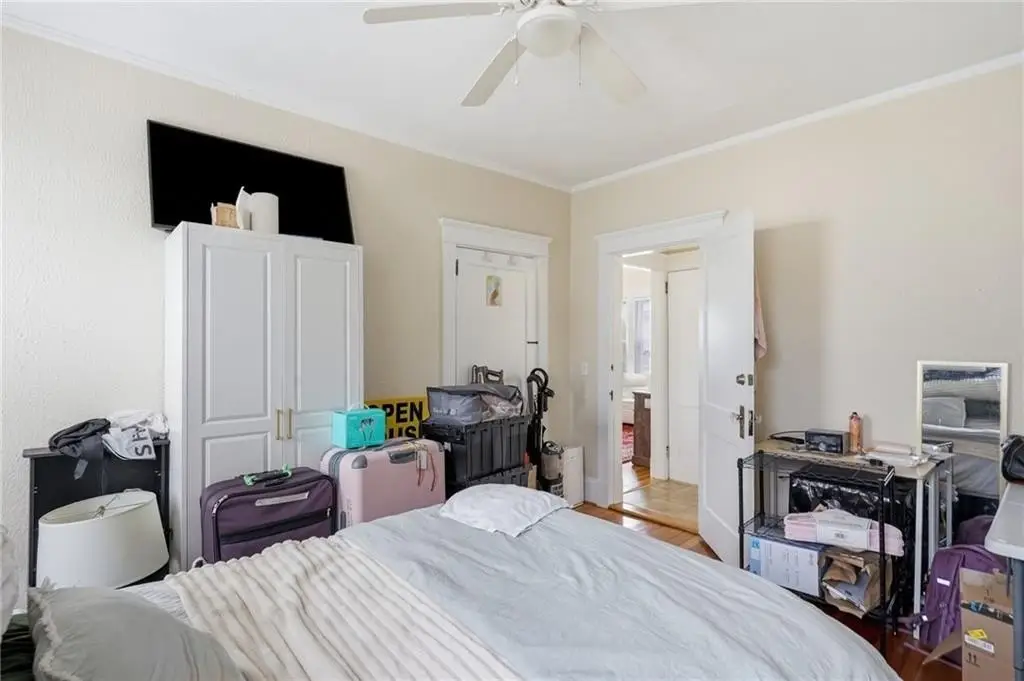
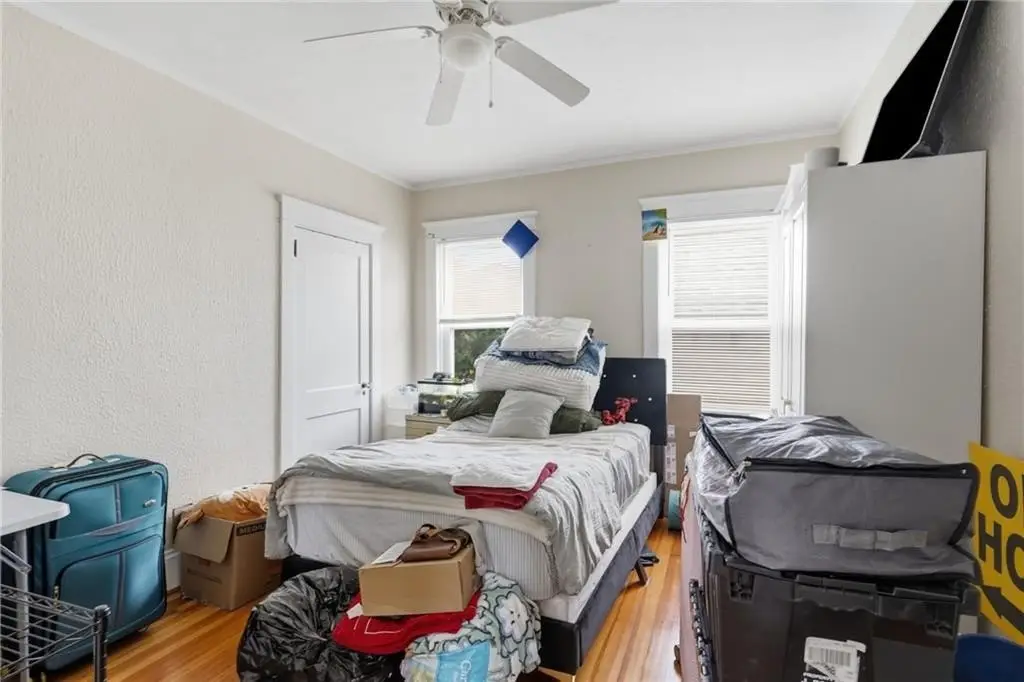
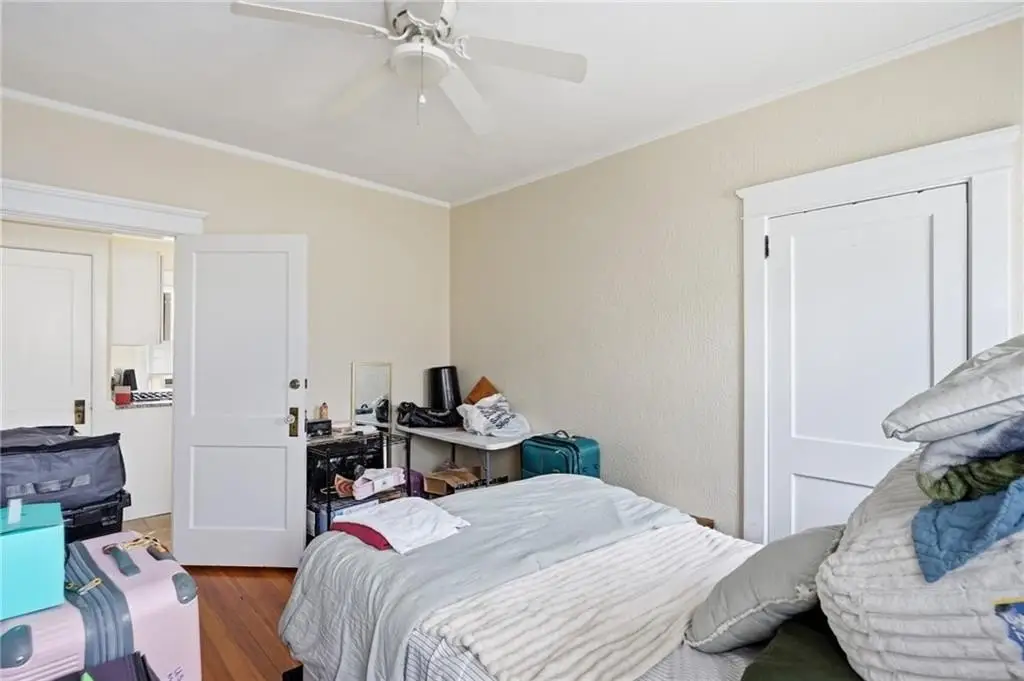
6
Bathrooms
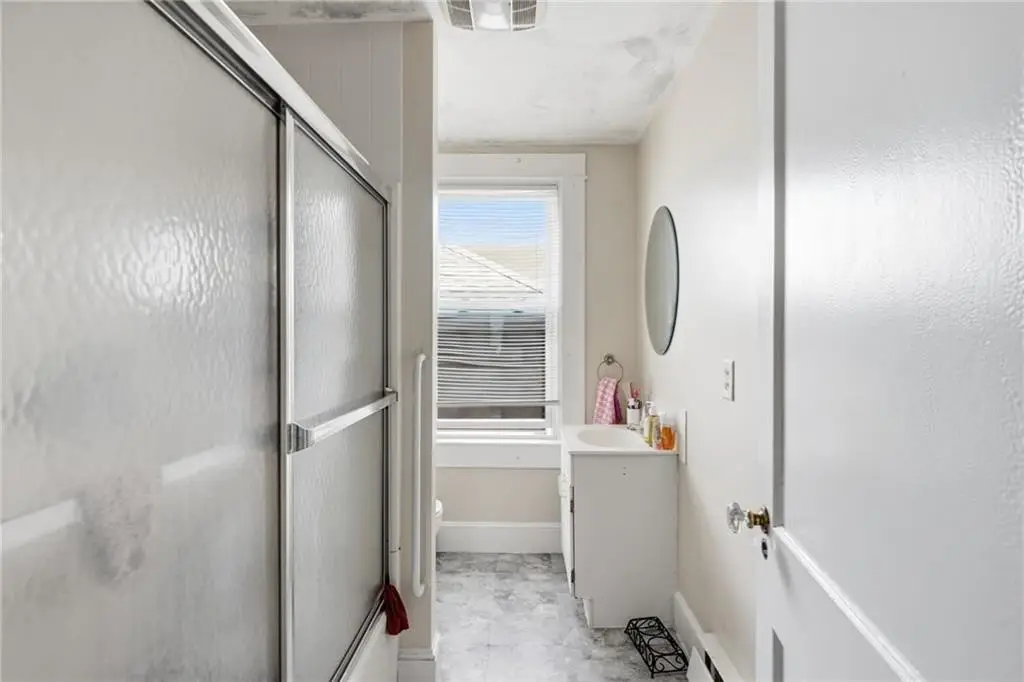
2
Full bathrooms
2
Rooms
Bathroom 1, Bedroom 4, Bedroom 5, Bedroom 2, Bathroom 2, Bedroom 3, Bedroom 6, Bedroom 1, Basement
Parking
4
Parking features
None
Interior features
Wall (Plaster), Wall (Wood), Attic, Attic Stairs, Attic Storage, Cathedral Ceilings, Plumbing (Copper), Plumbing (Mixed), Plumbing (PVC), Insulation (Unknown)
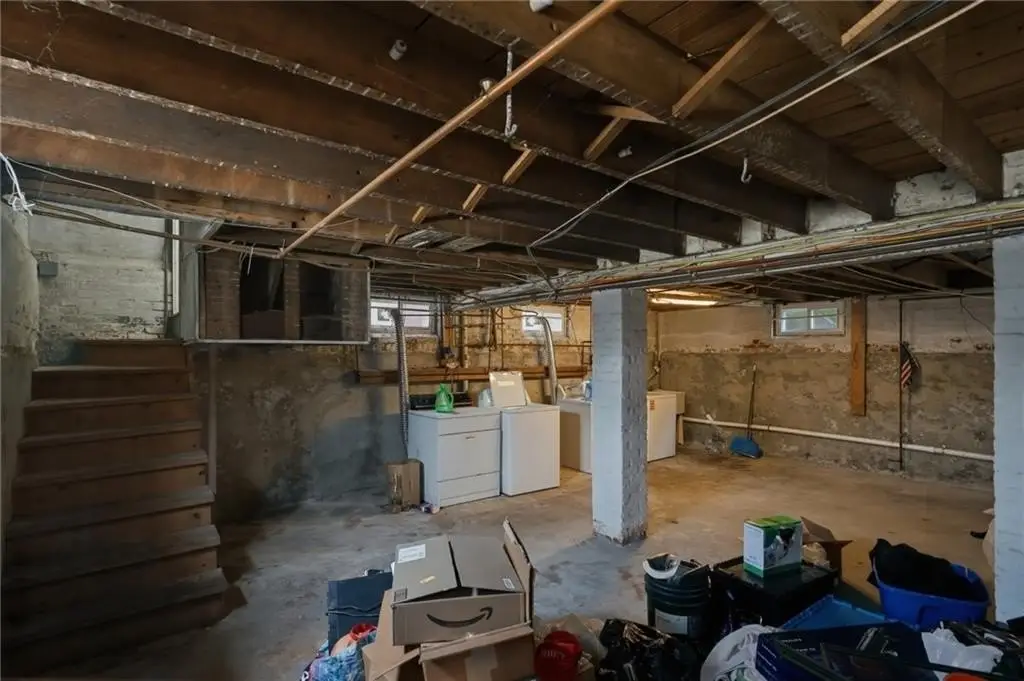
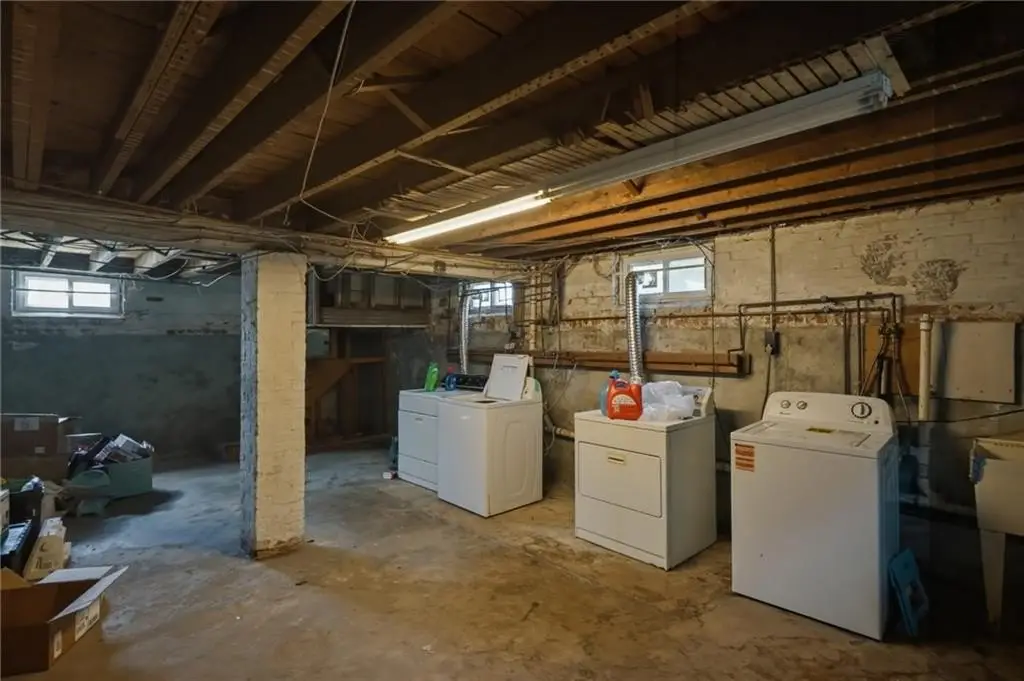
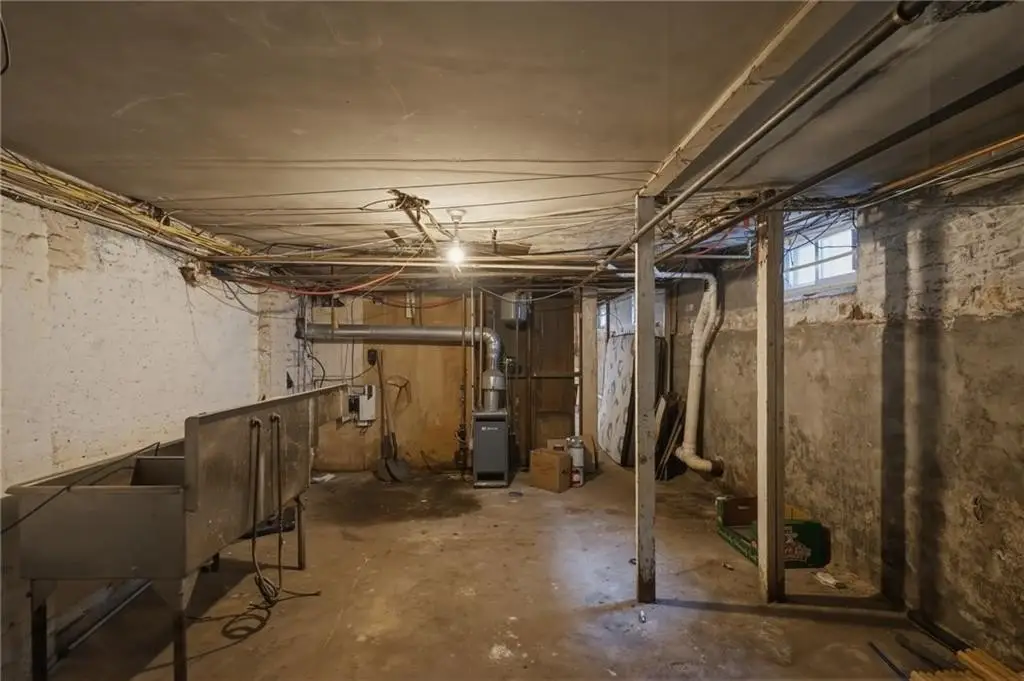
Basement
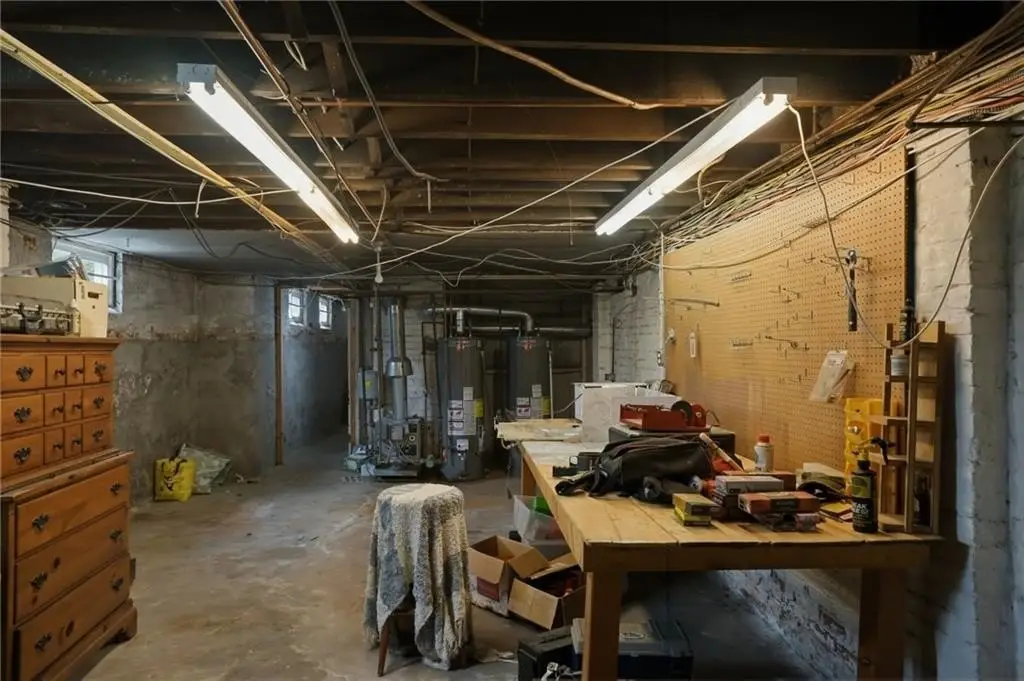
Full, Unfinished
Appliances
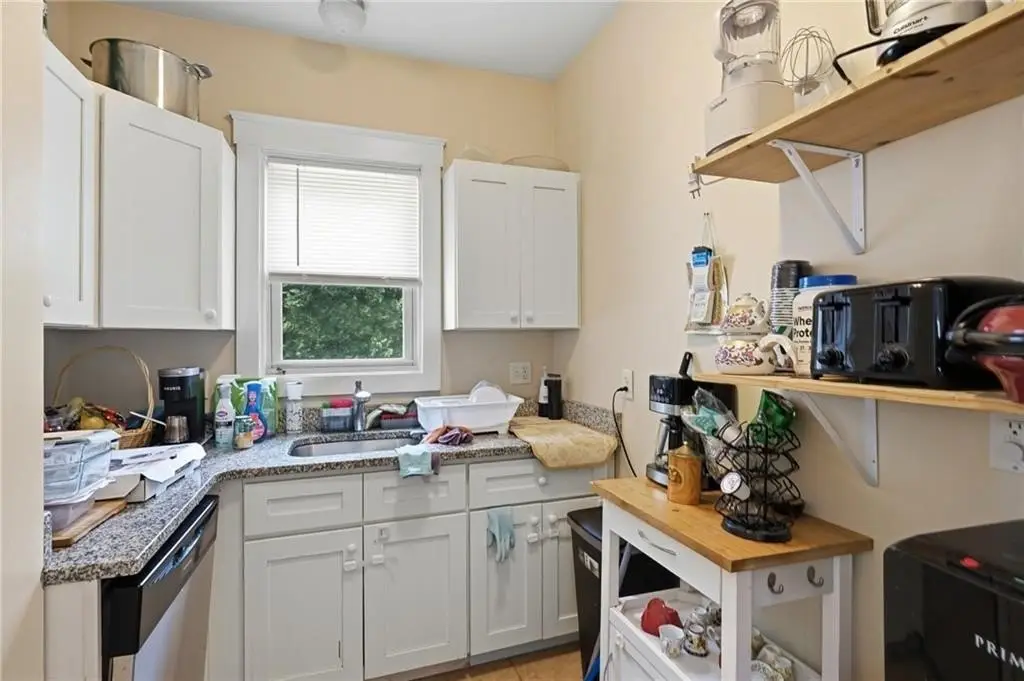
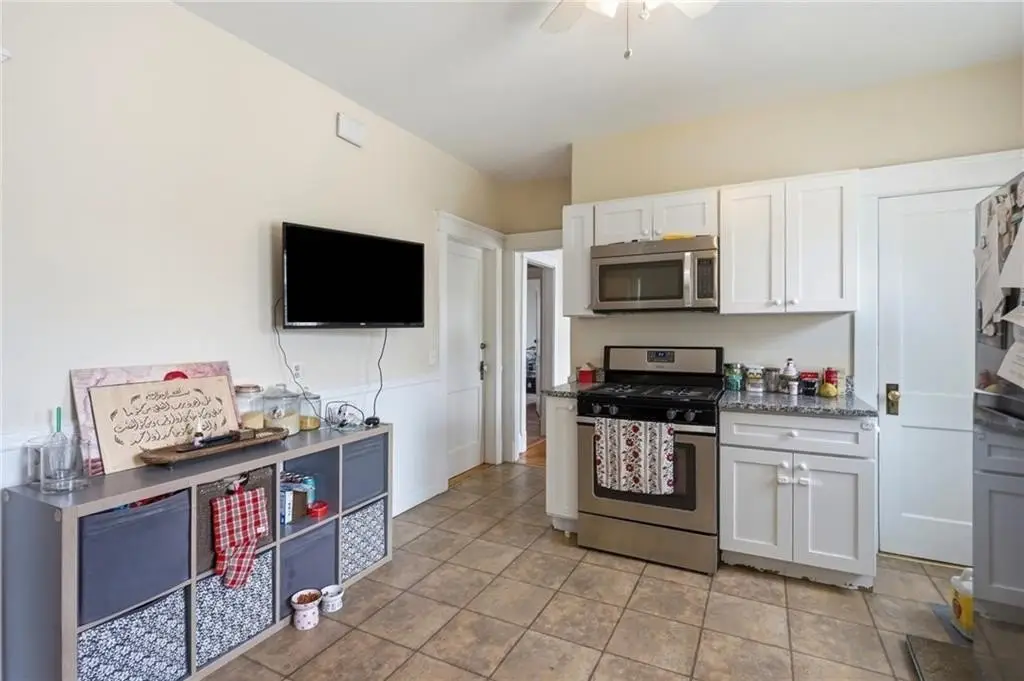
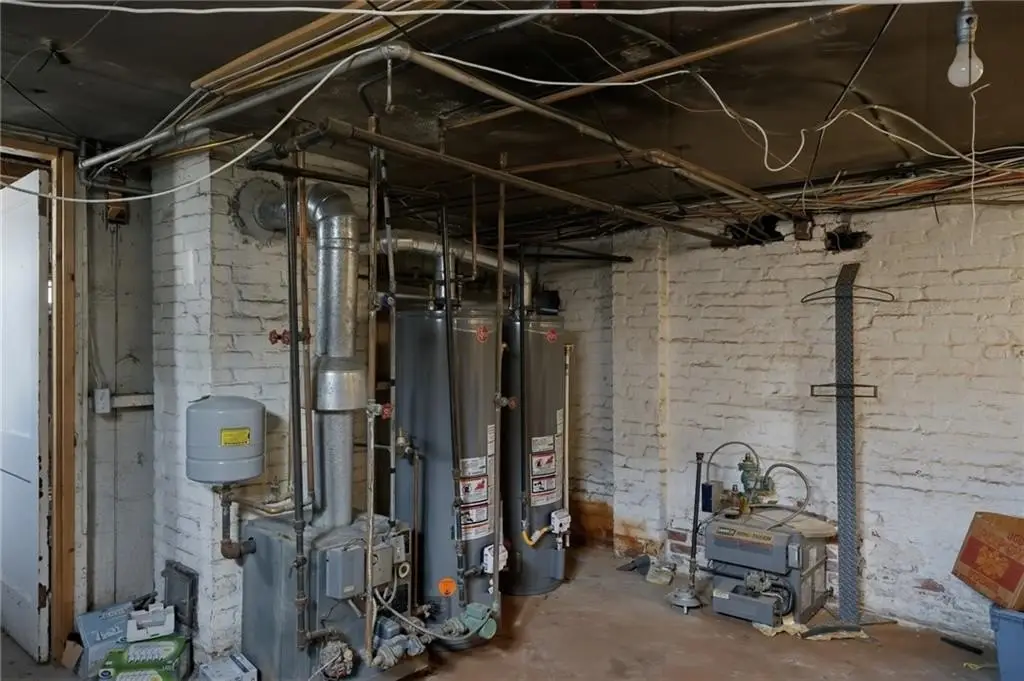
Dishwasher, Dryer, Exhaust Fan, Oven, Range, Refrigerator, Washer, Gas Water Heater
Subdivision
Elmhurst
Lot features
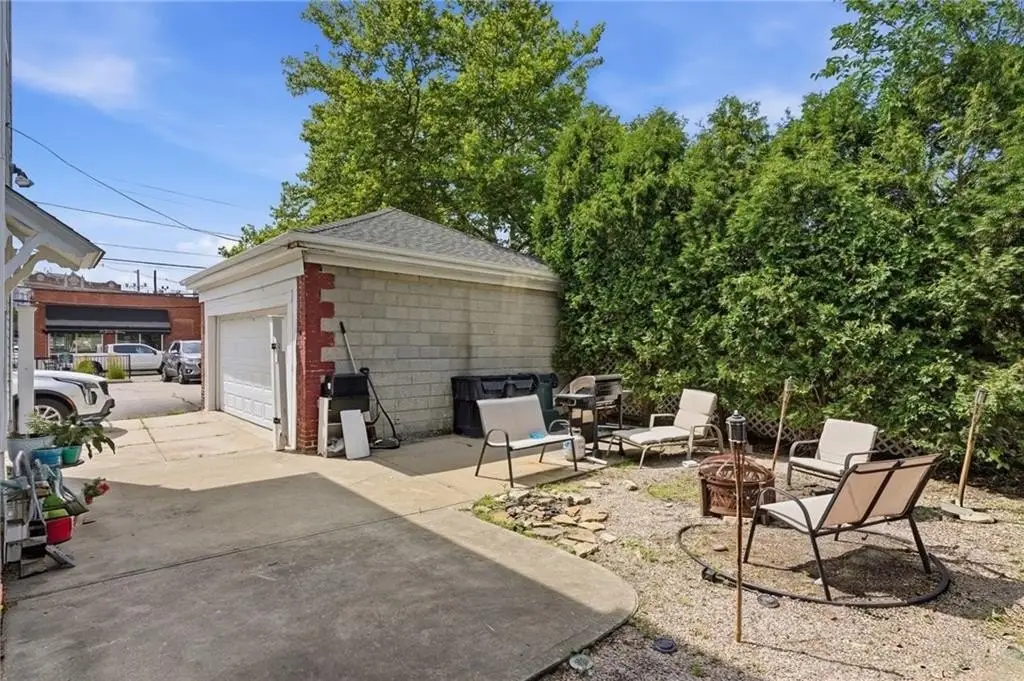
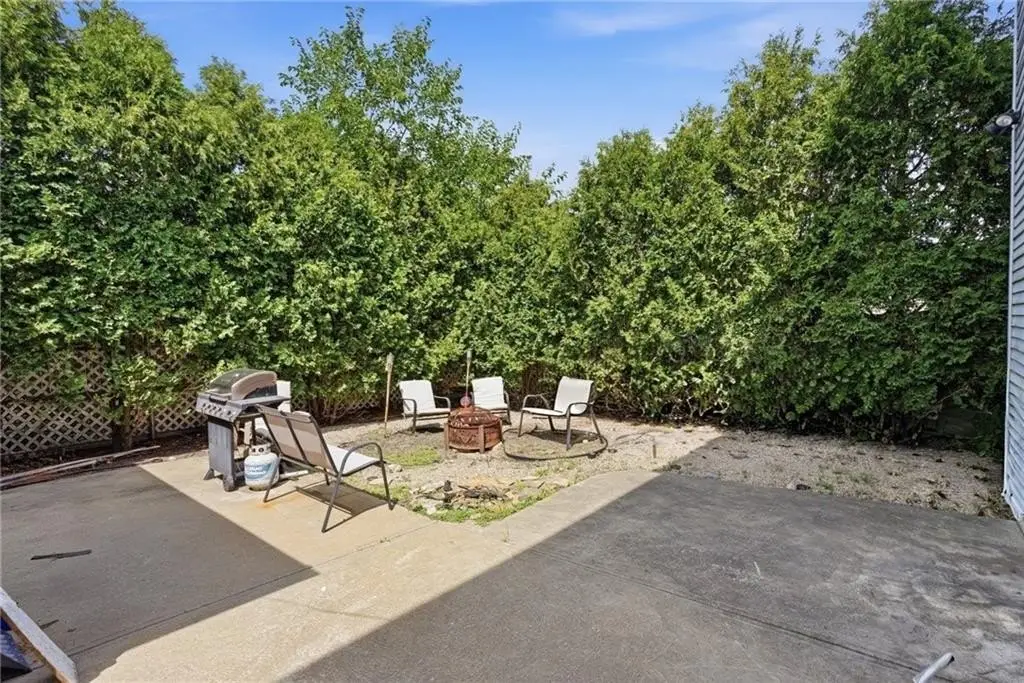
Paved Driveway, Sidewalks
Standard status
Active
Size
3,080 SF
Lot size
0.12 Acres
Taxes and HOA fees
Tax Year
2025
Tax Annual Amount
4900
Utilities
Heating system
Baseboard, Natural Gas
Building Details
Year built
1920
Floors in Building
3
Number of units
2
Flooring type
Tile - Ceramic, Marble, Carpet, Hardwood
Building materials
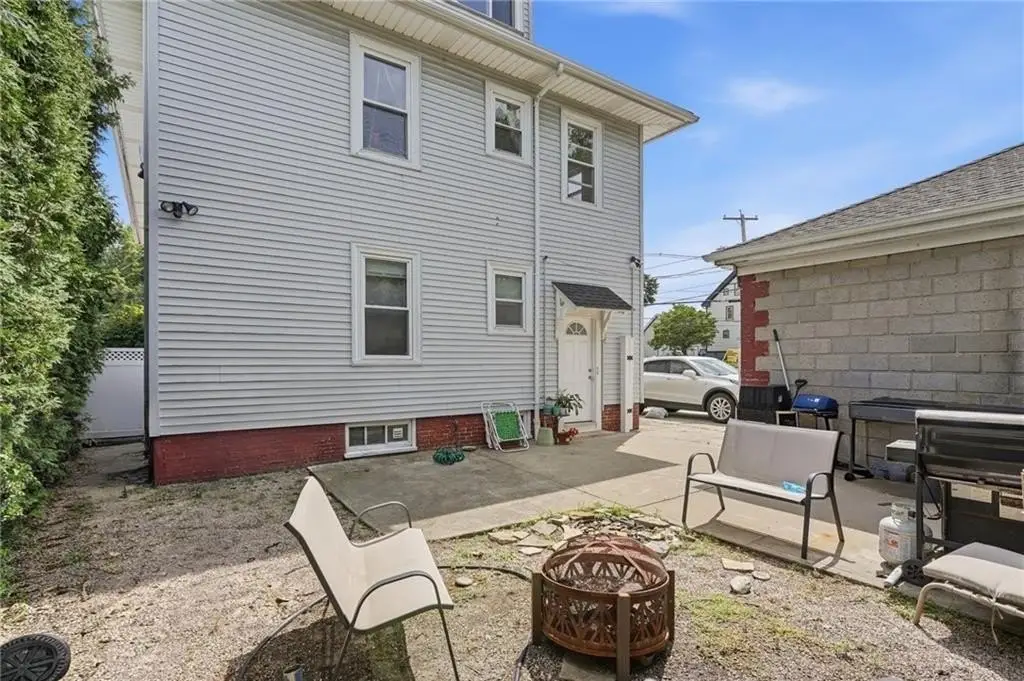
Plaster, Wood Wall(s), Vinyl Siding
Additional Structures
Storage
Listing Agency:
Re/Max Professionals · RE/MAX International
(401) 884-6050
Listed By:
Jason Ferri · License #344781
(401) 952-0447
Added: Jul 16
Changed: Sep 26
Last Checked: Oct 15 at 6:06PM
MLS# 1417718
Copyright © 2026 State Wide MLS of Rhode Island, Inc. All rights reserved. All information provided by the listing agent/broker is deemed reliable but is not guaranteed and should be independently verified.
Investment Insights
Based on property information with market context.
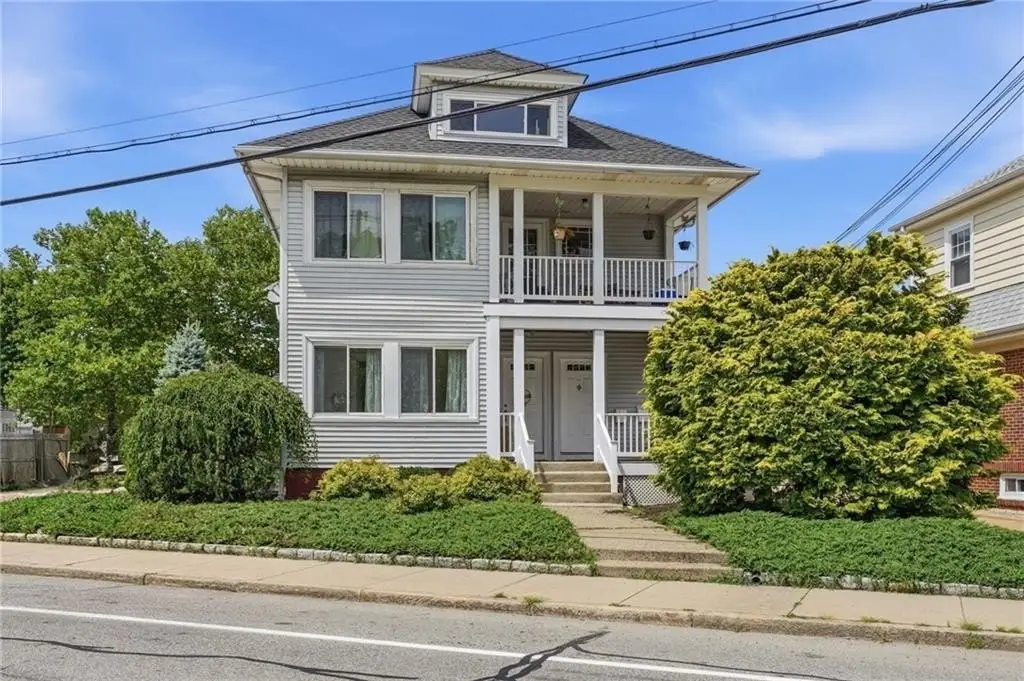
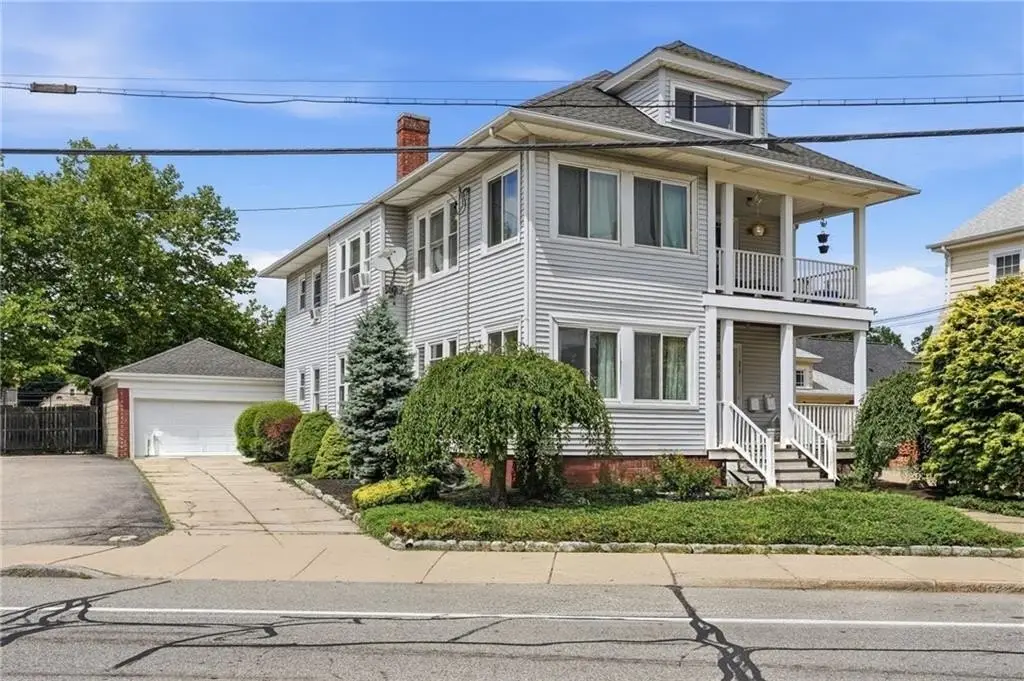
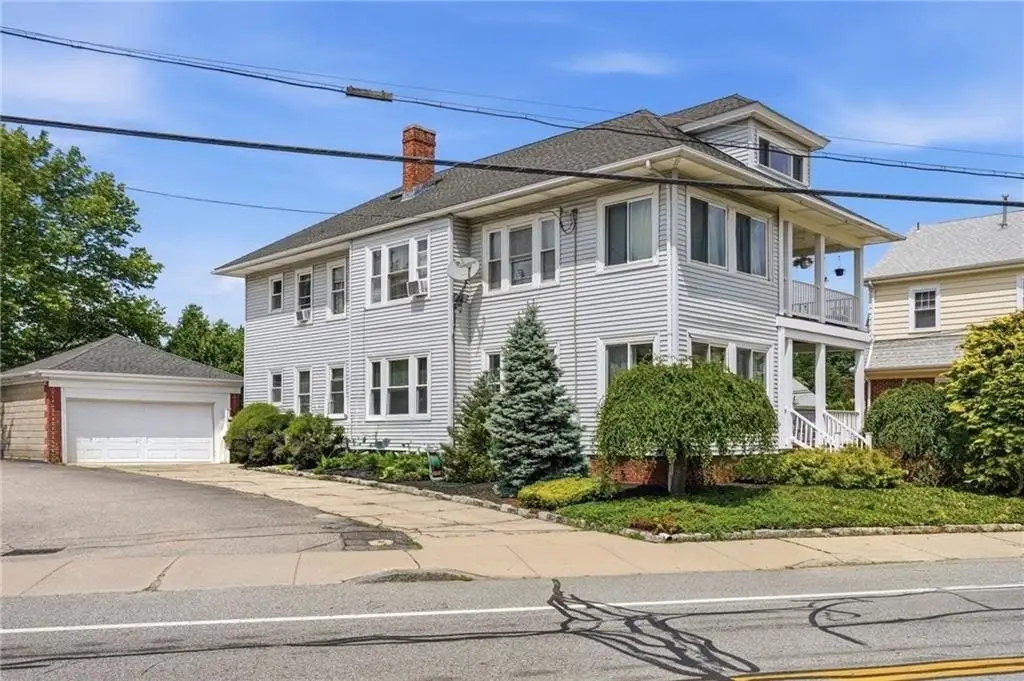
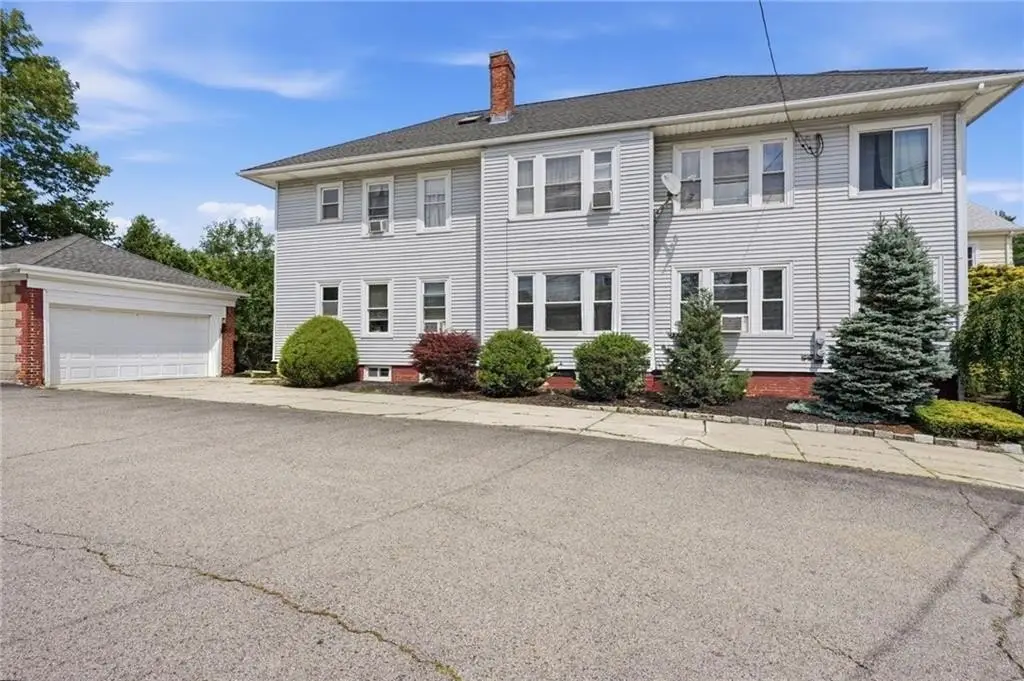
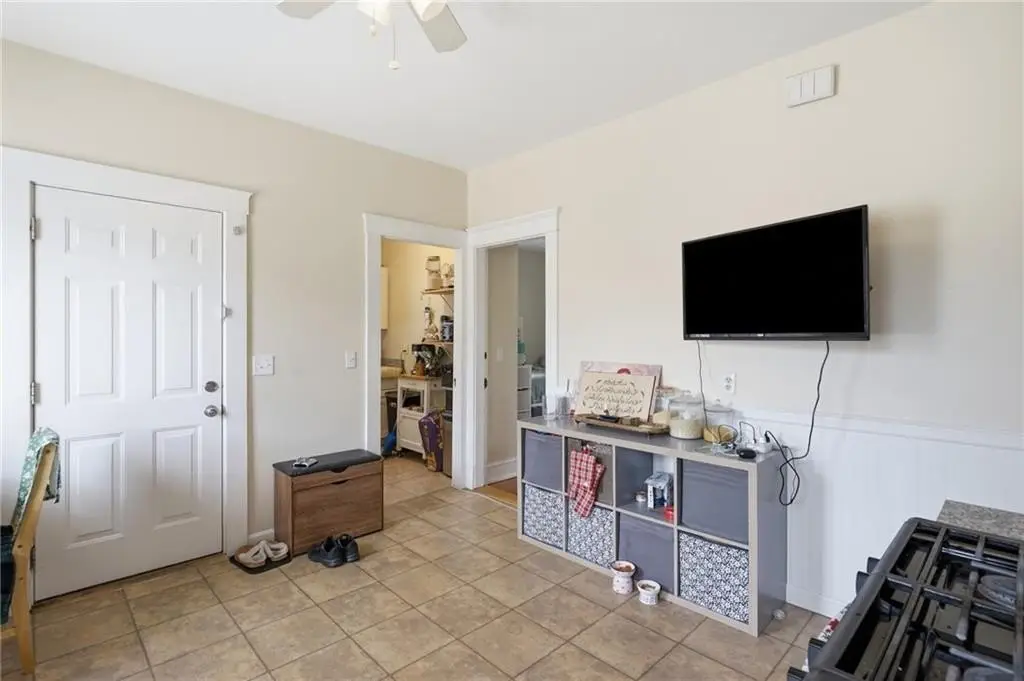
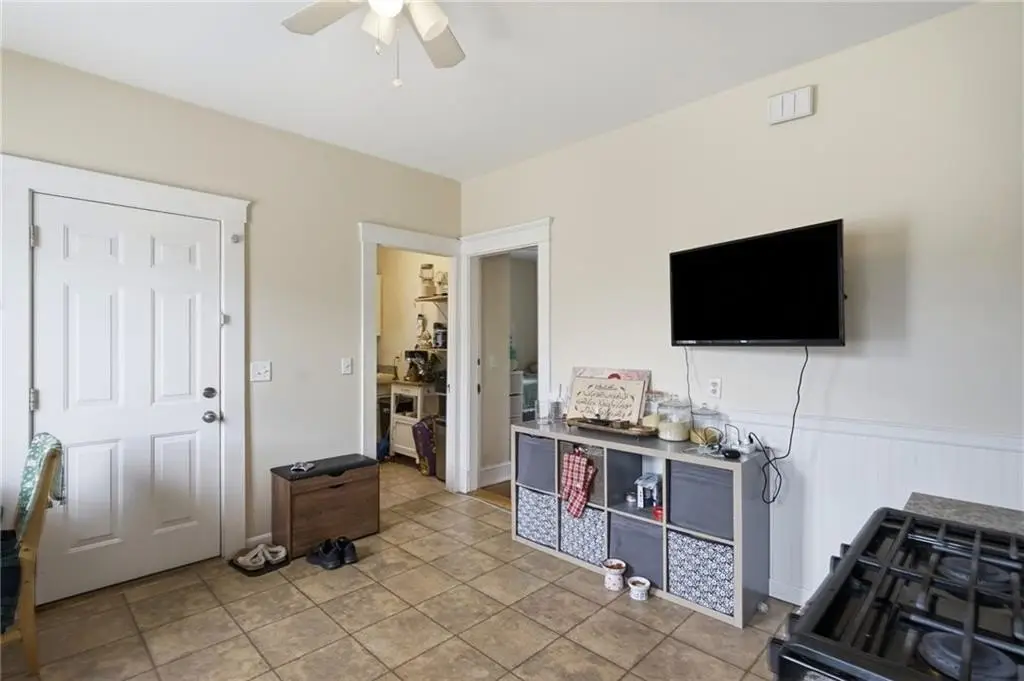
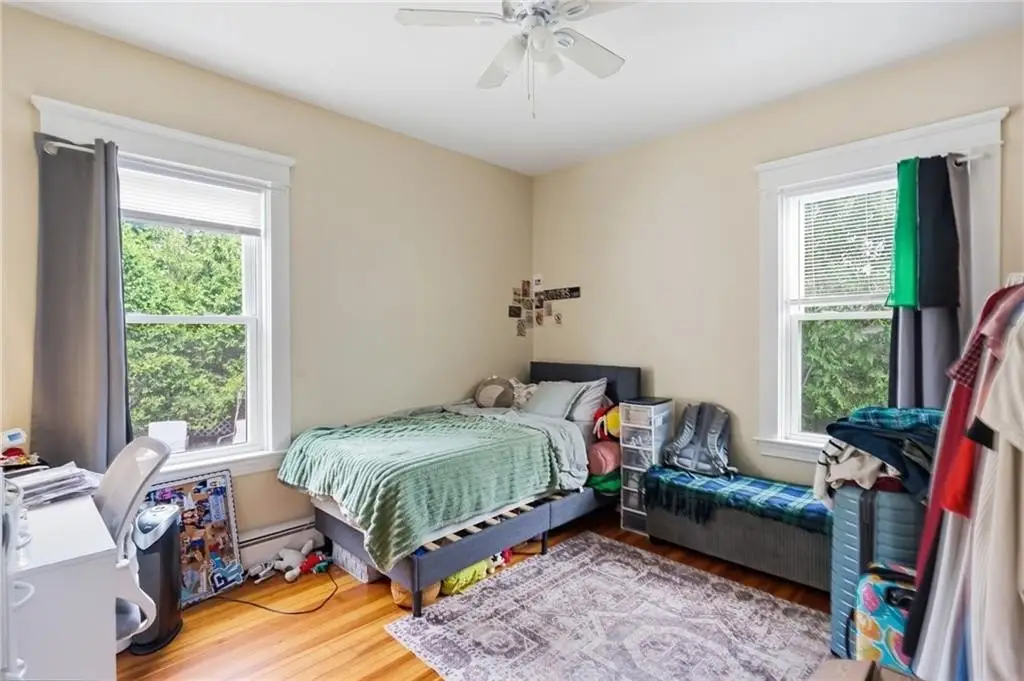
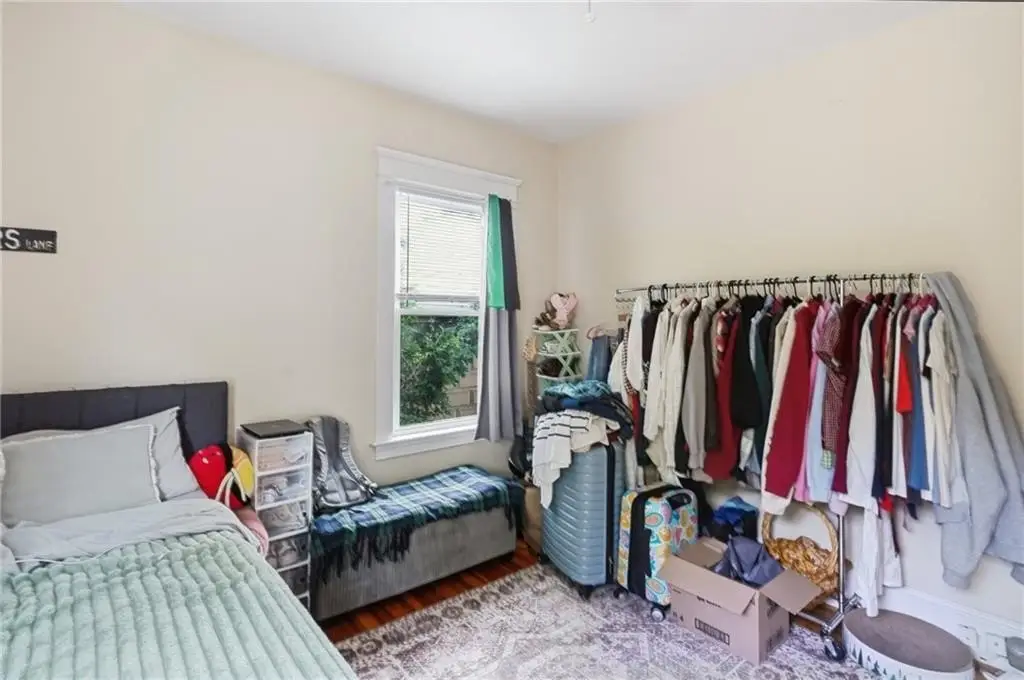
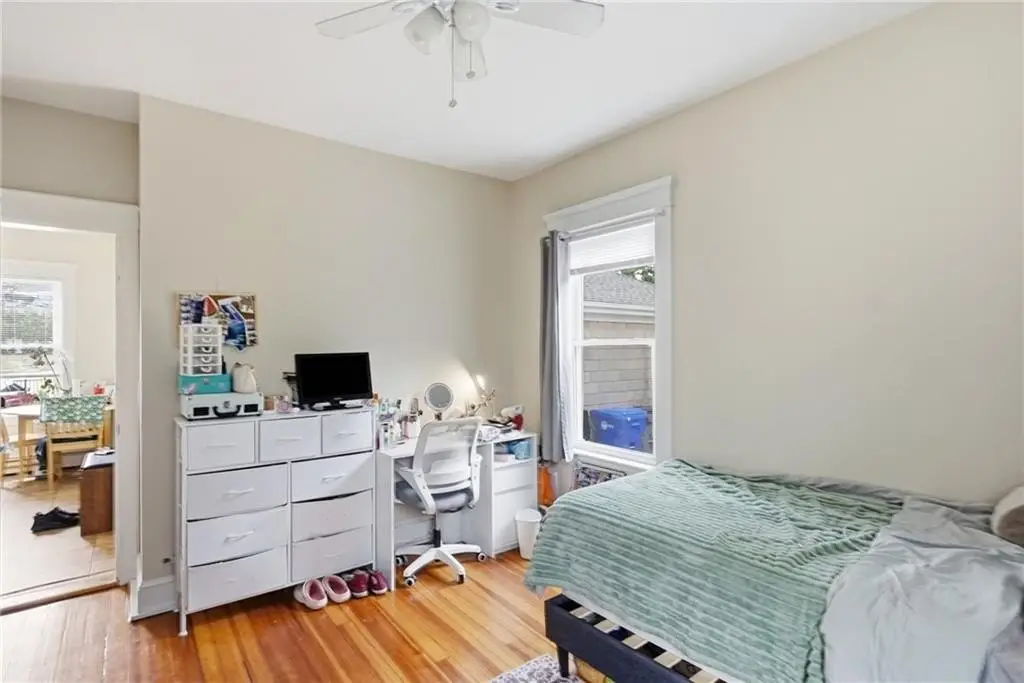
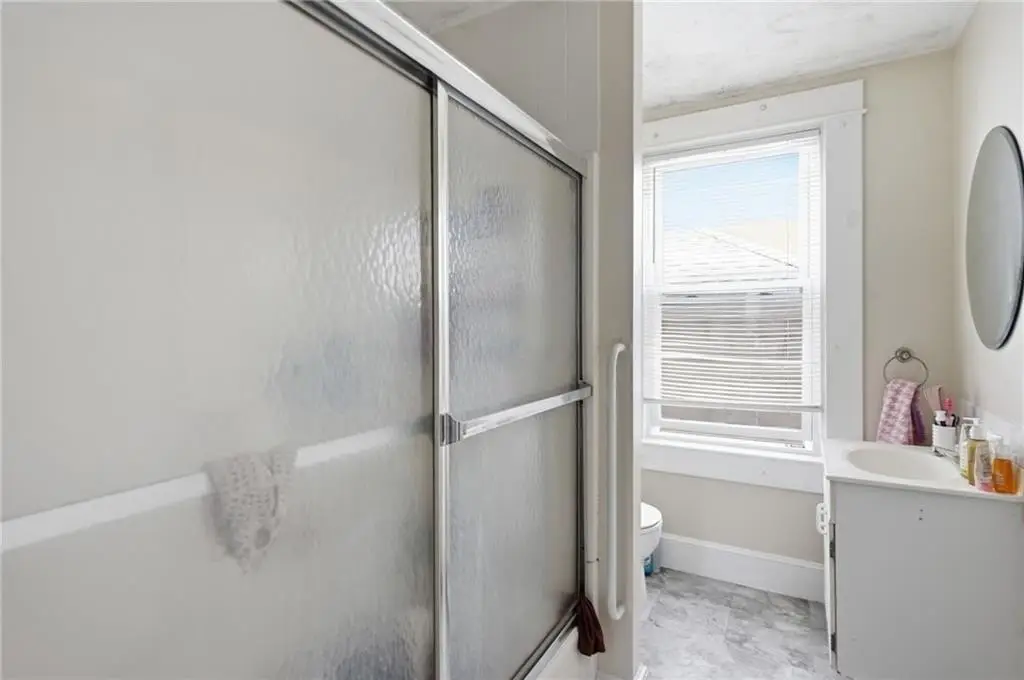
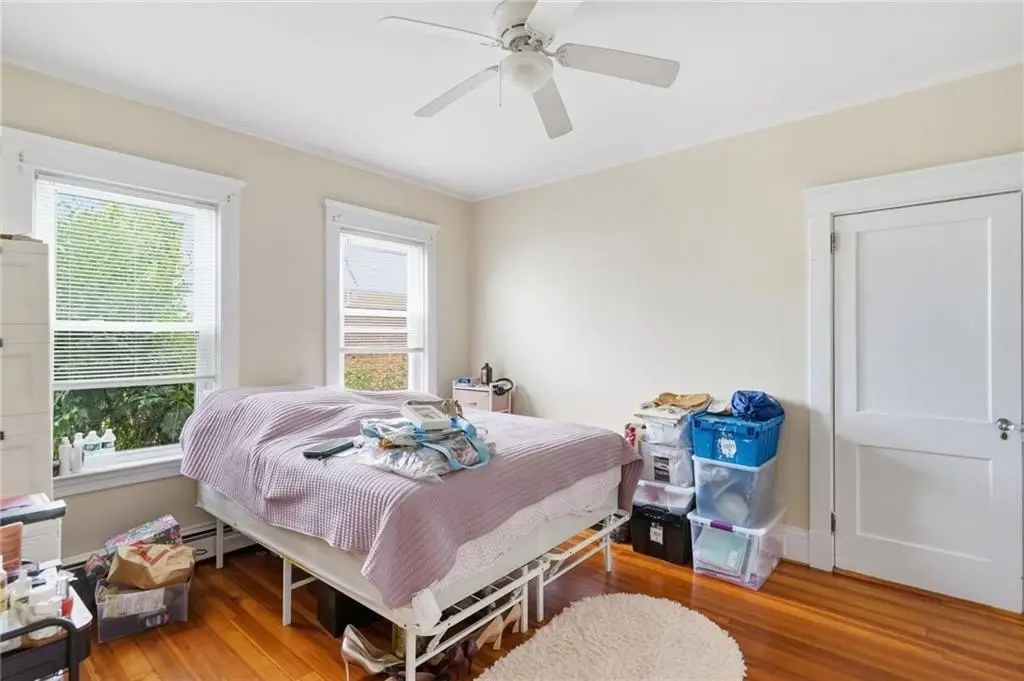
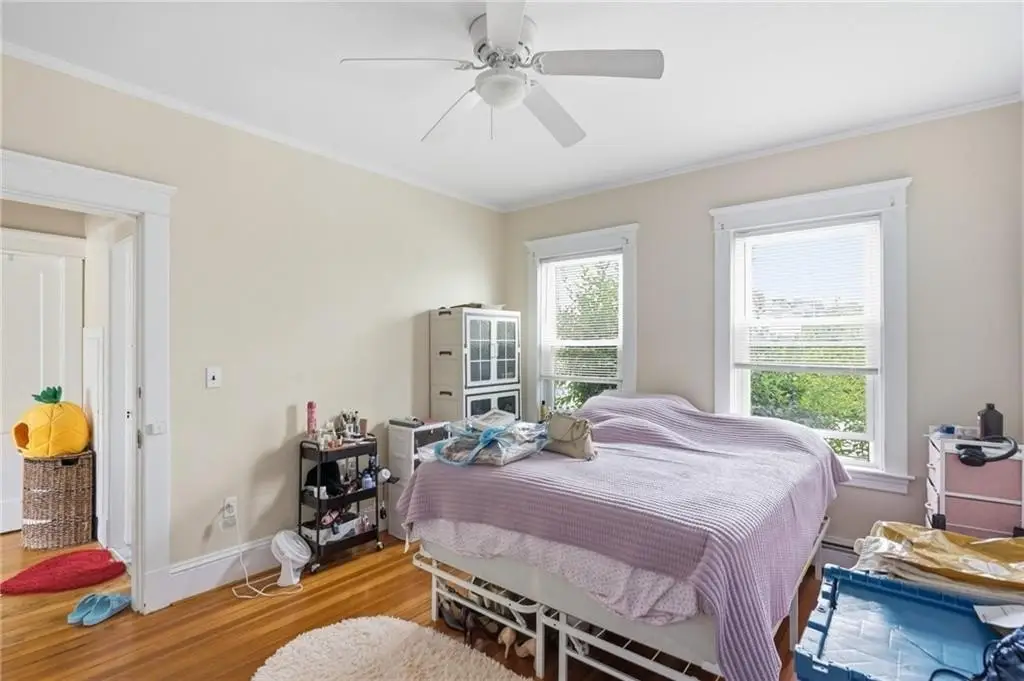
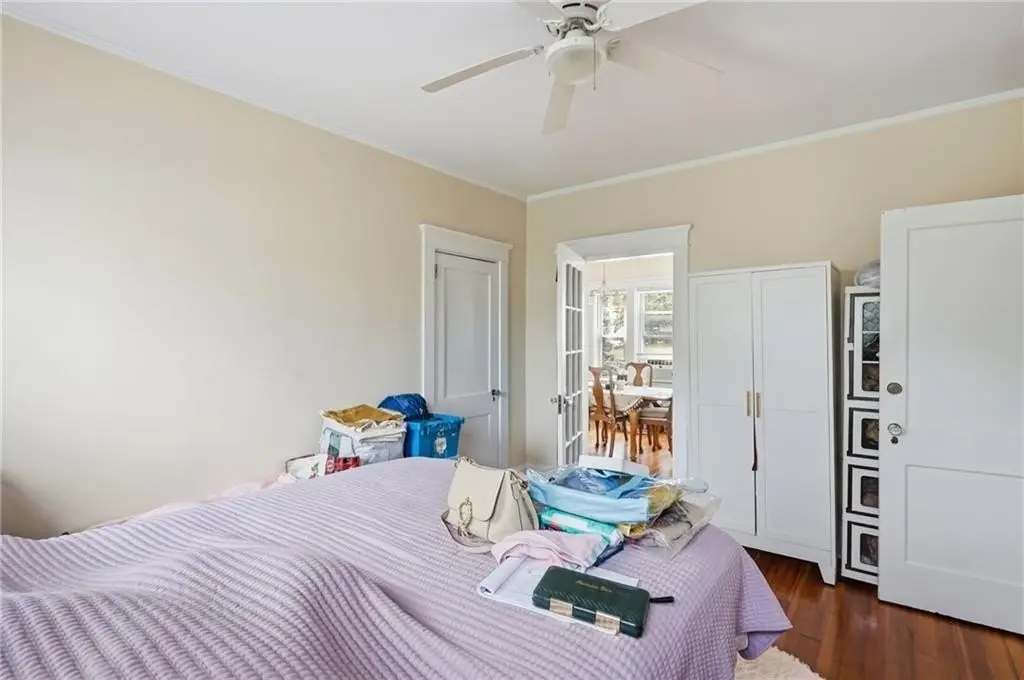
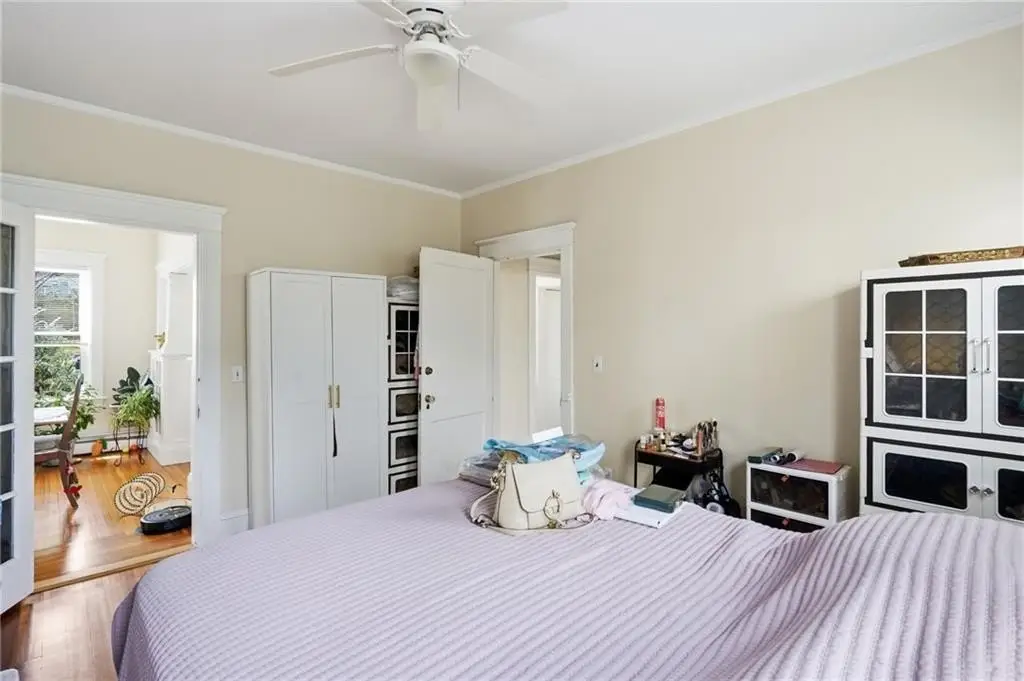
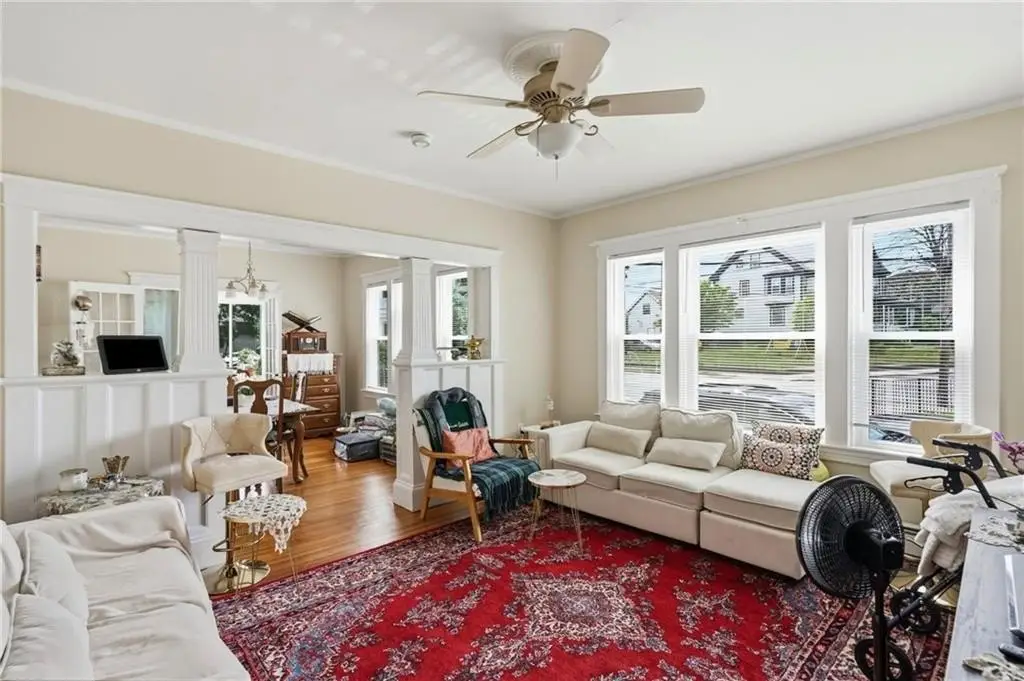
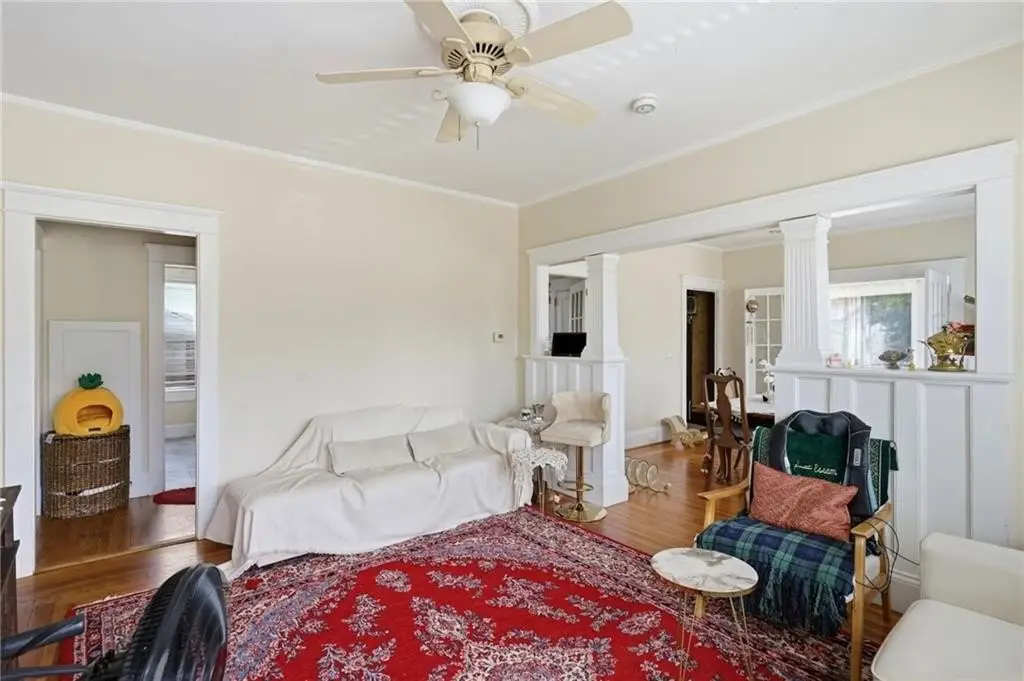
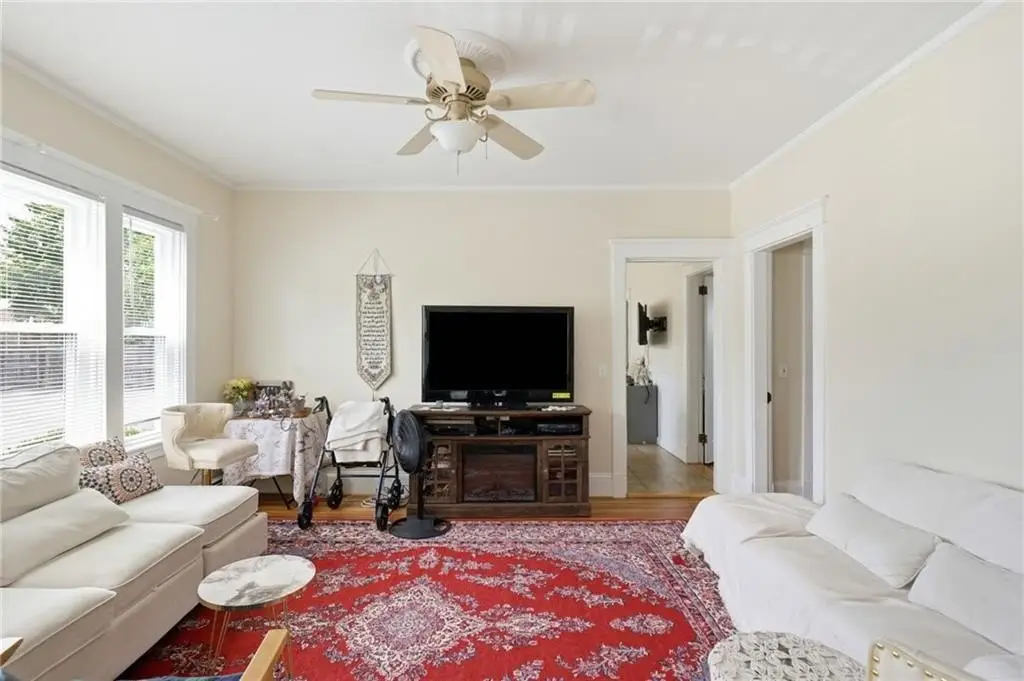
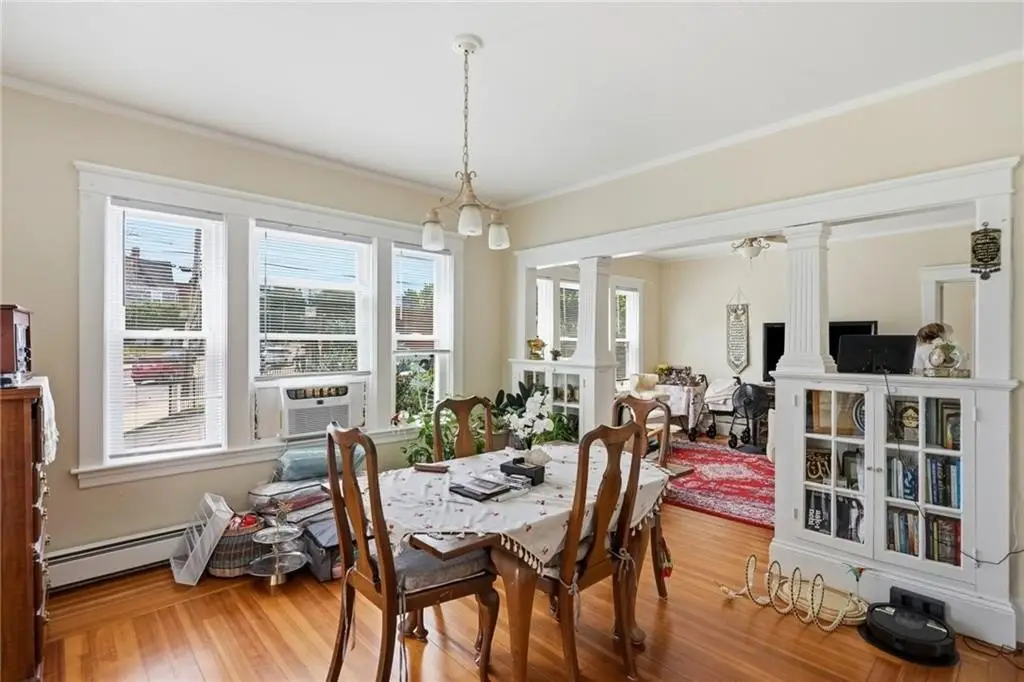
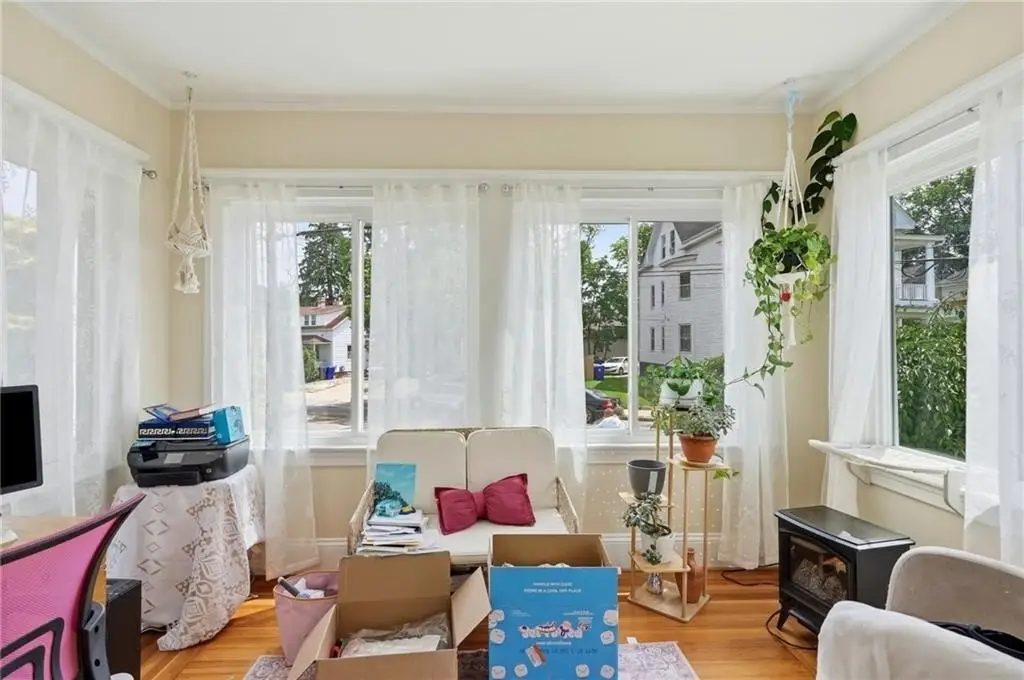
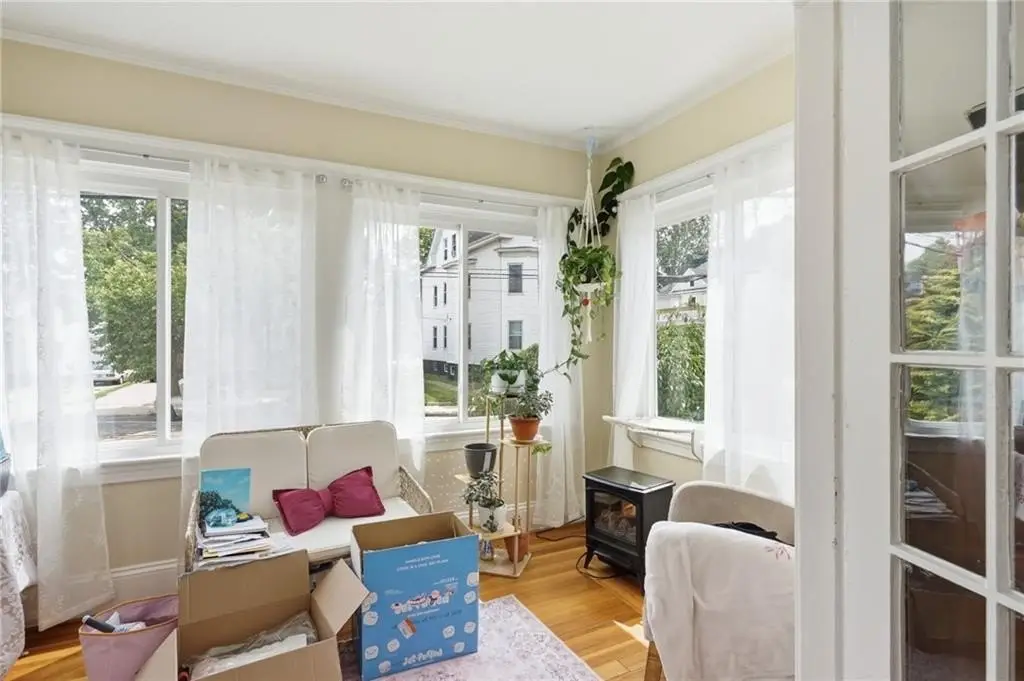
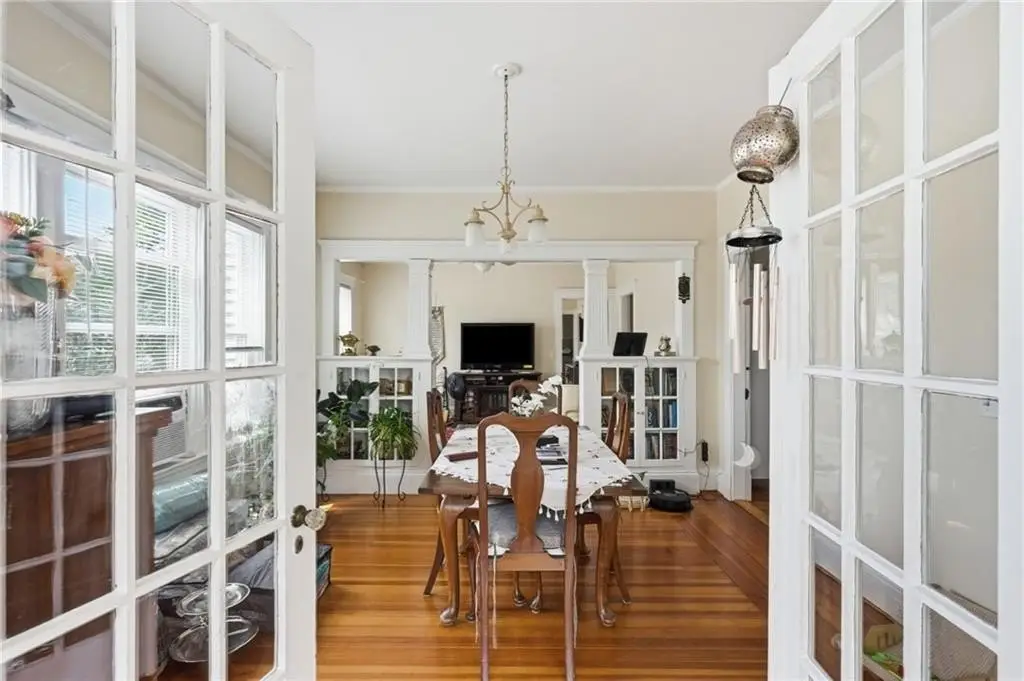
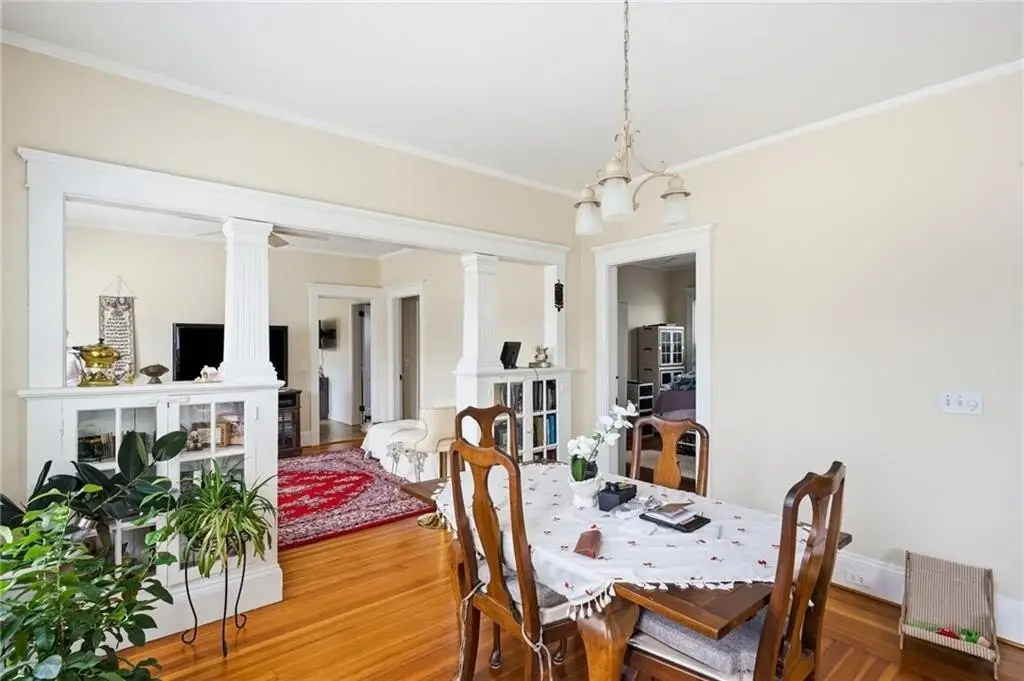
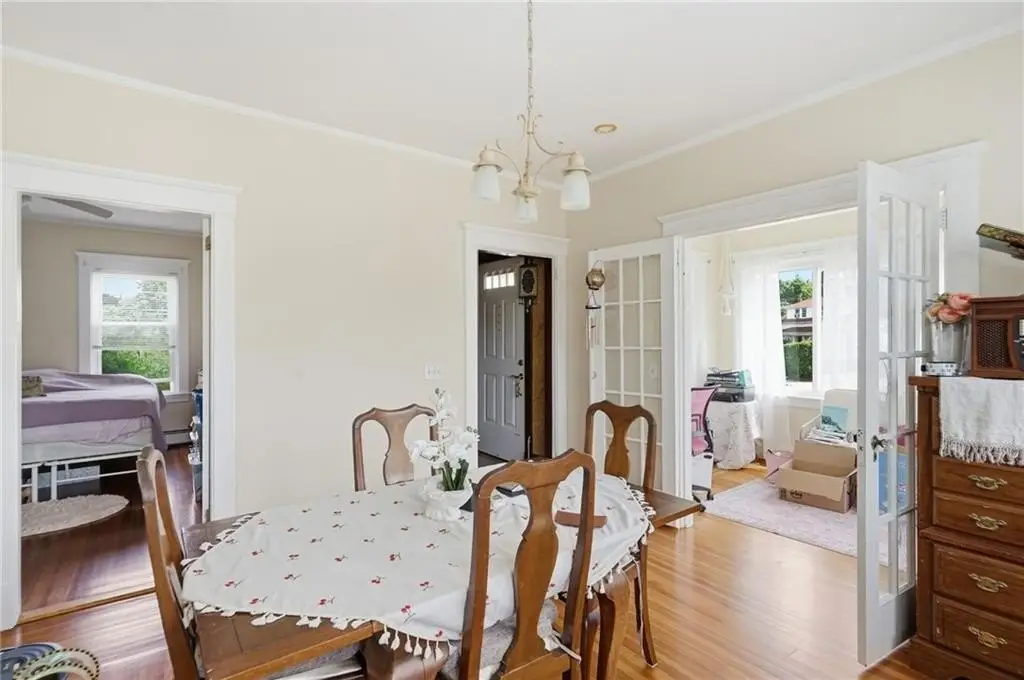
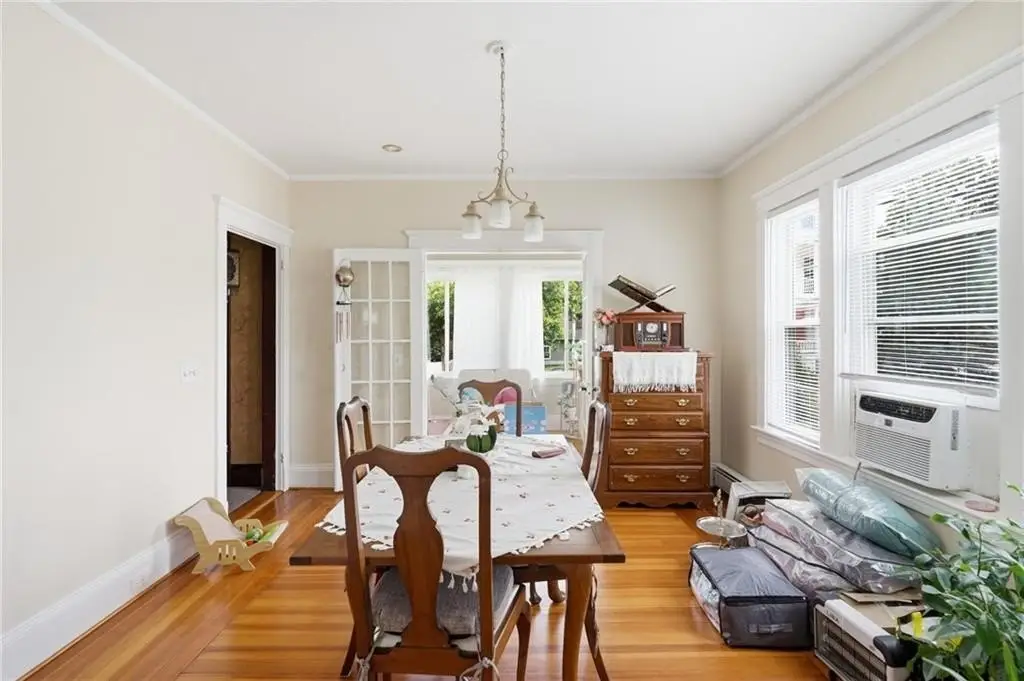
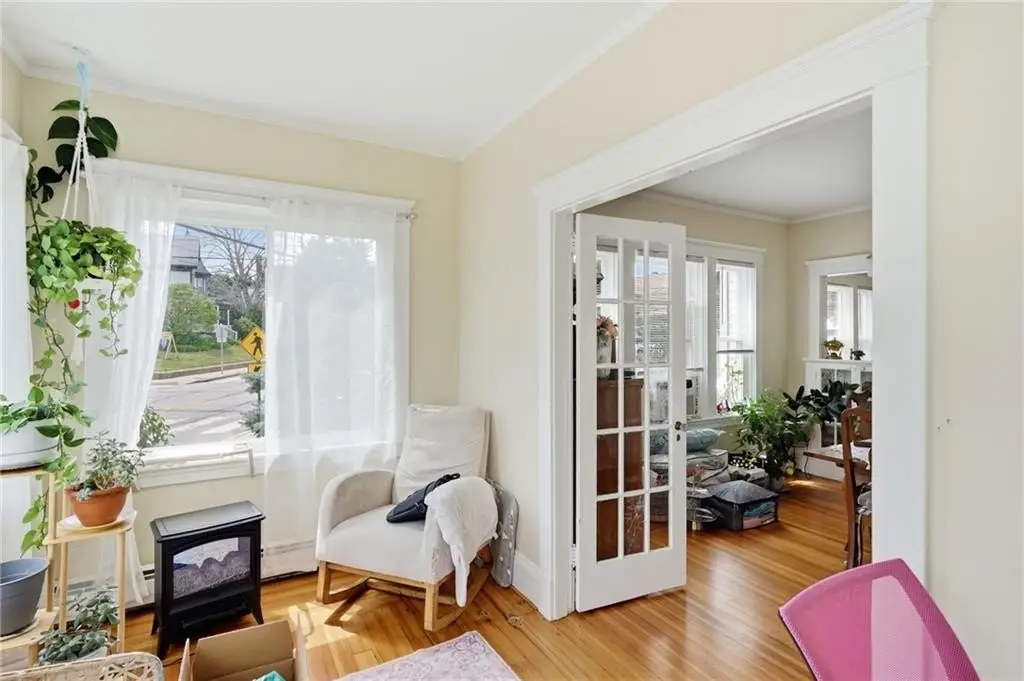
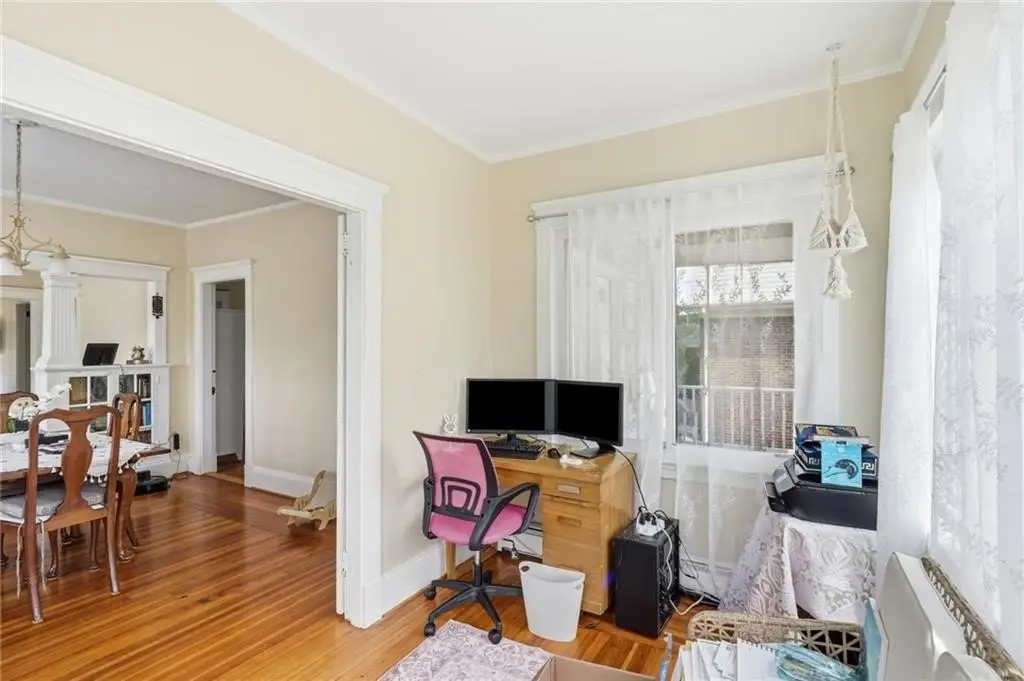
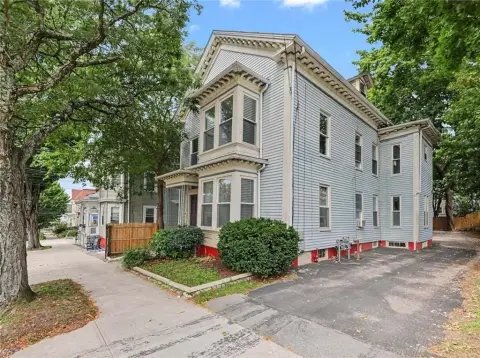
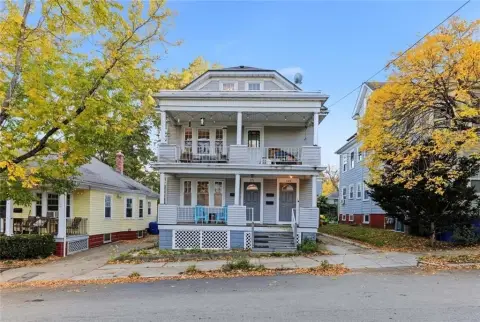
This two-unit duplex contains 3,080 square feet on a 0.12-acre lot. Both units have three bedrooms, one full bathroom, and a bonus room. The building dates to 1920, with attic storage and a mix of plaster and wood walls. A current lease is nearing expiration.
The property is located on Smith Street in Providence, near La Salle Academy, Providence College, shopping, restaurants, parks, and major highways.
The property is located on Smith Street in Providence, near La Salle Academy, Providence College, shopping, restaurants, parks, and major highways.
Key Highlights
- Two units, each with 3 bedrooms, 1 full bath, and a bonus room
- 3,080‑square‑foot building on a 0.12‑acre lot
- Built in 1920
Financial Insights
Estimated NOI and Cap Rate
NOI / Yr
$52,009
Cap Rate
6.12%
Suggested Prices Based on Cap Rates
Cap Rate 5%
$1,040,180
$1.0M
Cap Rate 7%
$742,986
$743.0K
Cap Rate 9%
$577,878
$577.9K
Market Conditions
NOI Build-Up for 3,080 SF
Gross rent
$79.5K $25.80/SF
− Vacancy
−$5.2K −$1.68/SF
EGI
$74.3K $24.12/SF
− OpEx
−$22.3K −$7.24/SF
NOI
$52.0K $16.89/SF
Area
Providence, RI
Vacancy
6.50%
Lease Rate
$25.80 /SF/Yr
Expense Ratio
30.00%
Simulate Cap Rate and NOI
Suggested Prices Based on Cap Rates
Cap Rate 5%
$1,040,180
Cap Rate 7%
$742,986
Cap Rate 9%
$577,878
Alternative Uses
Best Use
Multifamily LT 5
$743.0K
$650.1K – $866.8K
NOI $52,009 @ 7.0% cap · market cap 6.12%
Second Best
Apartment 5plus
$667.4K
$584.0K – $778.6K
NOI $46,716 @ 7.0% cap · market cap 5.50%
Theoretical Best
Office A
$1.03M
$901.6K – $1.20M
NOI $72,130 @ 7.0% cap · market cap 8.49%
Zoning and permitted uses should be independently verified with authorities.
How Realmo checks its estimates
Property Analytics
Unlock full access to Insights
Subscribe to Realmo Intelligence
Open Analytics
Current Use
Lease Details
2
Residential units
Yes
Highway access
Location Intelligence
Trade Area within ½ mile
878
Businesses Nearby
Explore this area
Business Placement
Demographics for 02908, RI
38,507
Population
17,160
Households
2.2
Avg Household Size
32
Median Age
29%
College-Educated
84%
High-School Grad
3.4 sq mi
ZIP Area
11,326
Density / Sq Mi
$74,341
Median Household Income
$42,947
Median Earnings
$1,381
Median Rent
$293,800
Median Home Value
Check the figures for this property
Cap Rate, Value Estimation, Potential NOI and more
View Realmo Analytics
Market
Vacancy Rate% for Multifamily in Northeast region






Frequently Asked Questions
What type of property is this?
Duplex - Each residence has three bedrooms, one full bath, and an additional room for flexible use.
Where is this duplex located?
The property is located at 981 Smith Street Providence, RI.
What is the asking price?
The asking price for this property is $849,900.
What are key features of this property?
This property features: Two units, each with 3 bedrooms, 1 full bath, and a bonus room; 3,080‑square‑foot building on a 0.12‑acre lot; Built in 1920