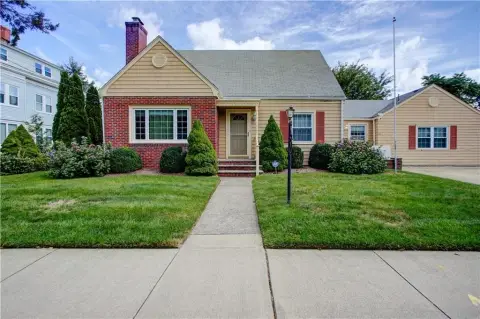
Two-Family Under Construction Corner
For Sale
$825,000
84 Coggeshall St, Providence, RI 02904
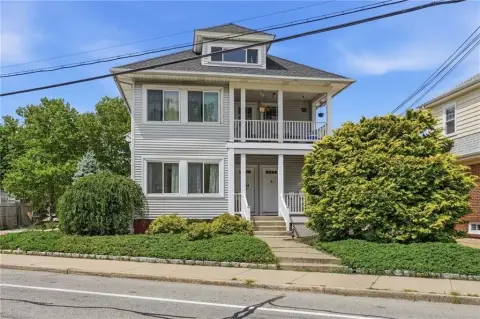
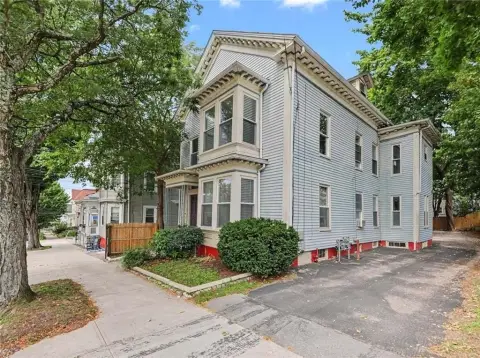
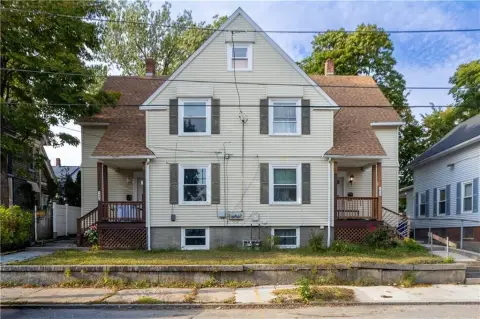
Corner lot two-family with two completed levels partially updated, offering separate utilities and laundry on each floor.
Property Size3,000 SF
Price / SF$275
Days on Market111
Property Features for 84 Coggeshall St
General Information
Standard status
Active
Size
3,000 SF
Total Parking Spaces
4
Property subtype
Multi-Family
Site & Location
Neighborhood
Charles
Additional Details
Multifamily Units
2
Building Details
Year Built
2026
Stories
2
Tenancy
Multi
Listing Agency:
RE/MAX Preferred
Listed By:
Sally Rianna · License #S30517
(401) 486-1337
Source:
Alpernandmesenbourg
Added: Jul 8
Changed: Oct 26
Last Checked: Oct 24 at 9:42PM
Displayed information is deemed reliable but is not guaranteed and should be independently verified. All listing content including descriptions, pricing, images are the copyrighted material of RE/MAX Preferred

Ask AI about this property
Review the available facts, identify missing information and prepare questions for the agent.
Investment Insights
Based on property information with market context.
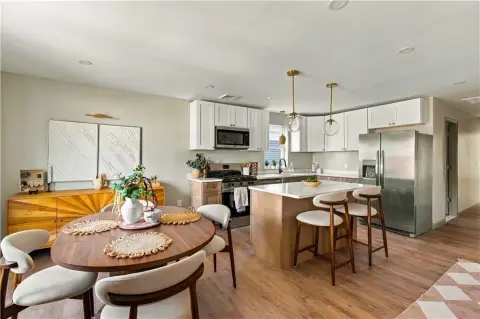
This two-family home is currently under construction with updates reported for the first level, including installed windows and completed siding. The layout is designed as an “up-and-down” two-family, with Unit 1 on the first level offering three bedrooms and one bathroom, and Unit 2 on the second floor presented in a townhouse-style configuration. Unit 2 includes an upper level with three additional bedrooms plus a rec room, for a total of six bedrooms and two full bathrooms within the unit. The property also includes a basement where window wells are planned to create an option for future bedrooms, at the buyer’s expense.
The home is specified with separate utilities and laundry area on each floor. Reported included appliances for both units are stainless steel: stove, refrigerator, microwave, and dishwasher. Heating includes both gas heat and a heat pump, and central air is included. Off-street parking for approximately 3–4 vehicles is provided, and the property is described as near Providence College, close to shopping, dining, and public transportation.
The home is specified with separate utilities and laundry area on each floor. Reported included appliances for both units are stainless steel: stove, refrigerator, microwave, and dishwasher. Heating includes both gas heat and a heat pump, and central air is included. Off-street parking for approximately 3–4 vehicles is provided, and the property is described as near Providence College, close to shopping, dining, and public transportation.
Key Highlights
- New construction two‑family (Year Built 2026) on a corner lot with two partially completed levels and updates underway
- Two separate units: Unit 1 (1st level) has 3 bedrooms and 1 bathroom; Unit 2 (2nd floor) is town‑house style with 3 bedrooms plus rec room
- Unit 2 totals 6 bedrooms and 2 full bathrooms, with additional 3 bedrooms and rec room space described for the upper level
Financial Insights
Estimated NOI and Cap Rate
NOI / Yr
$50,658
Cap Rate
6.14%
Suggested Prices Based on Cap Rates
Cap Rate 5%
$1,013,160
$1.0M
Cap Rate 7%
$723,686
$723.7K
Cap Rate 9%
$562,867
$562.9K
Market Conditions
NOI Build-Up for 3,000 SF
Gross rent
$77.4K $25.80/SF
− Vacancy
−$5.0K −$1.68/SF
EGI
$72.4K $24.12/SF
− OpEx
−$21.7K −$7.24/SF
NOI
$50.7K $16.89/SF
Area
Providence, RI
Vacancy
6.50%
Lease Rate
$25.80 /SF/Yr
Expense Ratio
30.00%
Simulate Cap Rate and NOI
Suggested Prices Based on Cap Rates
Cap Rate 5%
$1,013,160
Cap Rate 7%
$723,686
Cap Rate 9%
$562,867
Alternative Uses
Best Use
Multifamily LT 5
$723.7K
$633.2K – $844.3K
NOI $50,658 @ 7.0% cap · market cap 6.14%
Second Best
Apartment 5plus
$650.0K
$568.8K – $758.4K
NOI $45,502 @ 7.0% cap · market cap 5.52%
Theoretical Best
Office A
$1.00M
$878.2K – $1.17M
NOI $70,256 @ 7.0% cap · market cap 8.52%
Zoning and permitted uses should be independently verified with authorities.
How Realmo checks its estimates
Property Analytics
Contact the owner directly
Get the owner's phone numbers and email
Open Analytics
Lease Details
2
Residential units
Multi-tenant
Tenancy
Location Intelligence
Trade Area within ½ mile
870
Businesses Nearby
Explore this area
Business Placement
Demographics for 02904, RI
31,542
Population
14,483
Households
2.2
Avg Household Size
41
Median Age
32%
College-Educated
88%
High-School Grad
5.2 sq mi
ZIP Area
6,066
Density / Sq Mi
$64,637
Median Household Income
$47,040
Median Earnings
$1,217
Median Rent
$302,200
Median Home Value
Check the figures for this property
Cap Rate, Value Estimation, Potential NOI and more
View Realmo Analytics
Market
Vacancy Rate% for Multifamily in Northeast region






Frequently Asked Questions
What type of property is this?
Duplex - Corner lot two-family with two completed levels partially updated, offering separate utilities and laundry on each floor.
Where is this duplex located?
The property is located at 84 Coggeshall St Providence, RI.
What is the asking price?
The asking price for this property is $825,000.
What are key features of this property?
This property features: New construction two‑family (Year Built 2026) on a corner lot with two partially completed levels and updates underway; Two separate units: Unit 1 (1st level) has 3 bedrooms and 1 bathroom; Unit 2 (2nd floor) is town‑house style with 3 bedrooms plus rec room; Unit 2 totals 6 bedrooms and 2 full bathrooms, with additional 3 bedrooms and rec room space described for the upper level



