Commercial Land Near
1025 S Main St. Red Bluff, CA 96080
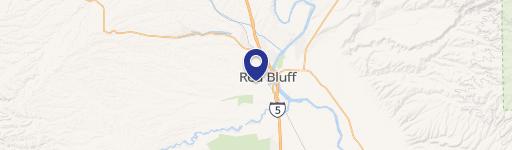
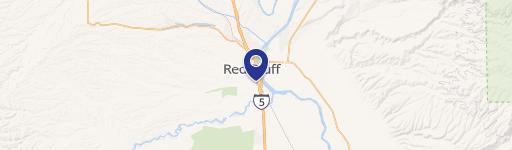
1025 S Main St., Red Bluff, CA, 96080
Contact for pricing
For Sale
Contact for pricing
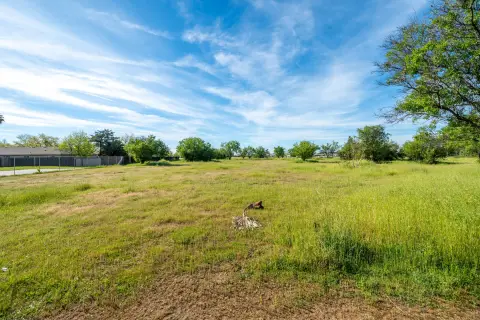
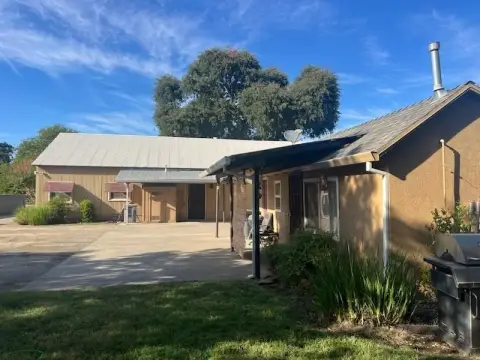
Commercial land with immediate I-5 access in Red Bluff.
Property Size29,338 SF
Lot Size0.67 Acres
Price / SF$19.74
Days on Market1322
Property Features for 1025 S Main St.
General Information
- Standard status
- Active
- Size
- 29,338 SF
- Lot size
- 0.67 Acres
- Property subtype
- Retail, Land
Listing Agency
Ethan Conrad Properties Inc
(916) 779-1000
Listed by
Race Merritt · License #CalDRE #01700659
Source
Crexi
Added: Dec 3, 2022 Checked: Jul 16 at 6:04 am
Displayed information is deemed reliable but is not guaranteed and should be independently verified. All listing content including descriptions, pricing, images are the copyrighted material of Ethan Conrad Properties Inc
Investment Insights
Based on property information with market context.
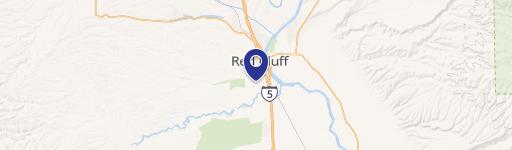
This commercial land is situated on South Main Street and Luther Road, offering immediate access to I-5 in Red Bluff, California. Co-tenants in the area include Raley’s, Ross Dress For Less, Planet Fitness, Marshall’s, Jack In The Box, GameStop, and Verizon Wireless. Nearby national tenants feature Walmart Supercenter, Walgreens, Grocery Outlet, Starbucks, O’Reilly Auto Parts, and Big 5 Sporting Goods. The property size is 29338 square feet.
Key Highlights
- Immediate access to I‑5.
- Located on South Main Street and Luther Rd.
- Co‑tenants include Raley’s, Ross Dress For Less, Planet Fitness, Marshall’s.
Property Analytics
Property Profile
Location Intelligence
Current Use by Public Records
Commercial land
Similar For Sale Nearby


FAQs
What type of property is this?
Commercial land - Commercial land with immediate I-5 access in Red Bluff.
Where is this commercial land located?
The property is located at 1025 S Main St. Red Bluff, CA.
What is the asking price?
The asking price for this property is $579,000.
What are key features of this property?
This property features: Immediate access to I‑5.; Located on South Main Street and Luther Rd.; Co‑tenants include Raley’s, Ross Dress For Less, Planet Fitness, Marshall’s.


