Clearwater Mixed-Use Redevelopment
For Sale
Contact for pricing
Pending
409 S Madison Ave, Clearwater, FL 33756
Rare Clearwater site suitable for mixed-use or multi-family redevelopment.
Property Size3,500 SF
Lot Size0.34 Acres
Days on Market1187
Property Features for 409 S Madison Ave
General Information
Standard status
Pending
Size
3,500 SF
Lot size
0.34 Acres
Property subtype
Mixed Use, Multifamily, Office, Retail
Investment Type
Redevelopment
Listing Agency:
The Boardwalk Company
Listed By:
John Quattrocki · License #FL CQ1026002
Source:
Crexi
Added: Jul 20, 2023
Changed: Oct 16
Last Checked: Oct 16 at 7:10AM
Displayed information is deemed reliable but is not guaranteed and should be independently verified. All listing content including descriptions, pricing, images are the copyrighted material of The Boardwalk Company

Ask AI about this property
Review the available facts, identify missing information and prepare questions for the agent.
Investment Insights
Based on property information with market context.
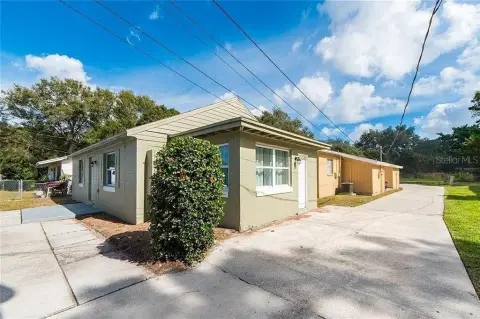
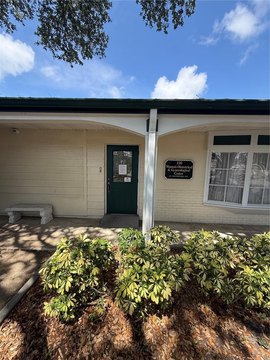
This property is located in Clearwater’s Central Business District and offers redevelopment potential. The site has existing buildings totaling approximately 3,500 square feet. It is a corner property with 150 feet of frontage on South Madison Avenue and 100 feet along Gould Street. The corner lot measures 15,000 square feet and is suitable for redevelopment into a mixed-use or multi-family project. The central Clearwater location provides easy access to roadway systems. An adjacent parking lot is available for purchase.
Key Highlights
- Rare redevelopment opportunity in Clearwater's Central Business District.
- 15,000 SF corner lot suitable for mixed‑use or multi‑family redevelopment.
- Corner property with 150 feet of frontage on South Madison Ave and 100 feet on Gould St.
Financial Insights
Estimated NOI and Cap Rate
NOI / Yr
$63,092
Cap Rate
9.08%
Suggested Prices Based on Cap Rates
Cap Rate 5%
$1,261,840
$1.3M
Cap Rate 7%
$901,314
$901.3K
Cap Rate 9%
$701,022
$701.0K
Market Conditions
NOI Build-Up for 3,500 SF
Gross rent
$91.1K $26.04/SF
− Vacancy
−$7.0K −$2.01/SF
EGI
$84.1K $24.03/SF
− OpEx
−$21.0K −$6.01/SF
NOI
$63.1K $18.03/SF
Area
Clearwater, FL
Vacancy
7.70%
Lease Rate
$26.04 /SF/Yr
Expense Ratio
25.00%
Simulate Cap Rate and NOI
Suggested Prices Based on Cap Rates
Cap Rate 5%
$1,261,840
Cap Rate 7%
$901,314
Cap Rate 9%
$701,022
Alternative Uses
Best Use
Office B
$901.3K
$788.7K – $1.05M
NOI $63,092 @ 7.0% cap · market cap 9.08%
Second Best
Mixed Use
$627.8K
$549.3K – $732.4K
NOI $43,943 @ 7.0% cap · market cap 6.32%
Theoretical Best
Office A
$982.0K
$859.2K – $1.15M
NOI $68,737 @ 7.0% cap · market cap 9.89%
Zoning and permitted uses should be independently verified with authorities.
How Realmo checks its estimates
Property Analytics
Unlock full access to Insights
Subscribe to Realmo Intelligence
Open Analytics
Current Use
Location Intelligence
Trade Area within ½ mile
3,378
Businesses Nearby
Explore this area
Business Placement
Demographics for 33756, FL
31,807
Population
15,474
Households
2.1
Avg Household Size
48
Median Age
30%
College-Educated
91%
High-School Grad
7.2 sq mi
ZIP Area
4,418
Density / Sq Mi
$63,990
Median Household Income
$38,563
Median Earnings
$1,382
Median Rent
$335,800
Median Home Value
Check the figures for this property
Cap Rate, Value Estimation, Potential NOI and more
View Realmo Analytics
Market
Vacancy Rate% for Office in South region







Frequently Asked Questions
What type of property is this?
Mixed-use property - Rare Clearwater site suitable for mixed-use or multi-family redevelopment.
Where is this mixed-use property located?
The property is located at 409 S Madison Ave Clearwater, FL.
What is the asking price?
The asking price for this property is $695,000.
What are key features of this property?
This property features: Rare redevelopment opportunity in Clearwater's Central Business District.; 15,000 SF corner lot suitable for mixed‑use or multi‑family redevelopment.; Corner property with 150 feet of frontage on South Madison Ave and 100 feet on Gould St.


