Stamford Industrial Building For
For Sale
Contact for pricing
36 Ludlow St, Stamford, CT 06902
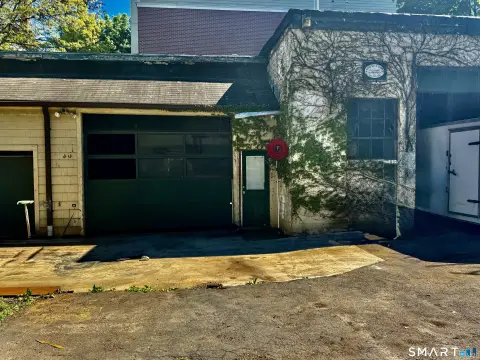
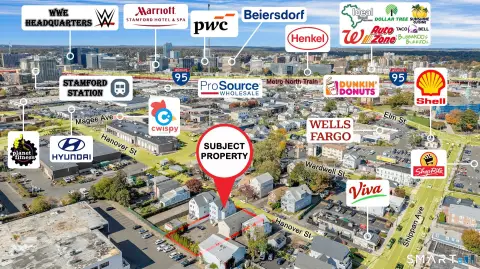
5,480 SF industrial building, close to downtown and I-95.
Property Size5,480 SF
Lot Size0.27 Acres
Price / SF$291.97
Days on Market1122
Property Features for 36 Ludlow St
General Information
Standard status
Active
Size
5,480 SF
Total Parking Spaces
10
Lot size
0.27 Acres
Property subtype
Industrial
Zoning
RMF
Lease Type
NNN
Investment Type
Owner/User
Building Details
Year Built
1910
Buildings
1
Stories
1
Units
1
Tenancy
Single
Listing Agency:
EAC Properties LLC
Listed By:
Andreas Senie · License #REB 0790681
Source:
Crexi
Added: Sep 13, 2023
Changed: Oct 8
Last Checked: Oct 7 at 11:45AM
Displayed information is deemed reliable but is not guaranteed and should be independently verified. All listing content including descriptions, pricing, images are the copyrighted material of EAC Properties LLC
Investment Insights
Based on property information with market context.
The property at 36 Ludlow St, Stamford, Connecticut, is a 5,480 SF single-story industrial building suitable for an owner occupant. The property is situated on a 0.27-acre lot that is completely fenced, providing privacy and security. Its location offers convenient access to I-95 and proximity to downtown Stamford. The surrounding area features retail and commercial activity, with employee daytime traffic. The property is located close to downtown revitalization zones. The University of Connecticut and Harbor Point are within 3 miles of the property, and major developments continue to multiply in the immediate area.
Key Highlights
- Ideal for owner occupant with 5,480 SF single‑story industrial building.
- Strategic location close to downtown Stamford with easy access to I‑95.
- Completely fenced .27 acre property providing privacy and security.**
Financial Insights
Estimated NOI and Cap Rate
NOI / Yr
$61,574
Cap Rate
3.85%
Suggested Prices Based on Cap Rates
Cap Rate 5%
$1,231,480
$1.2M
Cap Rate 7%
$879,629
$879.6K
Cap Rate 9%
$684,156
$684.2K
Market Conditions
NOI Build-Up for 5,480 SF
Gross rent
$93.4K $17.04/SF
− Vacancy
−$5.4K −$0.99/SF
EGI
$88.0K $16.05/SF
− OpEx
−$26.4K −$4.82/SF
NOI
$61.6K $11.24/SF
Area
Stamford, CT
Vacancy
5.80%
Lease Rate
$17.04 /SF/Yr
Expense Ratio
30.00%
Simulate Cap Rate and NOI
Suggested Prices Based on Cap Rates
Cap Rate 5%
$1,231,480
Cap Rate 7%
$879,629
Cap Rate 9%
$684,156
Alternative Uses
Best Use
Industrial
$879.6K
$769.7K – $1.03M
NOI $61,574 @ 7.0% cap · market cap 3.85%
Second Best
—
—
no second resolved use
Theoretical Best
Office A
$1.98M
$1.73M – $2.31M
NOI $138,700 @ 7.0% cap · market cap 8.67%
Zoning and permitted uses should be independently verified with authorities.
Property Analytics
Unlock full access to Insights
Subscribe to Realmo Intelligence
Open Analytics
Current Use
Location Intelligence
Trade Area within ½ mile
2,912
Businesses Nearby
Explore this area
Business Placement
Demographics for 06902, CT
69,192
Population
30,142
Households
2.3
Avg Household Size
36
Median Age
44%
College-Educated
85%
High-School Grad
10.0 sq mi
ZIP Area
6,919
Density / Sq Mi
$92,527
Median Household Income
$48,285
Median Earnings
$2,139
Median Rent
$515,000
Median Home Value
Check the figures for this property
Cap Rate, Value Estimation, Potential NOI and more
View Realmo Analytics
Market
Vacancy Rate% for Industrial in Northeast region

Questions? Ask Rey
Realmo’s AI knows this listing — price, zoning, demand, history. Ask anything.






Frequently Asked Questions
What type of property is this?
Industrial property - 5,480 SF industrial building, close to downtown and I-95.
Where is this industrial property located?
The property is located at 36 Ludlow St Stamford, CT.
What is the asking price?
The asking price for this property is $1,600,000.
What are key features of this property?
This property features: Ideal for owner occupant with **5,480 SF single‑story industrial building**.; Strategic location close to downtown Stamford with easy access to I‑95.; Completely fenced .27 acre property providing privacy and security.**



