Six-Unit Apartment
For Sale
$595,000
936 Sheep Island Rd Unit A & B, Summerville, SC 29486
Six residential units share a parcel, with covered carports, private patios, and a fenced yard serving the rear units.
Property Size3,292 SF
Price / SF$180.74
Days on Market71
Property Features for 936 Sheep Island Rd Unit A & B
General Information
Standard status
Active
Size
3,292 SF
Property subtype
Multi-Family
Additional Details
Gross Income
$79,200
Multifamily Units
6
Amenities
covered front porch
covered carport
private fenced yard
Building Details
Year Built
2008
Listing Agency:
Connie White Real Estate & Design, LLC
Listed By:
Connie White · License #78160
(843) 532-3356
Source:
Charlestonareapropertyguide
Added: Aug 4
Changed: Oct 13
Last Checked: Oct 12 at 8:17PM
Displayed information is deemed reliable but is not guaranteed and should be independently verified. All listing content including descriptions, pricing, images are the copyrighted material of Connie White Real Estate & Design, LLC
Investment Insights
Based on property information with market context.
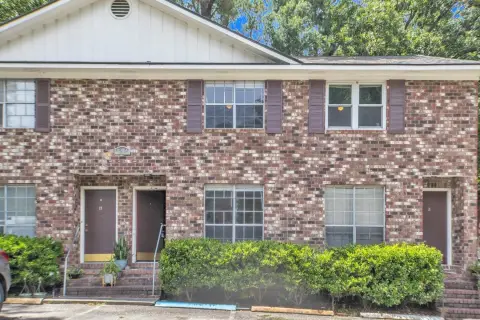
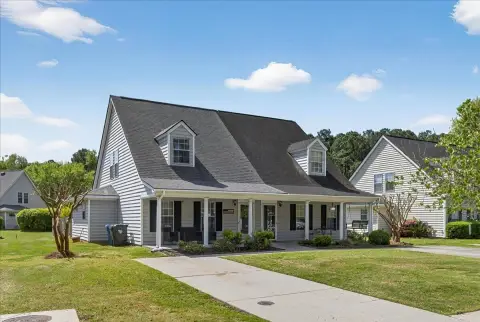
Built in 2008, this 3,292-square-foot apartment property combines a front duplex with four additional units positioned behind it on the same parcel. The two front residences are mirror-image layouts, each with a covered porch, and they share a carport. Units C, D, E, and F have access to a private fenced yard, along with individual covered carport or patio areas.
Each unit is heated and cooled with window units. Two septic tanks serve the property. The asset is located at 936 Sheep Island Rd Unit A & B, Summerville, SC 29486, and offers six residential units within one multifamily configuration.
Each unit is heated and cooled with window units. Two septic tanks serve the property. The asset is located at 936 Sheep Island Rd Unit A & B, Summerville, SC 29486, and offers six residential units within one multifamily configuration.
Key Highlights
- Six total apartment units on one parcel
- 3,292 SF property built in 2008
- Front duplex includes two mirror‑image units with covered porches
Financial Insights
Estimated NOI and Cap Rate
NOI / Yr
$34,441
Cap Rate
5.79%
Suggested Prices Based on Cap Rates
Cap Rate 5%
$688,820
$688.8K
Cap Rate 7%
$492,014
$492.0K
Cap Rate 9%
$382,678
$382.7K
Market Conditions
NOI Build-Up for 3,292 SF
Gross rent
$67.6K $20.52/SF
− Vacancy
−$4.9K −$1.50/SF
EGI
$62.6K $19.02/SF
− OpEx
−$28.2K −$8.56/SF
NOI
$34.4K $10.46/SF
Area
Dorchester County, SC
Vacancy
7.30%
Lease Rate
$20.52 /SF/Yr
Expense Ratio
45.00%
Simulate Cap Rate and NOI
Suggested Prices Based on Cap Rates
Cap Rate 5%
$688,820
Cap Rate 7%
$492,014
Cap Rate 9%
$382,678
Alternative Uses
Best Use
Apartment 5plus
$492.0K
$430.5K – $574.0K
NOI $34,441 @ 7.0% cap · market cap 5.79%
Second Best
—
—
no second resolved use
Theoretical Best
Office A
$2.46M
$2.16M – $2.87M
NOI $172,455 @ 7.0% cap · market cap 28.98%
Zoning and permitted uses should be independently verified with authorities.
How Realmo checks its estimates
Property Analytics
Current Use
Lease Details
6
Residential units
Location Intelligence
Trade Area within ½ mile
7
Businesses Nearby
Explore this area
Business Placement
Demographics for 29486, SC
41,148
Population
19,452
Households
2.1
Avg Household Size
35
Median Age
31%
College-Educated
90%
High-School Grad
62.3 sq mi
ZIP Area
660
Density / Sq Mi
$87,386
Median Household Income
$45,533
Median Earnings
$1,612
Median Rent
$329,300
Median Home Value
Market
Vacancy Rate% for Multifamily in South region

Questions? Ask Rey
Realmo’s AI knows this listing — price, zoning, demand, history. Ask anything.





Frequently Asked Questions
What type of property is this?
Apartment building - Six residential units share a parcel, with covered carports, private patios, and a fenced yard serving the rear units.
Where is this apartment building located?
The property is located at 936 Sheep Island Rd Unit A & B Summerville, SC.
What is the asking price?
The asking price for this property is $595,000.
What are key features of this property?
This property features: Six total apartment units on one parcel; 3,292 SF property built in 2008; Front duplex includes two mirror‑image units with covered porches


