Licensed Residential Detox Treatment
For Sale
$1,590,000
9350 Tampa, Northridge, CA 91324
Fully licensed 6-bed residential detox program with a remodeled, furnished residence and onsite amenities for patient and staff operations.
Property Size2,620 SF
Lot Size0.18 Acres
Price / SF$606.87
Days on Market140
Property Features for 9350 Tampa
General Information
Standard status
Active
Size
2,620 SF
Total Parking Spaces
3
Lot size
0.18 Acres
Property subtype
Investment
Additional Details
Business Included
Yes
Building Details
Building Size
2,620 SF
Year Built
1978
Stories
2
Units
1
Listing Agency:
Berkshire Hathaway HomeServices California Properties
Listed By:
Arthur Aslanian · License #01291836
(818) 335-1239
Source:
Elliman
Added: Jun 4
Changed: Oct 20
Last Checked: Oct 20 at 9:11PM
Displayed information is deemed reliable but is not guaranteed and should be independently verified. All listing content including descriptions, pricing, images are the copyrighted material of Berkshire Hathaway HomeServices California Properties

Ask AI about this property
Review the available facts, identify missing information and prepare questions for the agent.
Investment Insights
Based on property information with market context.
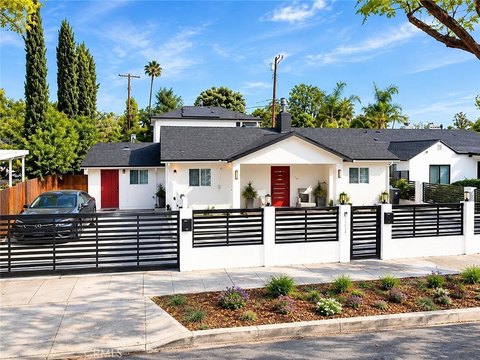
This offering combines real estate with a fully licensed, Joint Commission Accredited 6-bed residential detoxification and treatment facility. Advance Life Recovery is approved for clinically managed withdrawal management and residential treatment, with certifications from DHCS, CDPH, and CMS. The property includes a remodeled and fully furnished 4-bed, 3-bath residence designed to support day-to-day operations, featuring a large living room with vaulted ceilings, a formal dining area, and a remodeled gourmet kitchen with quartz countertops and high-end appliances. Additional interior features include a bedroom downstairs, a one-on-one consultation room, a private office, laundry room with sink, recessed lighting, abundant storage, and direct garage access.
Located in the heart of Northridge, the property sits directly across from Northridge Fashion Center. The setting provides convenient access to food services, grocery stores, pharmacies, retail shopping, fitness centers, medical-related services, entertainment, and other day-to-day conveniences supporting staff and clients.
The facility is positioned for a buyer seeking a ready-to-operate residential detoxification and treatment business with the underlying real estate available as part of the transaction, or the option to lease the real estate to the operator. Outdoor amenities include a pool, spa, covered patios, activity areas, and a 3-car garage, complementing the residential nature of the program.
Located in the heart of Northridge, the property sits directly across from Northridge Fashion Center. The setting provides convenient access to food services, grocery stores, pharmacies, retail shopping, fitness centers, medical-related services, entertainment, and other day-to-day conveniences supporting staff and clients.
The facility is positioned for a buyer seeking a ready-to-operate residential detoxification and treatment business with the underlying real estate available as part of the transaction, or the option to lease the real estate to the operator. Outdoor amenities include a pool, spa, covered patios, activity areas, and a 3-car garage, complementing the residential nature of the program.
Key Highlights
- Fully licensed, Joint Commission Accredited 6‑bed residential detoxification and treatment facility for clinically managed withdrawal management and residential treatment
- Facility approvals include certifications from DHCS, CDPH, and CMS, with licensing and readiness for operation
- 1978‑built property includes a remodeled, fully furnished 4‑bed, 3‑bath residence with approx. 2,620 SF of living space
Financial Insights
Estimated NOI and Cap Rate
NOI / Yr
$48,594
Cap Rate
3.06%
Suggested Prices Based on Cap Rates
Cap Rate 5%
$971,880
$971.9K
Cap Rate 7%
$694,200
$694.2K
Cap Rate 9%
$539,933
$539.9K
Market Conditions
NOI Build-Up for 2,620 SF
Gross rent
$88.0K $33.60/SF
− Vacancy
−$7.0K −$2.69/SF
EGI
$81.0K $30.91/SF
− OpEx
−$32.4K −$12.36/SF
NOI
$48.6K $18.55/SF
Area
Los Angeles, CA
Vacancy
8.00%
Lease Rate
$33.60 /SF/Yr
Expense Ratio
40.00%
Simulate Cap Rate and NOI
Suggested Prices Based on Cap Rates
Cap Rate 5%
$971,880
Cap Rate 7%
$694,200
Cap Rate 9%
$539,933
Alternative Uses
Best Use
Healthcare Medical
$694.2K
$607.4K – $809.9K
NOI $48,594 @ 7.0% cap · market cap 3.06%
Second Best
—
—
no second resolved use
Theoretical Best
Multifamily LT 5
$53.08M
$46.44M – $61.93M
NOI $3,715,574 @ 7.0% cap · market cap 233.68%
Zoning and permitted uses should be independently verified with authorities.
How Realmo checks its estimates
Property Analytics
Unlock full access to Insights
Subscribe to Realmo Intelligence
Open Analytics
Current Use
Lease Details
Turnkey business
Opportunity
Location Intelligence
Trade Area within ½ mile
1,680
Businesses Nearby
Explore this area
Business Placement
Demographics for 91324, CA
29,500
Population
11,408
Households
2.6
Avg Household Size
39
Median Age
38%
College-Educated
86%
High-School Grad
4.3 sq mi
ZIP Area
6,860
Density / Sq Mi
$99,834
Median Household Income
$46,513
Median Earnings
$2,286
Median Rent
$869,200
Median Home Value
Check the figures for this property
Cap Rate, Value Estimation, Potential NOI and more
View Realmo Analytics



Frequently Asked Questions
What type of property is this?
Rehabilitation center - Fully licensed 6-bed residential detox program with a remodeled, furnished residence and onsite amenities for patient and staff operations.
Where is this rehabilitation center located?
The property is located at 9350 Tampa Northridge, CA.
What is the asking price?
The asking price for this property is $1,590,000.
What are key features of this property?
This property features: Fully licensed, Joint Commission Accredited 6‑bed residential detoxification and treatment facility for clinically managed withdrawal management and residential treatment; Facility approvals include certifications from DHCS, CDPH, and CMS, with licensing and readiness for operation; 1978‑built property includes a remodeled, fully furnished 4‑bed, 3‑bath residence with approx. 2,620 SF of living space