Three-Building Mixed-Use
For Sale
$325,000
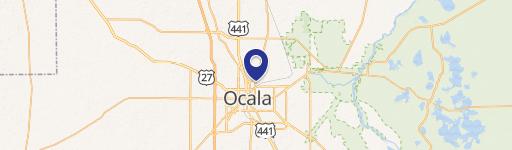
934 NW 17th Ave, Ocala, FL 34475
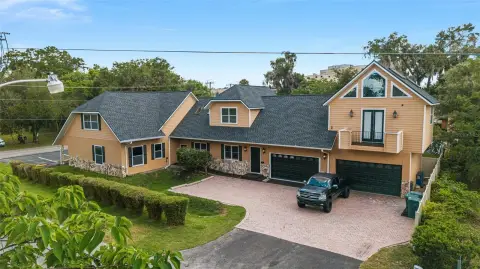
B-4-zoned property combines a residence, detached garage, and warehouse with industrial electrical service.
Property Size3,507 SF
Price / SF$92.67
Days on Market59
Property Features for 934 NW 17th Ave
General Information
Standard status
Active
Size
3,507 SF
Zoning
B-4
Warehouse & Industrial
Warehouse Space
2,355 SF
Three-Phase Power
Yes
Conditioned Warehouse
No
Building Details
Year Built
1965
Buildings
3
Listing Agency:
WEICHERT REALTORS HALLMARK PRO
Listed By:
Rose Charboneau · License #3357406
(352) 875-1976
Source:
Livewelltampabay
Added: Aug 17
Changed: Oct 8
Last Checked: Oct 12 at 10:26PM
Displayed information is deemed reliable but is not guaranteed and should be independently verified. All listing content including descriptions, pricing, images are the copyrighted material of WEICHERT REALTORS HALLMARK PRO
Investment Insights
Based on property information with market context.
This B-4-zoned mixed-use property includes three separate buildings totaling 3,507 square feet: a residential building with a 2/1 layout, a 24' x 24' garage, and a 2,355-square-foot warehouse. Each building carries its own address. The warehouse is equipped with 3-phase high-leg electrical service and compressed-air outlets throughout. Air conditioning and heat are not present in the garage or warehouse. The property was built in 1965, and its septic system was installed in 2019.
Located at 934 NW 17th Ave in Ocala, the property combines residential, garage, and warehouse improvements within one B-4 commercial-zoned site.
Located at 934 NW 17th Ave in Ocala, the property combines residential, garage, and warehouse improvements within one B-4 commercial-zoned site.
Key Highlights
- Three separate buildings totaling 3,507 square feet
- 2,355‑square‑foot main warehouse with 3‑phase high‑leg service
- Residential building with a 2/1 layout
Financial Insights
Estimated NOI and Cap Rate
NOI / Yr
$29,004
Cap Rate
8.92%
Suggested Prices Based on Cap Rates
Cap Rate 5%
$580,080
$580.1K
Cap Rate 7%
$414,343
$414.3K
Cap Rate 9%
$322,267
$322.3K
Market Conditions
NOI Build-Up for 3,507 SF
Gross rent
$48.4K $13.80/SF
− Vacancy
−$3.8K −$1.08/SF
EGI
$44.6K $12.72/SF
− OpEx
−$15.6K −$4.45/SF
NOI
$29.0K $8.27/SF
Area
Marion County, FL
Vacancy
7.80%
Lease Rate
$13.80 /SF/Yr
Expense Ratio
35.00%
Simulate Cap Rate and NOI
Suggested Prices Based on Cap Rates
Cap Rate 5%
$580,080
Cap Rate 7%
$414,343
Cap Rate 9%
$322,267
Alternative Uses
Best Use
Warehouse
$697.9K
$610.6K – $814.2K
NOI $48,851 @ 7.0% cap · market cap 15.03%
Second Best
Mixed Use
$629.2K
$550.5K – $734.0K
NOI $44,042 @ 7.0% cap · market cap 13.55%
Theoretical Best
Office A
$1.92M
$1.68M – $2.23M
NOI $134,056 @ 7.0% cap · market cap 41.25%
Zoning and permitted uses should be independently verified with authorities.
How Realmo checks its estimates
Property Analytics
Unlock full access to Insights
Subscribe to Realmo Intelligence
Open Analytics
Current Use
Location Intelligence
Trade Area within ½ mile
310
Businesses Nearby
Explore this area
Business Placement
Demographics for 34475, FL
14,780
Population
5,668
Households
2.6
Avg Household Size
38
Median Age
13%
College-Educated
84%
High-School Grad
27.8 sq mi
ZIP Area
532
Density / Sq Mi
$33,515
Median Household Income
$24,854
Median Earnings
$871
Median Rent
$170,300
Median Home Value
Check the figures for this property
Cap Rate, Value Estimation, Potential NOI and more
View Realmo Analytics
Market
Vacancy Rate% for Industrial in South region

Questions? Ask Rey
Realmo’s AI knows this listing — price, zoning, demand, history. Ask anything.






Frequently Asked Questions
What type of property is this?
Mixed-use property - B-4-zoned property combines a residence, detached garage, and warehouse with industrial electrical service.
Where is this mixed-use property located?
The property is located at 934 NW 17th Ave Ocala, FL.
What is the asking price?
The asking price for this property is $325,000.
What are key features of this property?
This property features: Three separate buildings totaling 3,507 square feet; 2,355‑square‑foot main warehouse with 3‑phase high‑leg service; Residential building with a 2/1 layout