Live-Work Property With Paint
For Sale
$550,000
236 NE 13th Pl, Ocala, FL 34470
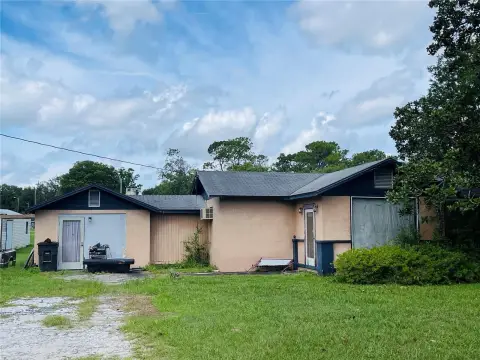
Combined residence and workshop supports on-site living alongside automotive paint and body operations.
Property Size1,404 SF
Price / SF$391.74
Days on Market61
Property Features for 236 NE 13th Pl
General Information
Standard status
Active
Size
1,404 SF
Amenities
paint booth
window air conditioning
Building Details
Year Built
1953
Buildings
2
Listing Agency:
COLDWELL BANKER ELLISON REALTY O
Listed By:
Zell Hall · License #530791
(352) 812-4859
Source:
Livewelltampabay
Added: Aug 15
Changed: Sep 2
Last Checked: Oct 7 at 2:37PM
Displayed information is deemed reliable but is not guaranteed and should be independently verified. All listing content including descriptions, pricing, images are the copyrighted material of COLDWELL BANKER ELLISON REALTY O
Investment Insights
Based on property information with market context.
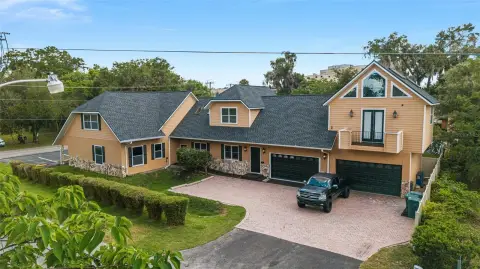
This live-work property combines a rebuilt three-bedroom, two-bath residence with an office and workshop area. The home was reconstructed from the ground up using pressure-treated wood, with foamed insulation in the walls and attic. Window air conditioning serves the office portion.
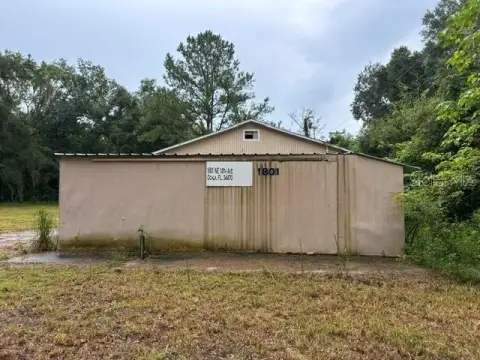
The commercial area is configured for paint and body work and includes a certified paint booth with a fire-suppression system recently brought up to code. The booth can accommodate a pickup truck. The City of Ocala has allowed the residential home to remain with the office and workshop, creating a combined residential and commercial setup at 236 NE 13th Pl.
The commercial area is configured for paint and body work and includes a certified paint booth with a fire-suppression system recently brought up to code. The booth can accommodate a pickup truck. The City of Ocala has allowed the residential home to remain with the office and workshop, creating a combined residential and commercial setup at 236 NE 13th Pl.
Key Highlights
- Three‑bedroom, two‑bath residential component
- Office and workshop area with window A/C
- Certified paint booth accommodates a pickup truck
Financial Insights
Estimated NOI and Cap Rate
NOI / Yr
$36,308
Cap Rate
6.60%
Suggested Prices Based on Cap Rates
Cap Rate 5%
$726,160
$726.2K
Cap Rate 7%
$518,686
$518.7K
Cap Rate 9%
$403,422
$403.4K
Market Conditions
NOI Build-Up for 1,404 SF
Gross rent
$52.7K $37.56/SF
− Vacancy
−$4.3K −$3.08/SF
EGI
$48.4K $34.48/SF
− OpEx
−$12.1K −$8.62/SF
NOI
$36.3K $25.86/SF
Area
Marion County, FL
Vacancy
8.20%
Lease Rate
$37.56 /SF/Yr
Expense Ratio
25.00%
Simulate Cap Rate and NOI
Suggested Prices Based on Cap Rates
Cap Rate 5%
$726,160
Cap Rate 7%
$518,686
Cap Rate 9%
$403,422
Alternative Uses
Best Use
Office B
$518.7K
$453.9K – $605.1K
NOI $36,308 @ 7.0% cap · market cap 6.60%
Second Best
Retail
$504.5K
$441.4K – $588.6K
NOI $35,313 @ 7.0% cap · market cap 6.42%
Theoretical Best
Office A
$766.7K
$670.9K – $894.5K
NOI $53,668 @ 7.0% cap · market cap 9.76%
Zoning and permitted uses should be independently verified with authorities.
How Realmo checks its estimates
Property Analytics
Unlock full access to Insights
Subscribe to Realmo Intelligence
Open Analytics
Current Use
Location Intelligence
Trade Area within ½ mile
806
Businesses Nearby
Explore this area
Business Placement
Demographics for 34470, FL
20,483
Population
10,121
Households
2
Avg Household Size
42
Median Age
23%
College-Educated
90%
High-School Grad
13.4 sq mi
ZIP Area
1,529
Density / Sq Mi
$49,592
Median Household Income
$36,957
Median Earnings
$1,124
Median Rent
$171,500
Median Home Value
Check the figures for this property
Cap Rate, Value Estimation, Potential NOI and more
View Realmo Analytics
Market
Vacancy Rate% for Office in South region

Questions? Ask Rey
Realmo’s AI knows this listing — price, zoning, demand, history. Ask anything.







Frequently Asked Questions
What type of property is this?
Live-work space - Combined residence and workshop supports on-site living alongside automotive paint and body operations.
Where is this live-work space located?
The property is located at 236 NE 13th Pl Ocala, FL.
What is the asking price?
The asking price for this property is $550,000.
What are key features of this property?
This property features: Three‑bedroom, two‑bath residential component; Office and workshop area with window A/C; Certified paint booth accommodates a pickup truck