Historic Mixed-Use Property For
For Sale
Contact for pricing
571 E Main St, Spartanburg, SC 29302
4,688 SF mixed-use property in Converse Heights neighborhood.
Property Size4,688 SF
Lot Size0.48 Acres
Price / SF$271.97
Days on Market852
Property Features for 571 E Main St
General Information
Standard status
Active
Size
4,688 SF
Lot size
0.48 Acres
Property subtype
Office, Retail
Zoning
LOD (Limited Office District) & R8
Building Details
Year Built
1909
Listing Agency:
Spencer/Hines Properties Spartanburg
Listed By:
Andy Hayes · License #SC 13179
(864) 706-0189
Source:
Crexi
Added: Jun 15, 2024
Changed: Oct 8
Last Checked: Oct 12 at 8:52PM
Displayed information is deemed reliable but is not guaranteed and should be independently verified. All listing content including descriptions, pricing, images are the copyrighted material of Spencer/Hines Properties Spartanburg
Investment Insights
Based on property information with market context.
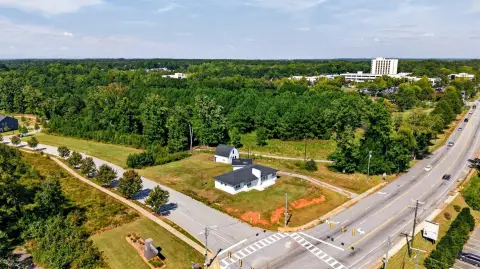
The Charles Pinckney Wofford House, built in 1909 and extensively renovated within the last 10 years, offers approximately 4,688 square feet of space on a 0.48-acre lot. Designed by Atlanta architect Gottfried Norman, this property features multiple rooms and has potential for conversion to a professional office. Previous uses include a gift shop and restaurant. The property is located on E. Main Street at the entrance to the Converse Heights neighborhood, directly across from Converse College, offering high visibility with approximately 26,000 vehicles per day. It is also located minutes from downtown. Street parking is available. The property is currently split zoned as LOD (Limited Office District) and R8.
Key Highlights
- High visibility location on E. Main Street with approximately 26,000 vehicles per day.
- Situated at the entrance to Converse Heights neighborhood and directly across from Converse College.
- Extensively renovated within the last 10 years.
Financial Insights
Estimated NOI and Cap Rate
NOI / Yr
$72,467
Cap Rate
5.68%
Suggested Prices Based on Cap Rates
Cap Rate 5%
$1,449,340
$1.4M
Cap Rate 7%
$1,035,243
$1.0M
Cap Rate 9%
$805,189
$805.2K
Market Conditions
NOI Build-Up for 4,688 SF
Gross rent
$113.1K $24.12/SF
− Vacancy
−$16.5K −$3.51/SF
EGI
$96.6K $20.61/SF
− OpEx
−$24.2K −$5.15/SF
NOI
$72.5K $15.46/SF
Area
Spartanburg County, SC
Vacancy
14.55%
Lease Rate
$24.12 /SF/Yr
Expense Ratio
25.00%
Simulate Cap Rate and NOI
Suggested Prices Based on Cap Rates
Cap Rate 5%
$1,449,340
Cap Rate 7%
$1,035,243
Cap Rate 9%
$805,189
Alternative Uses
Best Use
Office B
$1.04M
$905.8K – $1.21M
NOI $72,467 @ 7.0% cap · market cap 5.68%
Second Best
Mixed Use
$884.0K
$773.5K – $1.03M
NOI $61,882 @ 7.0% cap · market cap 4.85%
Theoretical Best
Warehouse
$3.64M
$3.18M – $4.25M
NOI $254,758 @ 7.0% cap · market cap 19.98%
Zoning and permitted uses should be independently verified with authorities.
How Realmo checks its estimates
Property Analytics
Unlock full access to Insights
Subscribe to Realmo Intelligence
Open Analytics
Current Use
Location Intelligence
Trade Area within ½ mile
1,266
Businesses Nearby
Explore this area
Business Placement
Demographics for 29302, SC
17,356
Population
8,169
Households
2.1
Avg Household Size
42
Median Age
41%
College-Educated
92%
High-School Grad
50.7 sq mi
ZIP Area
342
Density / Sq Mi
$77,428
Median Household Income
$44,476
Median Earnings
$1,031
Median Rent
$264,000
Median Home Value
Check the figures for this property
Cap Rate, Value Estimation, Potential NOI and more
View Realmo Analytics
Market
Vacancy Rate% for Office in South region

Questions? Ask Rey
Realmo’s AI knows this listing — price, zoning, demand, history. Ask anything.




Frequently Asked Questions
What type of property is this?
Mixed-use property - 4,688 SF mixed-use property in Converse Heights neighborhood.
Where is this mixed-use property located?
The property is located at 571 E Main St Spartanburg, SC.
What is the asking price?
The asking price for this property is $1,275,000.
What are key features of this property?
This property features: High visibility location on E. Main Street with approximately 26,000 vehicles per day.; Situated at the entrance to Converse Heights neighborhood and directly across from Converse College.; Extensively renovated within the last 10 years.


