New Construction Mixed-Use
For Sale
Contact for pricing
8966 SW 40th St, Miami, FL 33165
Versatile 4-story building for retail, office, or medical use.
Property Size45,829 SF
Price / SF$322.94
Days on Market764
Property Features for 8966 SW 40th St
General Information
Standard status
Active
Size
45,829 SF
Class
A
Total Parking Spaces
45
Property subtype
Mixed Use, Office
Zoning
6061
Investment Type
Owner/User
Building Details
Year Built
2024
Stories
5
Listing Agency:
ONE SOTHEBY'S INTERNATIONAL REALTY
Listed By:
Martin Elortegui · License #3166144
(305) 987-6807
Source:
Crexi
Added: Sep 6, 2024
Changed: Aug 27
Last Checked: Aug 14 at 5:58AM
Displayed information is deemed reliable but is not guaranteed and should be independently verified. All listing content including descriptions, pricing, images are the copyrighted material of ONE SOTHEBY'S INTERNATIONAL REALTY
Investment Insights
Based on property information with market context.
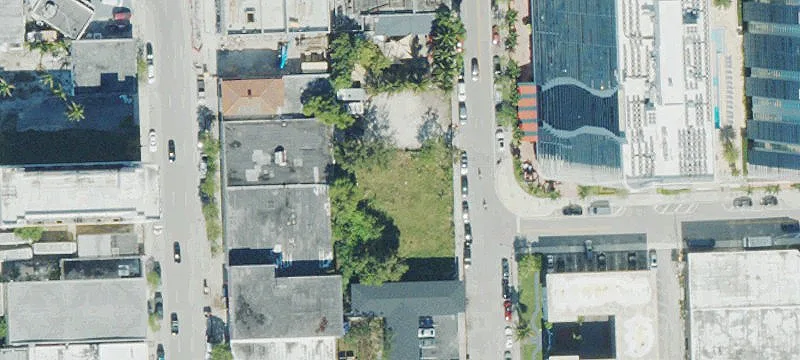
This is a Class "A" new construction building located on the Bird Road Corridor, west of the Palmetto Expressway. The 4-story structure offers 45,829 square feet of versatile space suitable for retail, office, or medical use. The first floor includes 3,021 square feet of retail space, while the second through fourth floors provide 12,808 square feet of office space. The property features a 24,127 square foot parking area with a 43-space garage, expandable to 80 spaces with valet service. A 1,500 square foot covered canopy is located on the roof. The location benefits from a high daily traffic count exceeding 60,000 vehicles, ensuring maximum exposure. The building offers multiple side-seen faces for signage, providing 100x50 feet of exposure. It also includes XL stainless finish elevators suitable for stretchers or medical equipment. The property is suitable for various uses, including primary care, urgent care, imaging, labs, social services, or as a Corporate Business Center. Seller financing is available.
Key Highlights
- New construction Class "A" building offering versatile space.
- High‑traffic location on Bird Rd Corridor with 60k+ daily traffic count and multiple signage faces.
- Ample parking with a 43‑space garage, expandable to 80 with valet service.
Financial Insights
Estimated NOI and Cap Rate
NOI / Yr
$1,082,710
Cap Rate
7.32%
Suggested Prices Based on Cap Rates
Cap Rate 5%
$21,654,200
$21.7M
Cap Rate 7%
$15,467,286
$15.5M
Cap Rate 9%
$12,030,111
$12.0M
Market Conditions
NOI Build-Up for 45,829 SF
Gross rent
$1.92M $42.00/SF
− Vacancy
−$192.5K −$4.20/SF
EGI
$1.73M $37.80/SF
− OpEx
−$649.6K −$14.18/SF
NOI
$1.08M $23.63/SF
Area
Miami, FL
Vacancy
10.00%
Lease Rate
$42.00 /SF/Yr
Expense Ratio
37.50%
Simulate Cap Rate and NOI
Suggested Prices Based on Cap Rates
Cap Rate 5%
$21,654,200
Cap Rate 7%
$15,467,286
Cap Rate 9%
$12,030,111
Alternative Uses
Best Use
Mixed Use
$15.47M
$13.53M – $18.05M
NOI $1,082,710 @ 7.0% cap · market cap 7.32%
Second Best
—
—
no second resolved use
Theoretical Best
Specialty Retail
$30.93M
$27.07M – $36.09M
NOI $2,165,441 @ 7.0% cap · market cap 14.63%
Zoning and permitted uses should be independently verified with authorities.
Property Analytics
Unlock full access to Insights
Subscribe to Realmo Intelligence
Open Analytics
Current Use
Location Intelligence
Trade Area within ½ mile
1,306
Businesses Nearby
Explore this area
Business Placement
Demographics for 33165, FL
54,070
Population
17,813
Households
3
Avg Household Size
47
Median Age
28%
College-Educated
82%
High-School Grad
7.5 sq mi
ZIP Area
7,209
Density / Sq Mi
$84,086
Median Household Income
$41,657
Median Earnings
$1,796
Median Rent
$476,100
Median Home Value
Check the figures for this property
Cap Rate, Value Estimation, Potential NOI and more
View Realmo Analytics

Questions? Ask Rey
Realmo’s AI knows this listing — price, zoning, demand, history. Ask anything.



Frequently Asked Questions
What type of property is this?
Mixed-use property - Versatile 4-story building for retail, office, or medical use.
Where is this mixed-use property located?
The property is located at 8966 SW 40th St Miami, FL.
What is the asking price?
The asking price for this property is $14,800,000.
What are key features of this property?
This property features: New construction Class "A" building offering versatile space.; High‑traffic location on Bird Rd Corridor with 60k+ daily traffic count and multiple signage faces.; Ample parking with a 43‑space garage, expandable to 80 with valet service.



