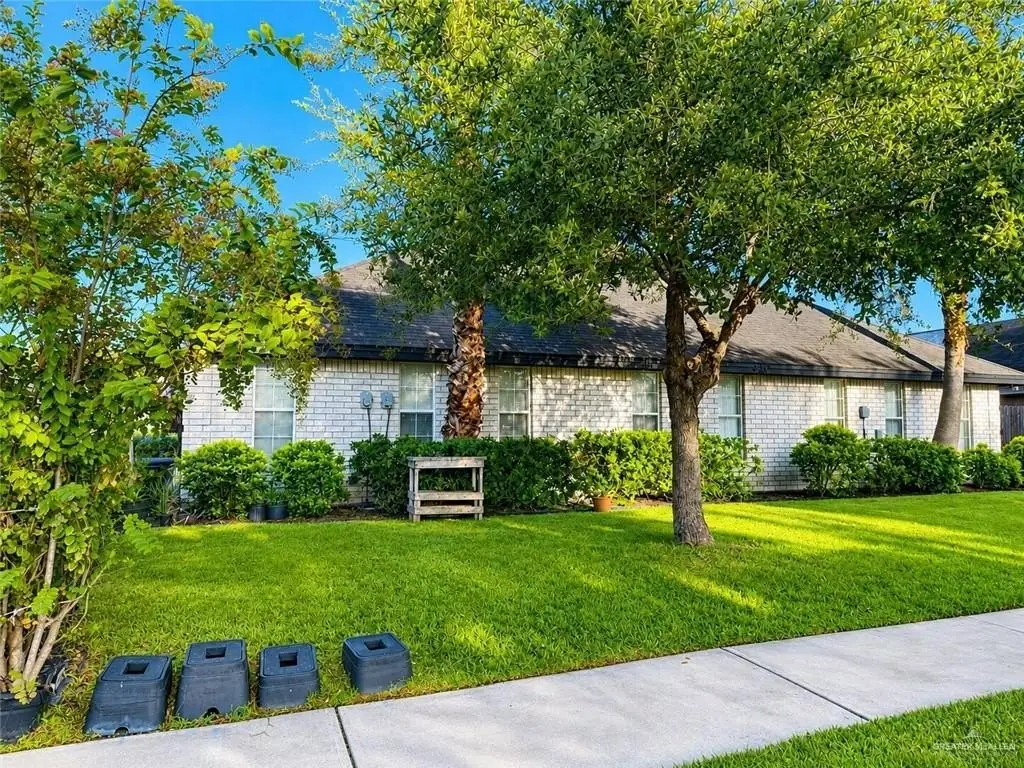
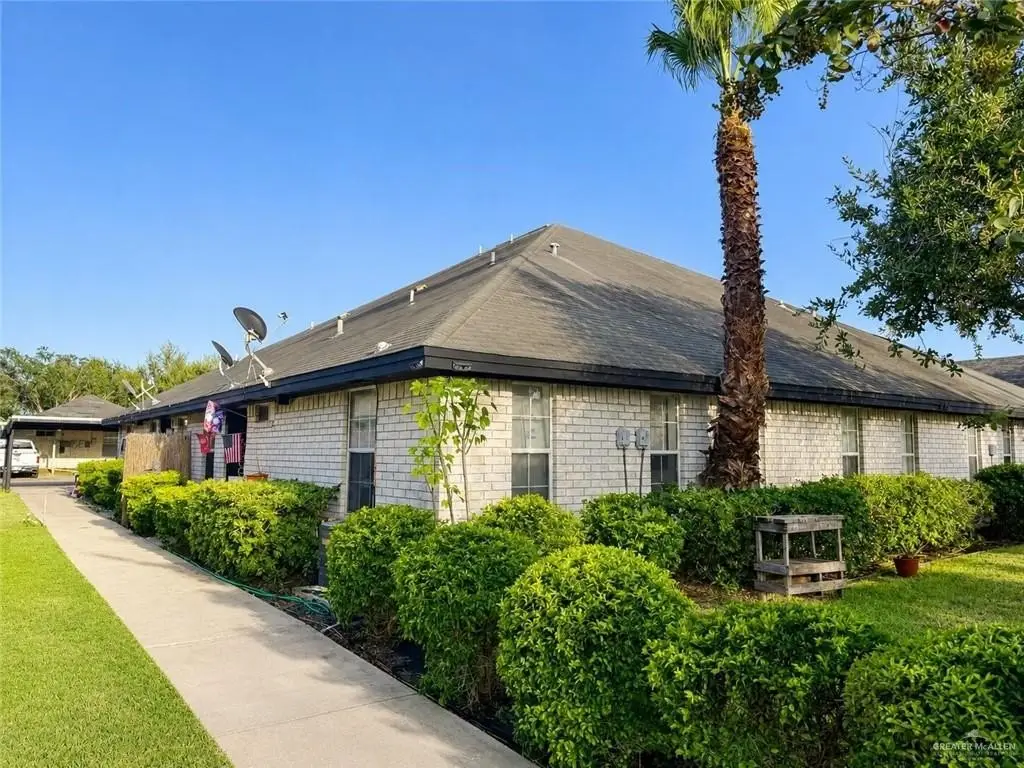
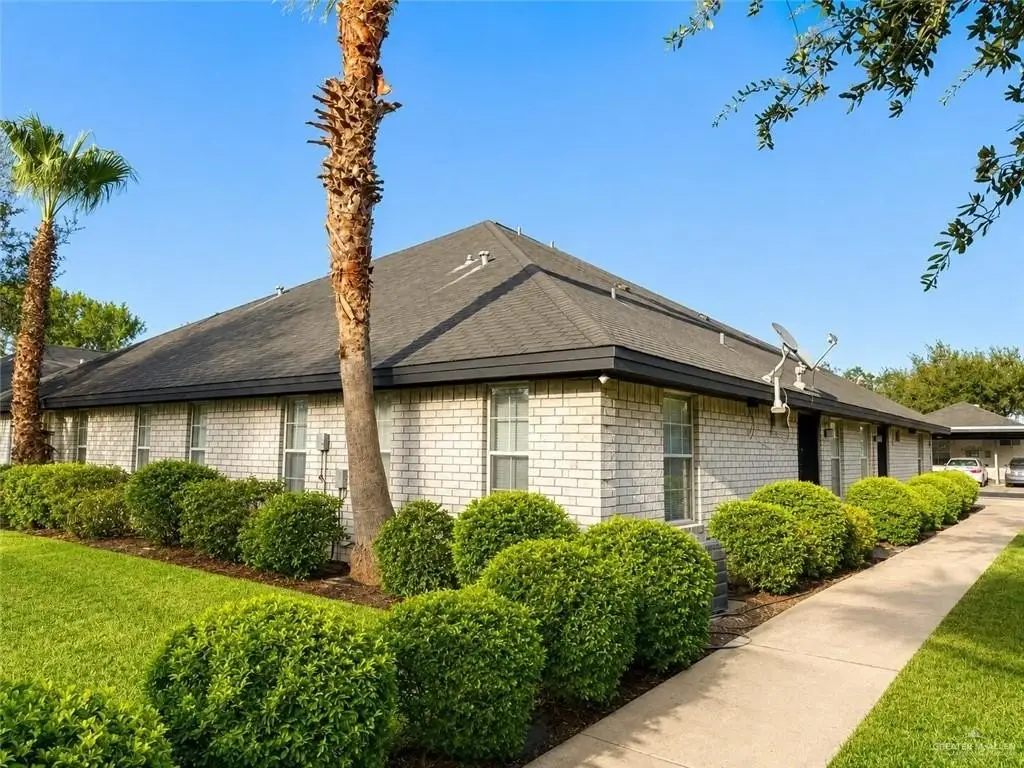
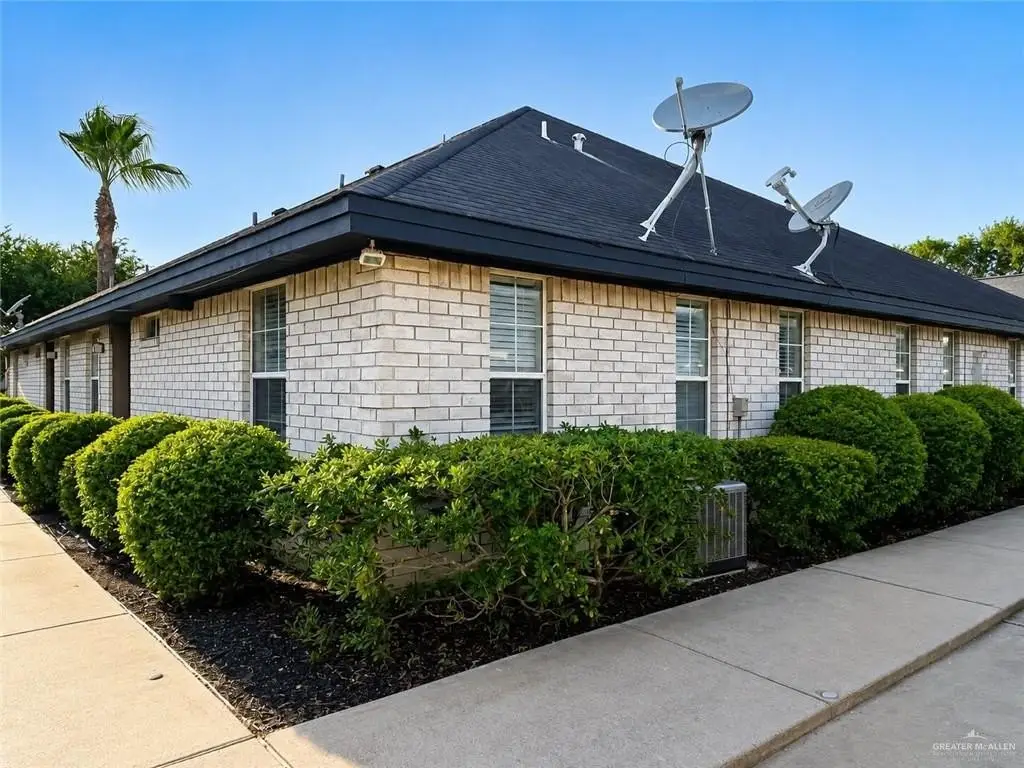
Four-Unit Brick
For Sale
$395,000
918 Stonehaven Boulevard, Edinburg, TX 78539
Residential Income, Edinburg, TX
Property Size3,478 SF
Lot Size0.22 Acres
Price / SF$113.57
Days on Market60
Property Features for 918 Stonehaven Boulevard
General Information
Property type
Residential Multi Family
Property subtype
Quadruplex
Parking
8
Parking features
Garage
Exterior features
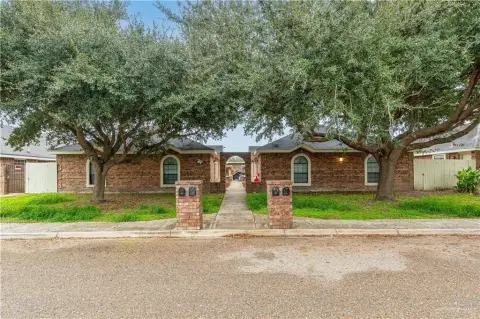
Mature Trees
Appliances
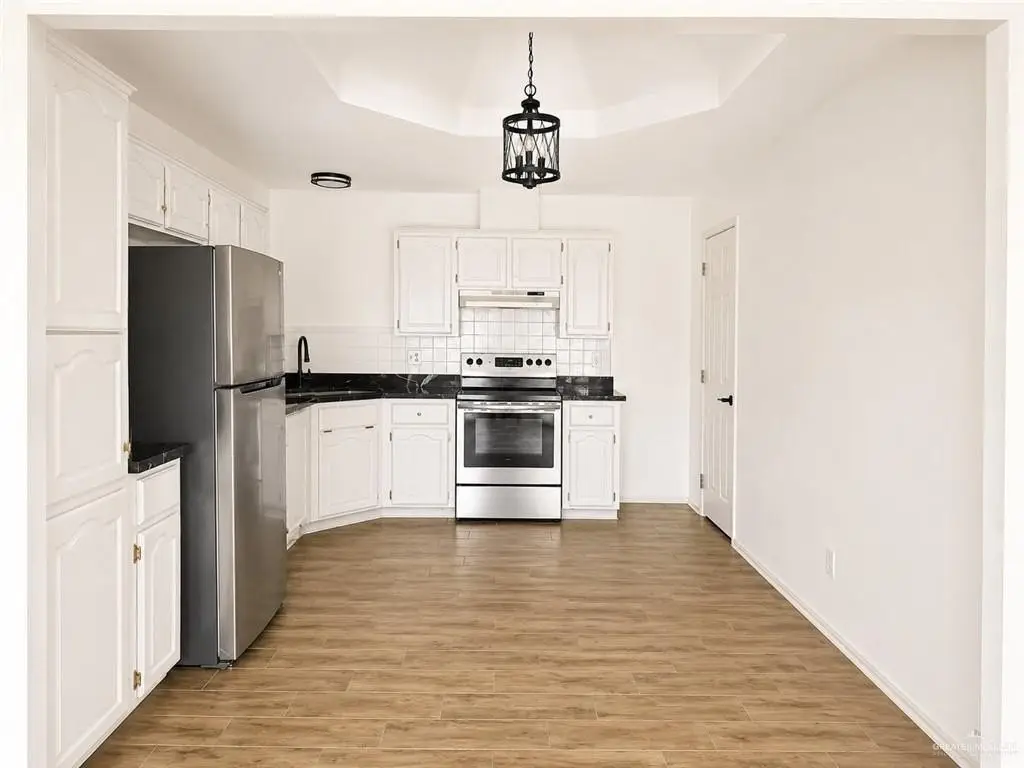
Electric Water Heater, Water Heater (Other Location), Microwave, Refrigerator, Stove/Range-Electric Smooth
Subdivision
Sugar Hill Estates
Lot features
Alley, Curb & Gutters, Mature Trees, Professional Landscaping, Sidewalks, Sprinkler System
Elementary school
Freddy Gonzalez
Middle school
South Middle School
High school
Vela H.S.
Elementary school district
Edinburg ISD
Middle school district
Edinburg ISD
High school district
Edinburg ISD
Directions
From the intersection of Sugar Rd and Trenton Rd, head north on Sugar Rd. Continue past Freddy Gonzalez Dr, then turn left into Sugar Hill Estates. Make an immediate left, followed by a right onto Stonehaven Blvd. The property will be on the right-hand side.
Standard status
Active
APN
S681000000002300
Size
3,478 SF
Lot size
0.22 Acres
Taxes and HOA fees
Tax Year
2025
Tax Annual Amount
7319
HOA Fee
$395 Annually
Utilities
Heating system
Electric (Heating), Central
Cooling system
Electric, Central Air
Water source
Public
Amenities
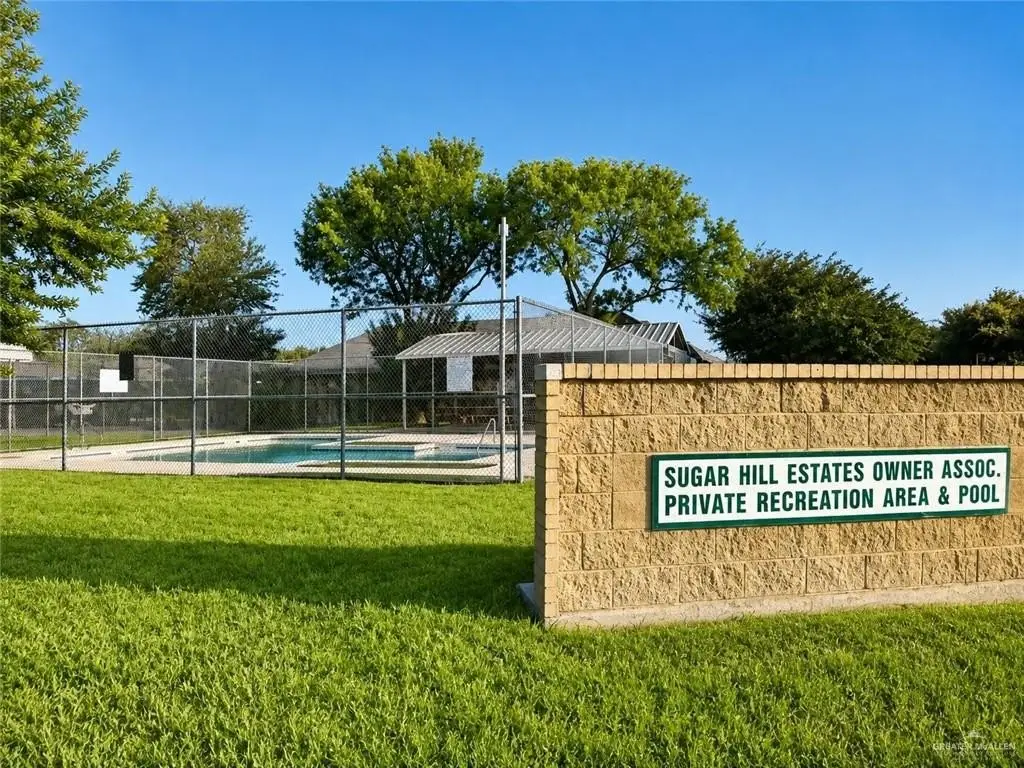
swimming pool
Building Details
Year built
1995
Floors in Building
1
Number of units
4
Building materials
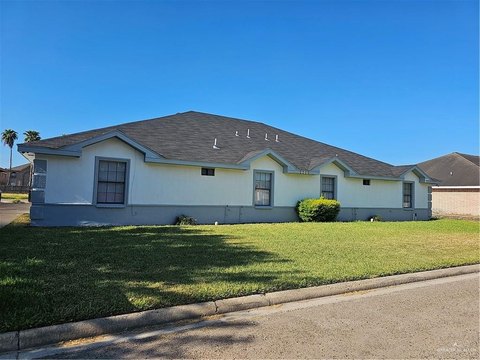
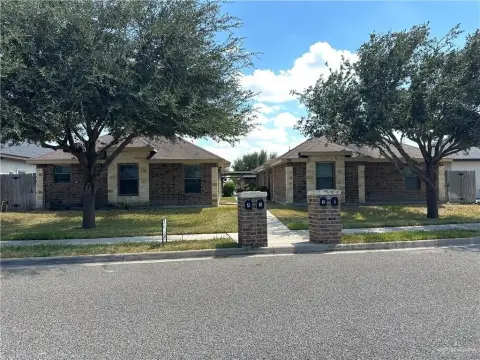
Brick
Roof type
Shingle
Listing Agency:
Tierra Frontera LLC
(956) 307-4544
Listed By:
Jessica Marroquin · License #801068402
(956) 536-2715
Added: Aug 19
Changed: Sep 14
Last Checked: Oct 17 at 10:06AM
MLS# 513013
Copyright © 2026 Greater McAllen Association of Realtors. All rights reserved. All information provided by the listing agent/broker is deemed reliable but is not guaranteed and should be independently verified.

Ask AI about this property
Review the available facts, identify missing information and prepare questions for the agent.
Investment Insights
Based on property information with market context.
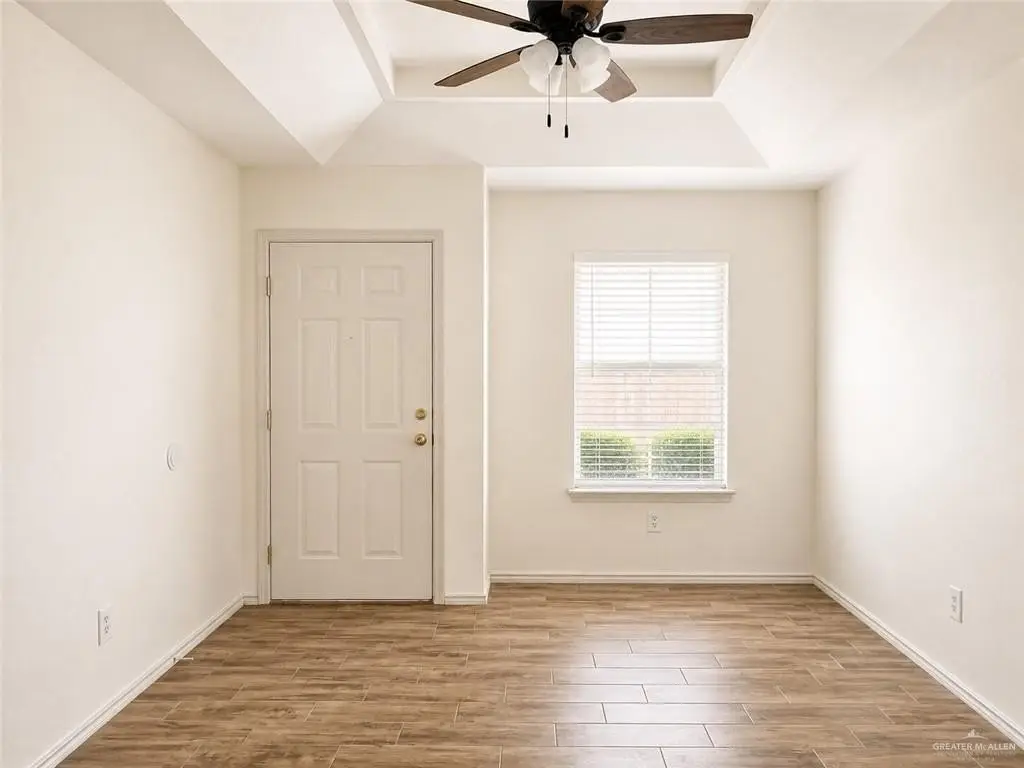
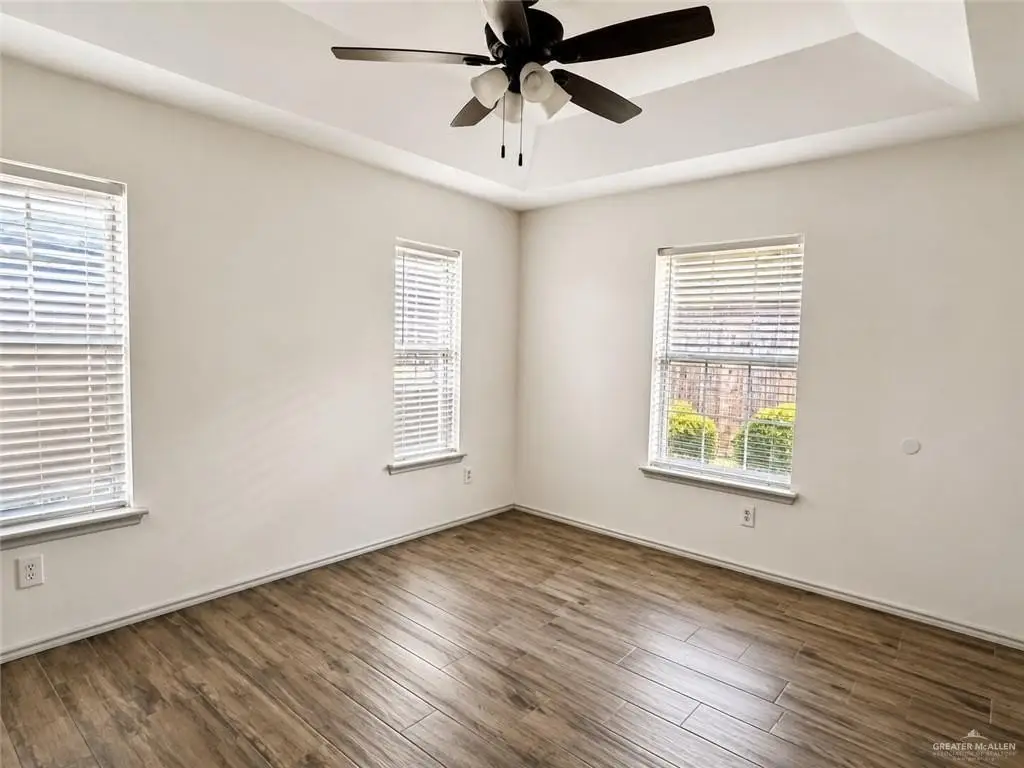
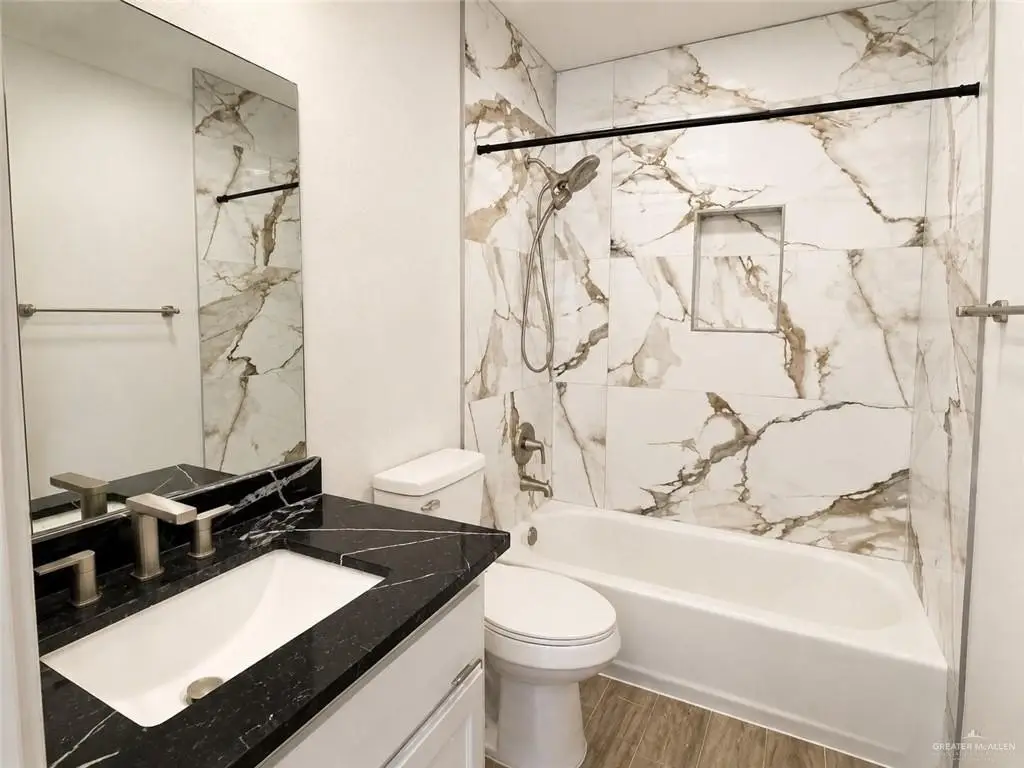
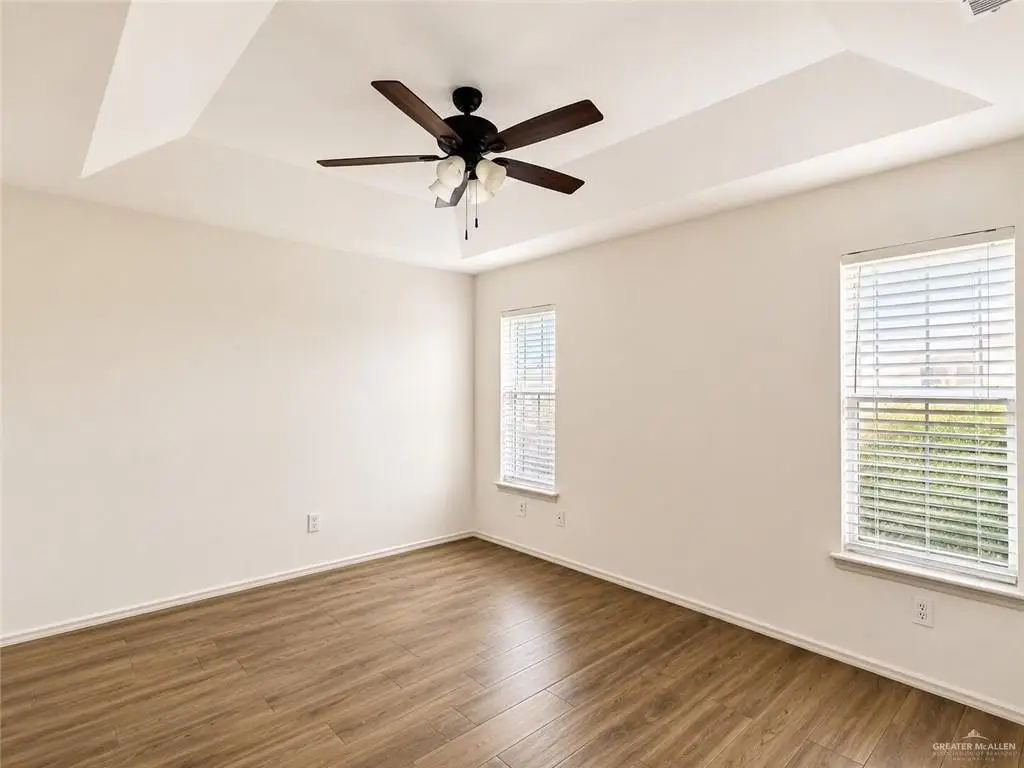
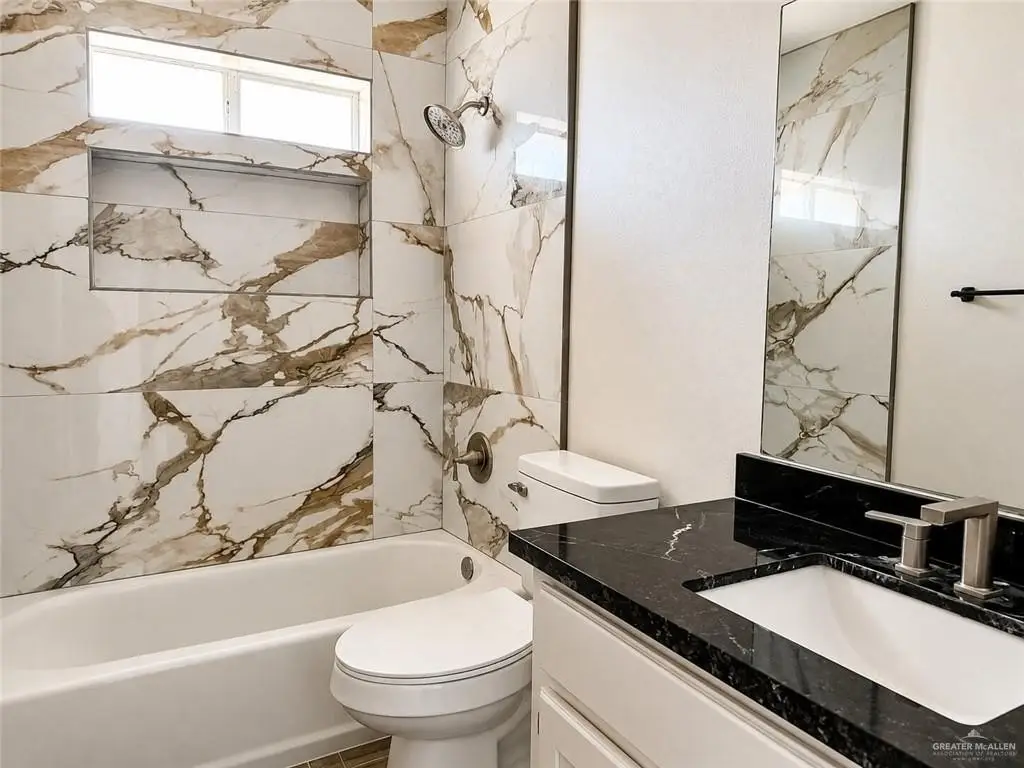
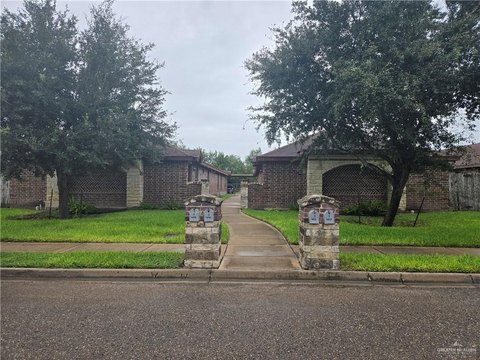
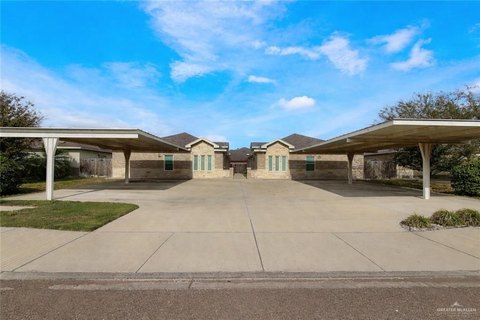
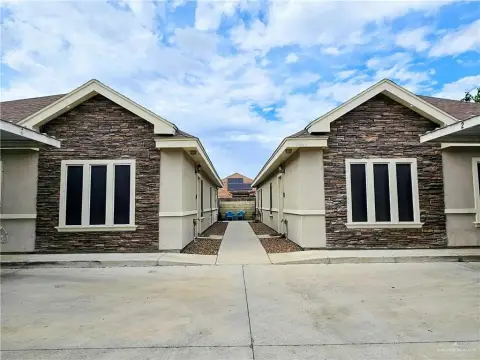
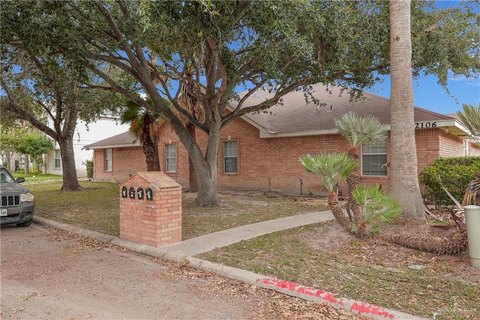
This 3,478-square-foot quadplex contains four residences, each arranged with two bedrooms, two bathrooms, an open living area, a kitchen, and dining space. The 1995 property is constructed with brick and includes eight covered parking spaces, garage parking, mature trees, and access to a swimming pool. Individual property features include central electric heating and air conditioning, electric water heating, shingle roofing, and public water service. Kitchens are equipped with electric smooth-top ranges, refrigerators, and microwaves.
The property is located at 918 Stonehaven Boulevard in Edinburg, within proximity to UTRGV, shopping, dining, community parks, baseball facilities, and other everyday amenities. Its four-unit configuration and consistent two-bedroom, two-bathroom layouts provide a clearly defined multifamily format.
The property is located at 918 Stonehaven Boulevard in Edinburg, within proximity to UTRGV, shopping, dining, community parks, baseball facilities, and other everyday amenities. Its four-unit configuration and consistent two-bedroom, two-bathroom layouts provide a clearly defined multifamily format.
Key Highlights
- Four‑unit quadplex with 3,478 square feet
- Each residence includes 2 bedrooms and 2 bathrooms
- Eight covered parking spaces plus garage parking
Financial Insights
Estimated NOI and Cap Rate
NOI / Yr
$32,674
Cap Rate
8.27%
Suggested Prices Based on Cap Rates
Cap Rate 5%
$653,480
$653.5K
Cap Rate 7%
$466,771
$466.8K
Cap Rate 9%
$363,044
$363.0K
Market Conditions
NOI Build-Up for 3,478 SF
Gross rent
$48.0K $13.80/SF
− Vacancy
−$1.3K −$0.38/SF
EGI
$46.7K $13.42/SF
− OpEx
−$14.0K −$4.03/SF
NOI
$32.7K $9.39/SF
Area
Edinburg, TX
Vacancy
2.75%
Lease Rate
$13.80 /SF/Yr
Expense Ratio
30.00%
Simulate Cap Rate and NOI
Suggested Prices Based on Cap Rates
Cap Rate 5%
$653,480
Cap Rate 7%
$466,771
Cap Rate 9%
$363,044
Alternative Uses
Best Use
Multifamily LT 5
$466.8K
$408.4K – $544.6K
NOI $32,674 @ 7.0% cap · market cap 8.27%
Second Best
Apartment 5plus
$417.1K
$365.0K – $486.7K
NOI $29,199 @ 7.0% cap · market cap 7.39%
Theoretical Best
Office A
$902.5K
$789.7K – $1.05M
NOI $63,172 @ 7.0% cap · market cap 15.99%
Zoning and permitted uses should be independently verified with authorities.
How Realmo checks its estimates
Property Analytics
Unlock full access to Insights
Subscribe to Realmo Intelligence
Open Analytics
Current Use
Location Intelligence
Trade Area within ½ mile
504
Businesses Nearby
Explore this area
Business Placement
Demographics for 78539, TX
37,686
Population
15,759
Households
2.4
Avg Household Size
34
Median Age
37%
College-Educated
84%
High-School Grad
12.2 sq mi
ZIP Area
3,089
Density / Sq Mi
$64,864
Median Household Income
$38,413
Median Earnings
$1,034
Median Rent
$198,300
Median Home Value
Check the figures for this property
Cap Rate, Value Estimation, Potential NOI and more
View Realmo Analytics
Market
Vacancy Rate% for Multifamily in South region





Frequently Asked Questions
What type of property is this?
Quadplex - Four two-bedroom residences with covered parking, pool access, and central electric heating and cooling.
Where is this quadplex located?
The property is located at 918 Stonehaven Boulevard Edinburg, TX.
What is the asking price?
The asking price for this property is $395,000.
What are key features of this property?
This property features: Four‑unit quadplex with 3,478 square feet; Each residence includes 2 bedrooms and 2 bathrooms; Eight covered parking spaces plus garage parking


