Waterfront Mixed-Use
For Sale
$5,250,000
916 Bay Street, Beaufort, SC 29902
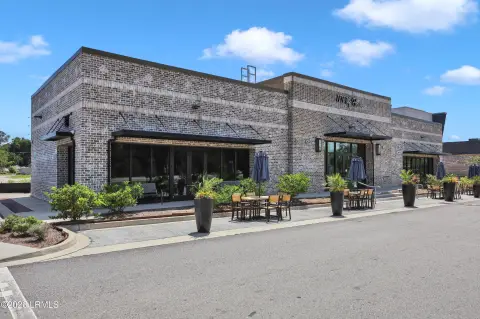
Four-story concrete property with commercial zoning, rooftop expansion capacity, elevator service, and covered gated parking.
Property Size20,000 SF
Price / SF$314.52
Days on Market176
Property Features for 916 Bay Street
General Information
Standard status
Active
Size
20,000 SF
Elevators
Yes
Property subtype
Commercial
Zoning
commercial
Additional Details
Road Access
Yes
Amenities
covered balconies
covered terraces
Building Details
Year Built
1978
Buildings
1
Stories
4
Building Size
20,000 SF
Construction
concrete
Tenancy
Multi
Listing Agency:
Lowcountry Real Estate
Listed By:
Edward Dukes · License #8810
(843) 521-4200
Source:
Tidelandrealty
Added: Apr 24
Changed: Oct 10
Last Checked: Oct 14 at 10:30PM
Displayed information is deemed reliable but is not guaranteed and should be independently verified. All listing content including descriptions, pricing, images are the copyrighted material of Lowcountry Real Estate

Ask AI about this property
Review the available facts, identify missing information and prepare questions for the agent.
Investment Insights
Based on property information with market context.
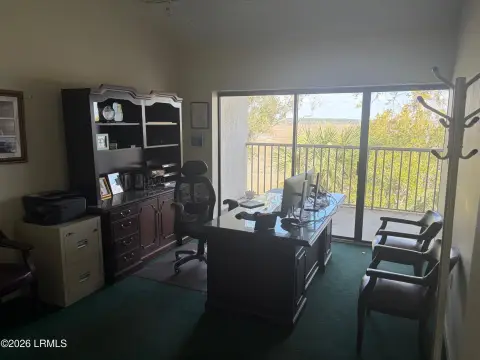
This four-floor mixed-use property contains nearly 20,000 square feet of improved space, with approximately 5,000 square feet on each level. The upper floor is configured as a luxury penthouse condominium, while three lower floors provide commercial space. Covered balconies, terraces, vaulted concrete ceilings, expansive glazing, and reinforced concrete construction define the building’s physical character. An elevator serves every floor, and the property includes covered parking with a security gate. The rooftop is suitable for additional development, while vertical and horizontal service chases support future mechanical, electrical, and plumbing modifications.
Positioned on Bay Street beside Waterfront Park, the property overlooks the Intracoastal Waterway and is located between Charleston and Savannah. The City Marina is 400 feet away. Commercial zoning and a short-term-rental permit are already in place. Potential concepts identified for the building include boutique lodging, restaurant, retail, office, residential, or combined uses.
Positioned on Bay Street beside Waterfront Park, the property overlooks the Intracoastal Waterway and is located between Charleston and Savannah. The City Marina is 400 feet away. Commercial zoning and a short-term-rental permit are already in place. Potential concepts identified for the building include boutique lodging, restaurant, retail, office, residential, or combined uses.
Key Highlights
- Nearly 20,000 square feet of improved space across four floors
- Approximately 5,000 square feet per floor, including terraces and balconies
- Top floor developed as a luxury penthouse condominium
Financial Insights
Estimated NOI and Cap Rate
NOI / Yr
$263,600
Cap Rate
5.02%
Suggested Prices Based on Cap Rates
Cap Rate 5%
$5,272,000
$5.3M
Cap Rate 7%
$3,765,714
$3.8M
Cap Rate 9%
$2,928,889
$2.9M
Market Conditions
NOI Build-Up for 16,692 SF
Gross rent
$400.6K $24.00/SF
− Vacancy
−$24.0K −$1.44/SF
EGI
$376.6K $22.56/SF
− OpEx
−$113.0K −$6.77/SF
NOI
$263.6K $15.79/SF
Area
Beaufort County, SC
Vacancy
6.00%
Lease Rate
$24.00 /SF/Yr
Expense Ratio
30.00%
Simulate Cap Rate and NOI
Suggested Prices Based on Cap Rates
Cap Rate 5%
$5,272,000
Cap Rate 7%
$3,765,714
Cap Rate 9%
$2,928,889
Alternative Uses
Best Use
Retail
$3.77M
$3.30M – $4.39M
NOI $263,600 @ 7.0% cap · market cap 5.02%
Second Best
Office B
$3.28M
$2.87M – $3.83M
NOI $229,849 @ 7.0% cap · market cap 4.38%
Theoretical Best
Office A
$5.04M
$4.41M – $5.88M
NOI $352,535 @ 7.0% cap · market cap 6.71%
Zoning and permitted uses should be independently verified with authorities.
How Realmo checks its estimates
Property Analytics
Unlock full access to Insights
Subscribe to Realmo Intelligence
Open Analytics
Current Use
Lease Details
Multi-tenant
Tenancy
Yes
Paved road access
Location Intelligence
Trade Area within ½ mile
919
Businesses Nearby
Explore this area
Business Placement
Demographics for 29902, SC
16,692
Population
7,131
Households
2.3
Avg Household Size
36
Median Age
38%
College-Educated
96%
High-School Grad
18.1 sq mi
ZIP Area
922
Density / Sq Mi
$72,564
Median Household Income
$36,468
Median Earnings
$1,157
Median Rent
$306,000
Median Home Value
Check the figures for this property
Cap Rate, Value Estimation, Potential NOI and more
View Realmo Analytics
Market
Vacancy Rate% for Office in South region






Frequently Asked Questions
What type of property is this?
Mixed-use property - Four-story concrete property with commercial zoning, rooftop expansion capacity, elevator service, and covered gated parking.
Where is this mixed-use property located?
The property is located at 916 Bay Street Beaufort, SC.
What is the asking price?
The asking price for this property is $5,250,000.
What are key features of this property?
This property features: Nearly 20,000 square feet of improved space across four floors; Approximately 5,000 square feet per floor, including terraces and balconies; Top floor developed as a luxury penthouse condominium


