Newer Duplex with Two-Car
For Sale
$624,950
916 2nd St, Cheney, WA 99004
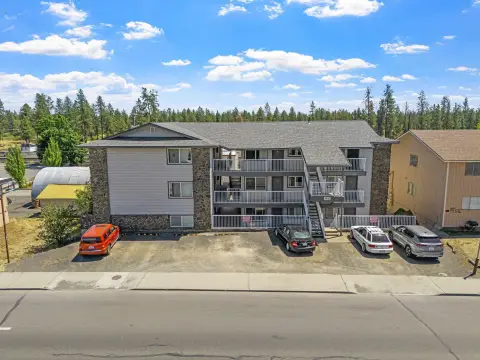
Each residence offers three bedrooms, two-and-a-half baths, and low-maintenance landscaping.
Property Size3,065 SF
Price / SF$203.90
Days on Market59
Property Features for 916 2nd St
General Information
Standard status
Active
Size
3,065 SF
Total Parking Spaces
4
Property subtype
Multi-Family
Occupancy
100%
Units
Unit Mix
2 x 3BR/2.5BA
Multifamily Units
2
Building Details
Year Built
2024
Buildings
1
Tenancy
Multi
Listing Agency:
Keller Williams Realty Coeur d
Listed By:
Seth Maefsky · License #25177
(509) 922-7355
Source:
Clemensregroup
Added: Aug 17
Changed: Oct 11
Last Checked: Oct 7 at 3:13PM
Displayed information is deemed reliable but is not guaranteed and should be independently verified. All listing content including descriptions, pricing, images are the copyrighted material of Keller Williams Realty Coeur d
Investment Insights
Based on property information with market context.
Built in 2024, this duplex contains two separately leased residences, each offering 1,536 square feet with three bedrooms and two-and-a-half bathrooms. Interior finishes include quartz surfaces, custom cabinetry with soft-close drawers, and stainless steel kitchen appliances. Primary suites feature private bathrooms, walk-in closets, and dual-sink vanities. Each side also includes a two-car garage.
The property is located in Cheney near Eastern Washington University, with shopping and restaurants a few blocks away. Both residences are occupied under long-term leases, providing an established rental setup for an investor or an owner-occupant seeking a home with an additional leased unit.
The property is located in Cheney near Eastern Washington University, with shopping and restaurants a few blocks away. Both residences are occupied under long-term leases, providing an established rental setup for an investor or an owner-occupant seeking a home with an additional leased unit.
Key Highlights
- 2024‑built duplex with two 1,536‑square‑foot residences
- Each unit includes 3 bedrooms, 2.5 baths, and a 2‑car garage
- Both sides are rented under long‑term leases
Financial Insights
Estimated NOI and Cap Rate
NOI / Yr
$34,019
Cap Rate
5.44%
Suggested Prices Based on Cap Rates
Cap Rate 5%
$680,380
$680.4K
Cap Rate 7%
$485,986
$486.0K
Cap Rate 9%
$377,989
$378.0K
Market Conditions
NOI Build-Up for 3,065 SF
Gross rent
$52.6K $17.16/SF
− Vacancy
−$4.0K −$1.30/SF
EGI
$48.6K $15.86/SF
− OpEx
−$14.6K −$4.76/SF
NOI
$34.0K $11.10/SF
Area
Spokane County, WA
Vacancy
7.60%
Lease Rate
$17.16 /SF/Yr
Expense Ratio
30.00%
Simulate Cap Rate and NOI
Suggested Prices Based on Cap Rates
Cap Rate 5%
$680,380
Cap Rate 7%
$485,986
Cap Rate 9%
$377,989
Alternative Uses
Best Use
Multifamily LT 5
$486.0K
$425.2K – $567.0K
NOI $34,019 @ 7.0% cap · market cap 5.44%
Second Best
Apartment 5plus
$446.7K
$390.8K – $521.1K
NOI $31,266 @ 7.0% cap · market cap 5.00%
Theoretical Best
Office A
$708.2K
$619.7K – $826.3K
NOI $49,576 @ 7.0% cap · market cap 7.93%
Zoning and permitted uses should be independently verified with authorities.
How Realmo checks its estimates
Property Analytics
Current Use
Lease Details
2
Residential units
100%
Occupancy
Multi-tenant
Tenancy
Location Intelligence
Trade Area within ½ mile
504
Businesses Nearby
Explore this area
Business Placement
Demographics for 99004, WA
23,064
Population
8,992
Households
2.6
Avg Household Size
29
Median Age
36%
College-Educated
93%
High-School Grad
334.3 sq mi
ZIP Area
69
Density / Sq Mi
$62,014
Median Household Income
$29,835
Median Earnings
$1,081
Median Rent
$368,500
Median Home Value
Market
Vacancy Rate% for Multifamily in West region

Questions? Ask Rey
Realmo’s AI knows this listing — price, zoning, demand, history. Ask anything.






Frequently Asked Questions
What type of property is this?
Duplex - Each residence offers three bedrooms, two-and-a-half baths, and low-maintenance landscaping.
Where is this duplex located?
The property is located at 916 2nd St Cheney, WA.
What is the asking price?
The asking price for this property is $624,950.
What are key features of this property?
This property features: 2024‑built duplex with two 1,536‑square‑foot residences; Each unit includes 3 bedrooms, 2.5 baths, and a 2‑car garage; Both sides are rented under long‑term leases


