Two-Level Mixed-Use
For Sale
$425,000
915 E Mineral, Platteville, WI 53818
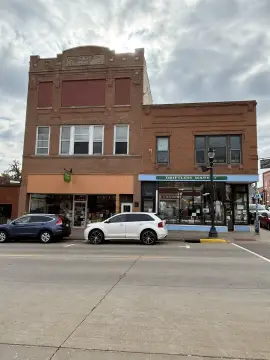
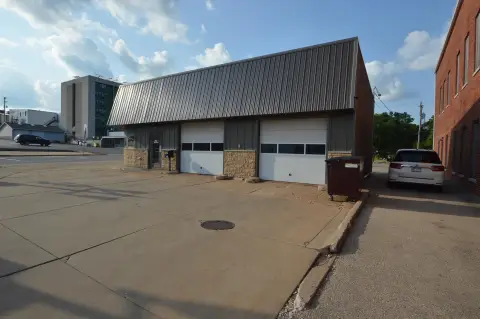
The property includes a leased lower level and an adaptable main level.
Property Size4,157 SF
Price / SF$102.24
Days on Market141
Property Features for 915 E Mineral
General Information
Standard status
Active
Size
4,157 SF
Property subtype
Commercial
Building Details
Year Built
2000
Listing Agency:
Equity Real Estate Group, LLC
Listed By:
Troy Timmerman · License #8537094
(608) 778-8224
Source:
Madisonareahomesforsale
Added: Jun 8
Changed: Oct 26
Last Checked: Oct 24 at 5:32PM
Displayed information is deemed reliable but is not guaranteed and should be independently verified. All listing content including descriptions, pricing, images are the copyrighted material of Equity Real Estate Group, LLC

Ask AI about this property
Review the available facts, identify missing information and prepare questions for the agent.
Investment Insights
Based on property information with market context.
Built in 2000, this mixed-use commercial property is arranged across a main level and a lower level. The building previously served as a medical facility and offers a layout suited to office, retail, and professional-service uses. The lower level is currently leased on a month-to-month basis, creating an existing rental arrangement while the main level remains available for use or occupancy.
Located at 915 E Mineral Street in Platteville, Wisconsin, the property carries G2 Commercial zoning. Its two-level configuration provides separate areas for continued leasing, business operations, or a combination of both, subject to applicable zoning and occupancy requirements.
Located at 915 E Mineral Street in Platteville, Wisconsin, the property carries G2 Commercial zoning. Its two-level configuration provides separate areas for continued leasing, business operations, or a combination of both, subject to applicable zoning and occupancy requirements.
Key Highlights
- Main‑level and lower‑level configuration
- Lower level currently leased month‑to‑month
- Former medical facility layout
Financial Insights
Estimated NOI and Cap Rate
NOI / Yr
$28,683
Cap Rate
6.75%
Suggested Prices Based on Cap Rates
Cap Rate 5%
$573,660
$573.7K
Cap Rate 7%
$409,757
$409.8K
Cap Rate 9%
$318,700
$318.7K
Market Conditions
NOI Build-Up for 4,157 SF
Gross rent
$49.9K $12.00/SF
− Vacancy
−$4.0K −$0.96/SF
EGI
$45.9K $11.04/SF
− OpEx
−$17.2K −$4.14/SF
NOI
$28.7K $6.90/SF
Area
Grant County, WI
Vacancy
8.00%
Lease Rate
$12.00 /SF/Yr
Expense Ratio
37.50%
Simulate Cap Rate and NOI
Suggested Prices Based on Cap Rates
Cap Rate 5%
$573,660
Cap Rate 7%
$409,757
Cap Rate 9%
$318,700
Alternative Uses
Best Use
Office B
$823.9K
$721.0K – $961.3K
NOI $57,676 @ 7.0% cap · market cap 13.57%
Second Best
Retail
$767.7K
$671.7K – $895.6K
NOI $53,737 @ 7.0% cap · market cap 12.64%
Theoretical Best
Office A
$1.15M
$1.01M – $1.34M
NOI $80,559 @ 7.0% cap · market cap 18.96%
Zoning and permitted uses should be independently verified with authorities.
How Realmo checks its estimates
Property Analytics
Contact the owner directly
Get the owner's phone numbers and email
Open Analytics
Current Use
Location Intelligence
Trade Area within ½ mile
485
Businesses Nearby
Explore this area
Business Placement
Demographics for 53818, WI
15,786
Population
6,146
Households
2.6
Avg Household Size
28
Median Age
39%
College-Educated
93%
High-School Grad
154.4 sq mi
ZIP Area
102
Density / Sq Mi
$55,615
Median Household Income
$20,296
Median Earnings
$887
Median Rent
$214,200
Median Home Value
Check the figures for this property
Cap Rate, Value Estimation, Potential NOI and more
View Realmo Analytics
Market
Vacancy Rate% for Office in Midwest region





Frequently Asked Questions
What type of property is this?
Mixed-use property - The property includes a leased lower level and an adaptable main level.
Where is this mixed-use property located?
The property is located at 915 E Mineral Platteville, WI.
What is the asking price?
The asking price for this property is $425,000.
What are key features of this property?
This property features: Main‑level and lower‑level configuration; Lower level currently leased month‑to‑month; Former medical facility layout


