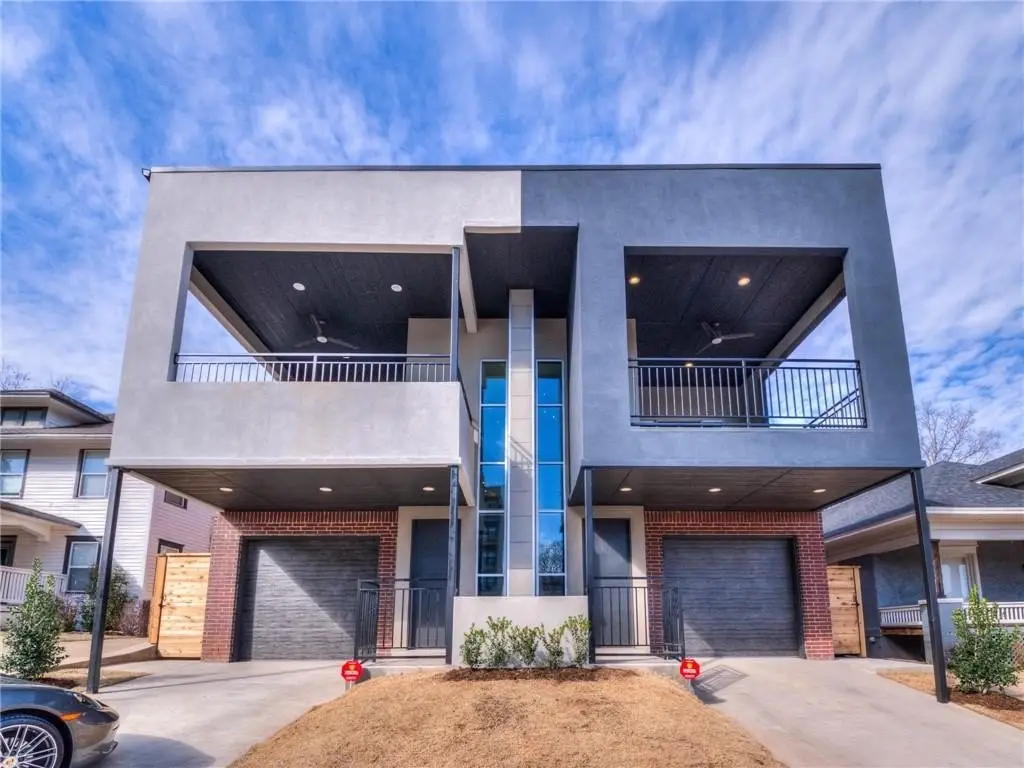
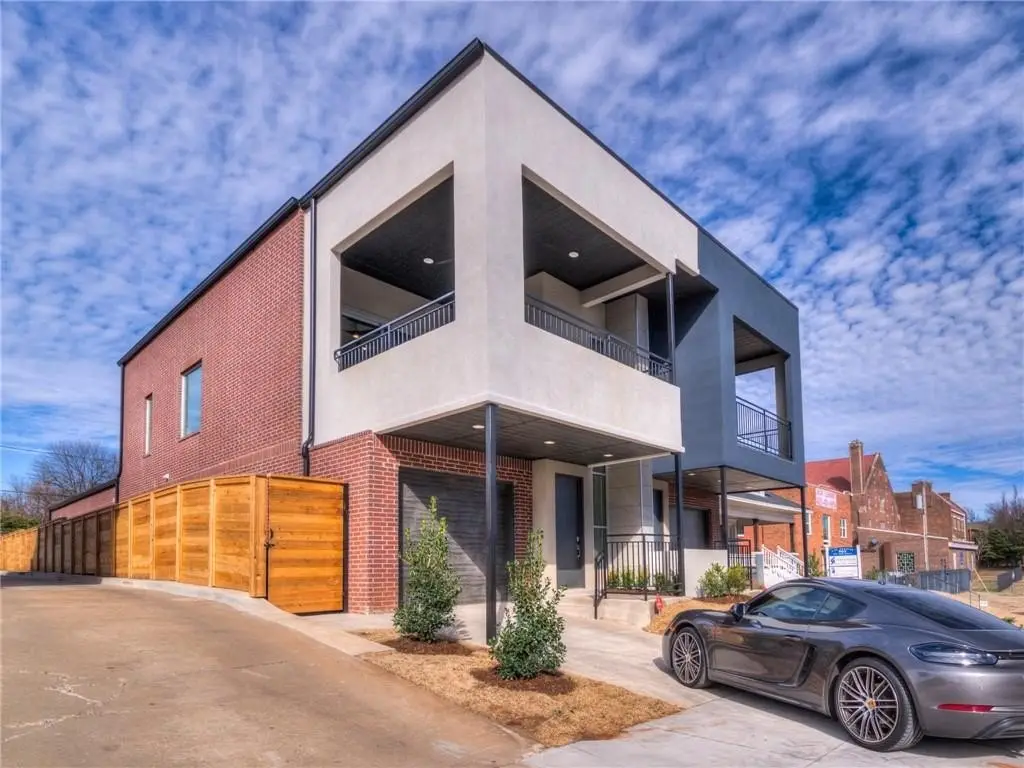
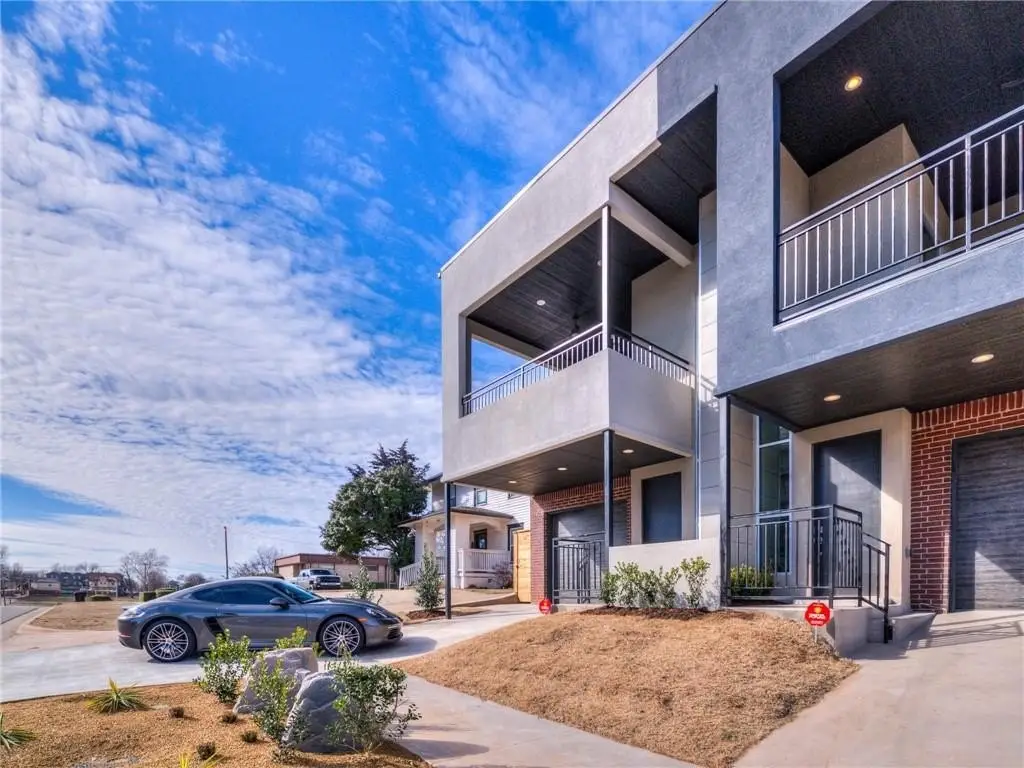
Modern Duplex with Tandem
For Sale
$1,100,000
911 NW 13 Street, Oklahoma City, OK 73106
Residential Income, Oklahoma City, OK
Property Size4,418 SF
Price / SF$248.98
Days on Market204
Property Features for 911 NW 13 Street
General Information
Property type
Residential Multi Family
Property subtype
Duplex
Bedrooms
4
Bathrooms
6
Full bathrooms
4
Half bathrooms
2
Rooms
Bedroom 4, Bathroom 4, Bathroom 1, Bedroom 1, Bedroom 2, Bedroom 3, Bathroom 5, Bathroom 6, Bathroom 2, Bathroom 3
Parking
2
Appliances
Dishwasher, Disposal, Microwave
Lot features
Interior Lot
Elementary school
Wilson ES
Middle school
Classen MS Of Advanced Studies,Moon MS
High school
Douglass HS
Elementary school district
Oklahoma City
Middle school district
Oklahoma City
High school district
Oklahoma City
Directions
From Classen & NW 13 go east to property on the north side of the road.
Standard status
Active
APN
911NW13A&B73106
Size
4,418 SF
Utilities
Heating system
Natural Gas
Cooling system
Electric
Amenities
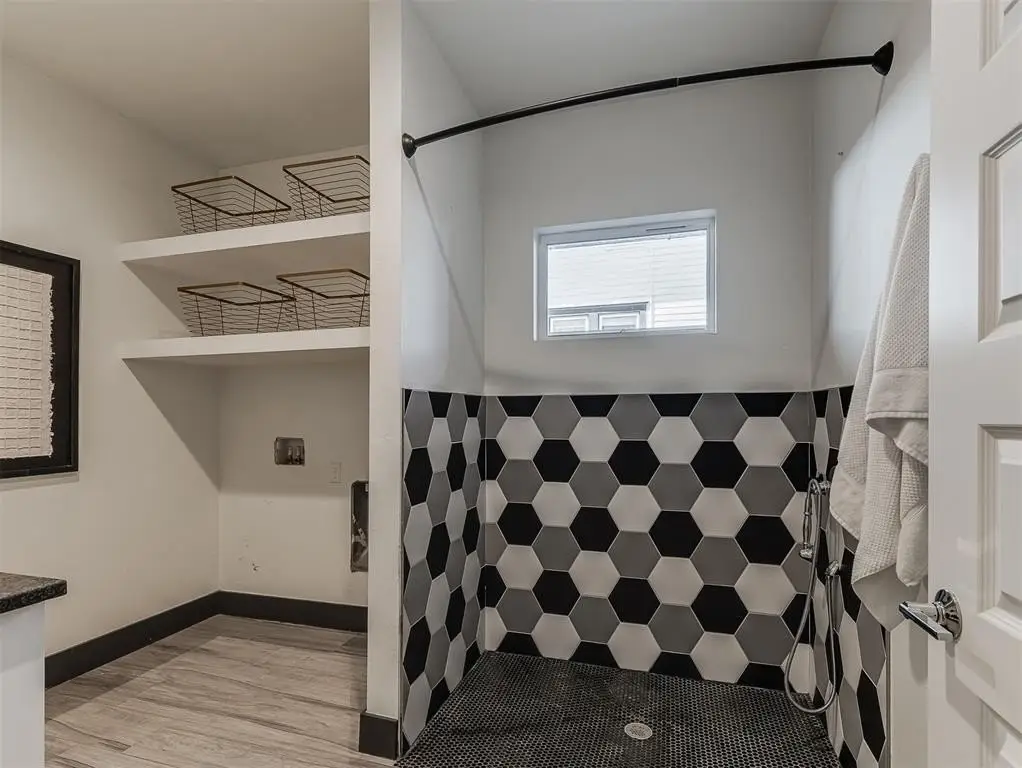
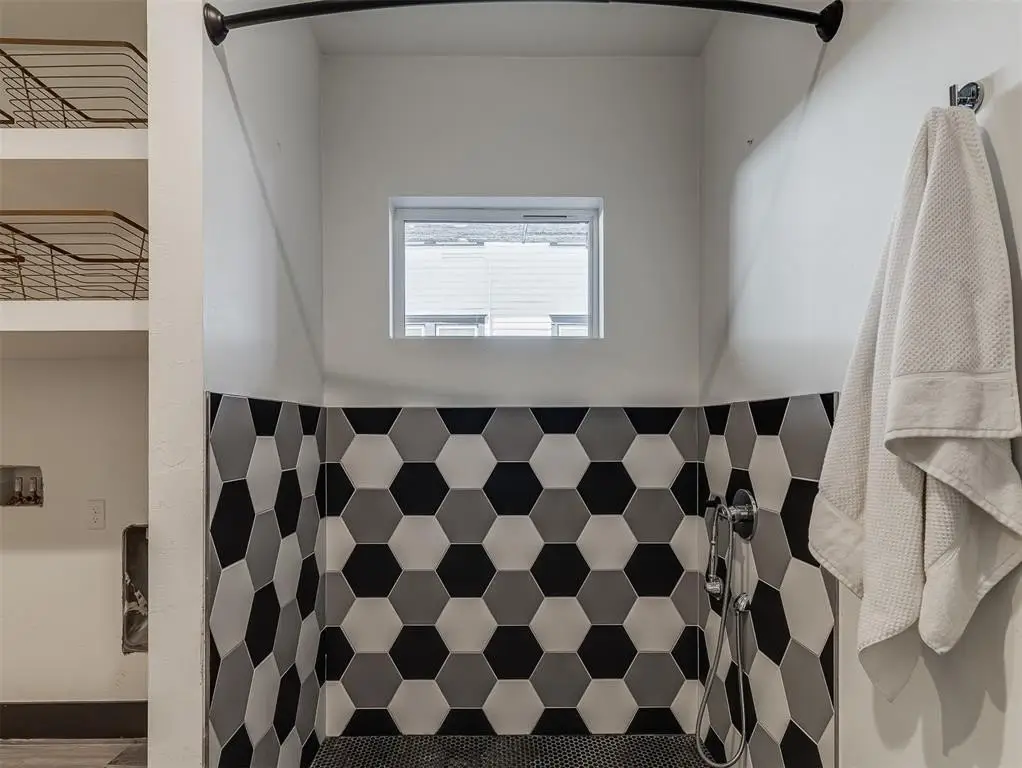
dog wash station
Building Details
Year built
2020
Floors in Building
2
Building materials
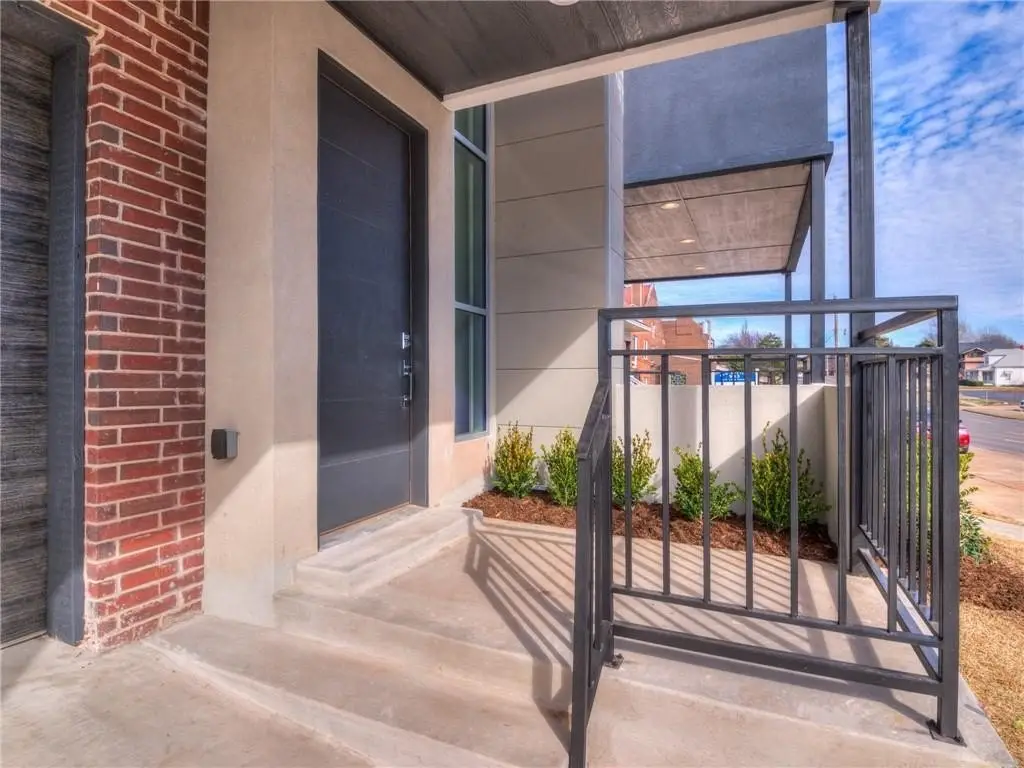
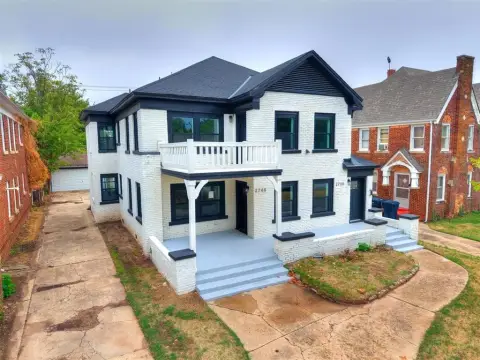
Brick, Stucco
Architectural style
Modern, Contemporary
Listing Agency:
Metro First Realty
(405) 242-4004
Listed By:
Santana Dennis · License #157100
(405) 410-2281
Added: Mar 24
Changed: Sep 17
Last Checked: Oct 13 at 4:06PM
MLS# 1220594
Copyright © 2026 MLSOK, Inc. All rights reserved. All information provided by the listing agent/broker is deemed reliable but is not guaranteed and should be independently verified.
Investment Insights
Based on property information with market context.
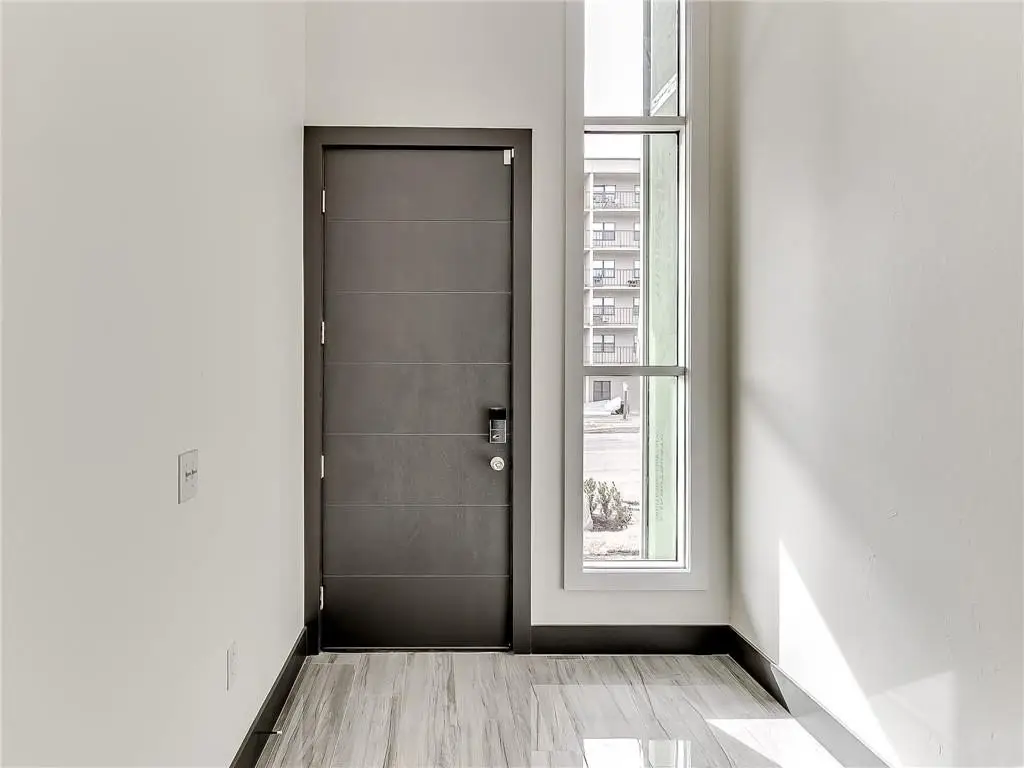
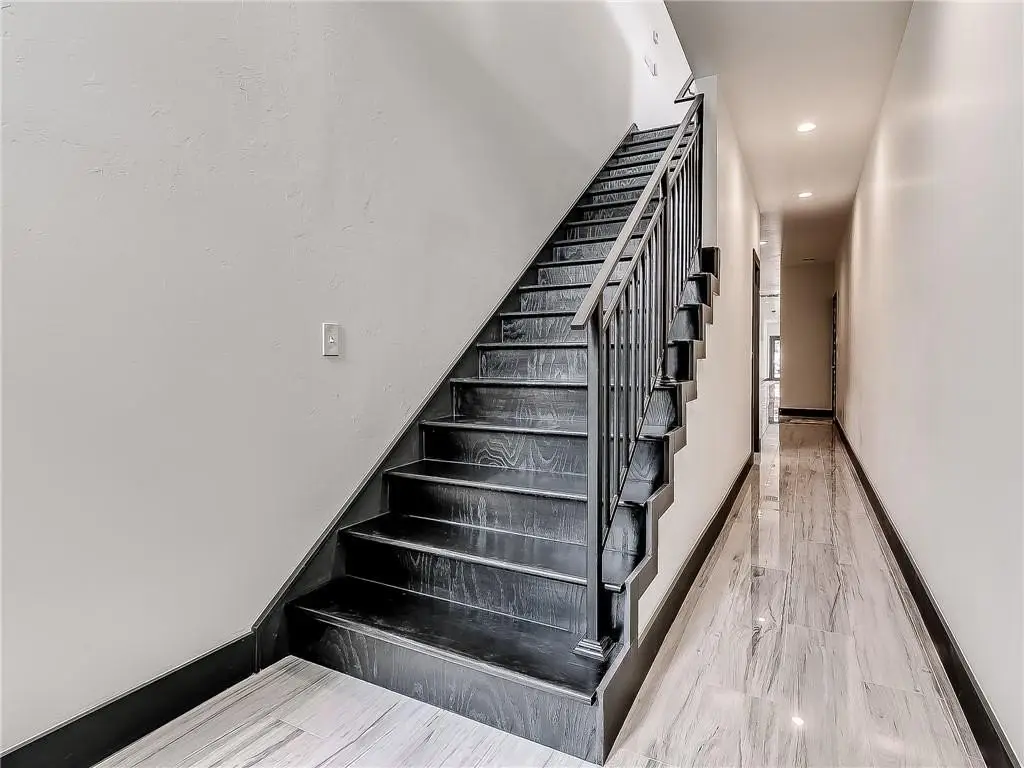
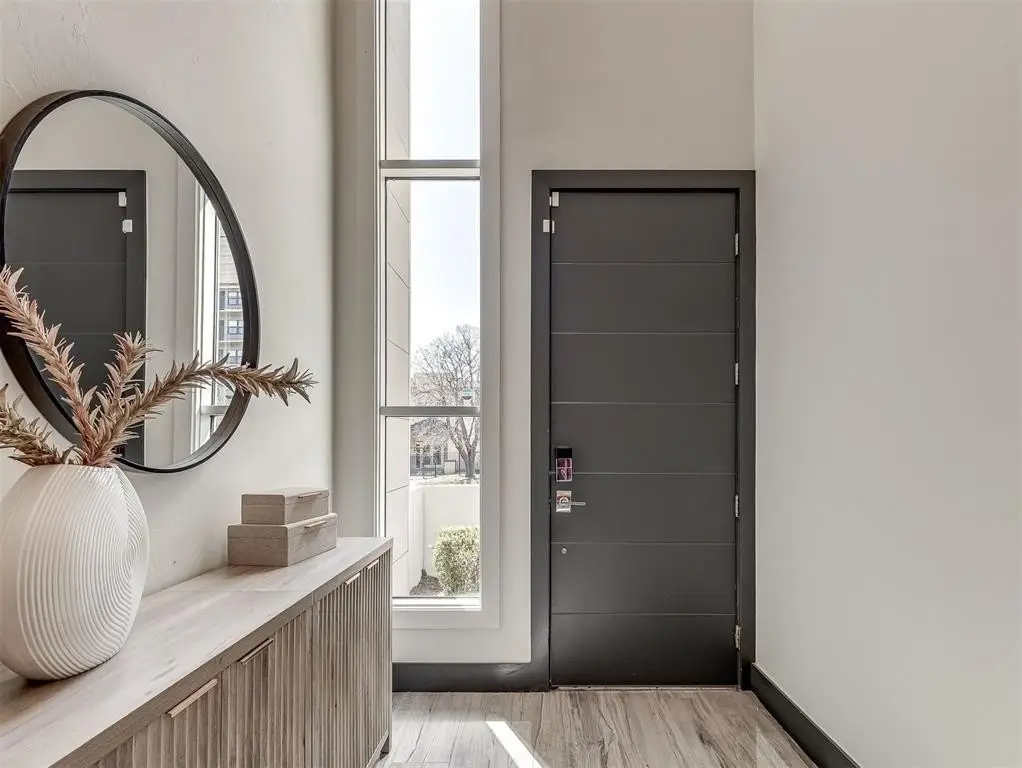
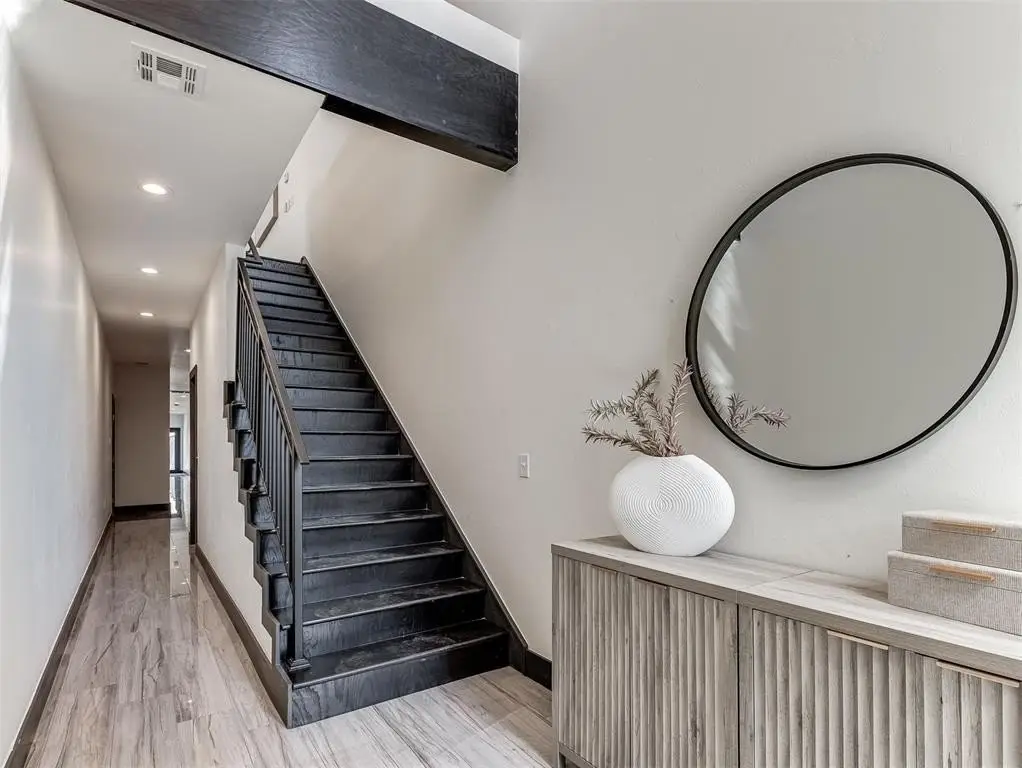
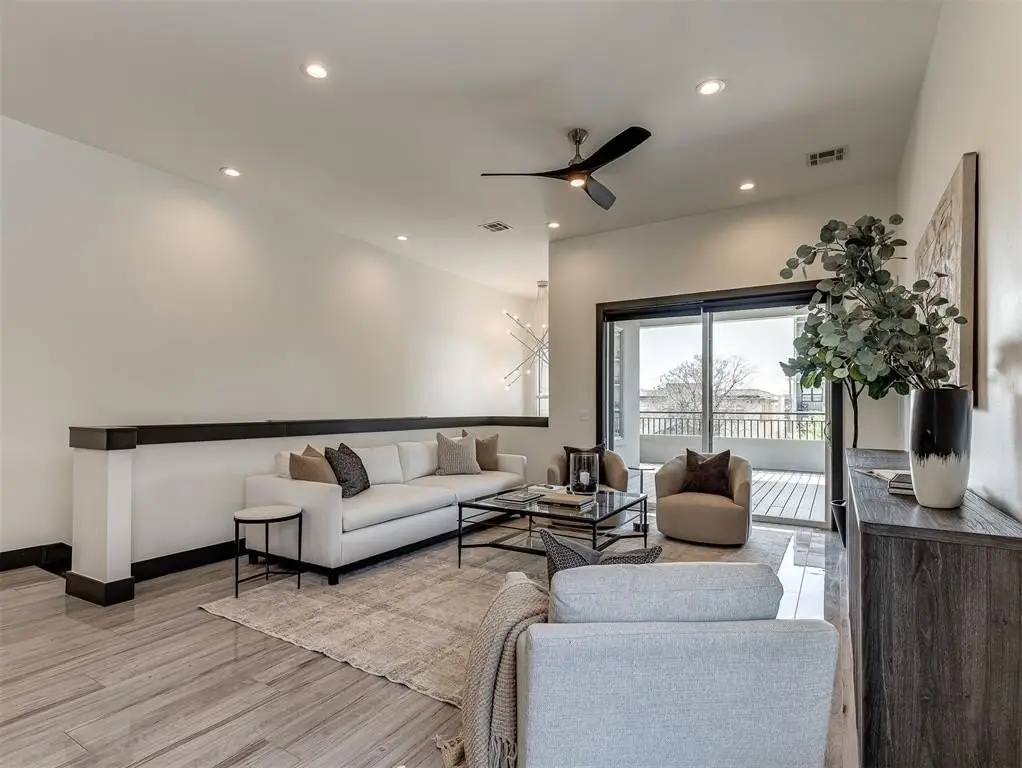
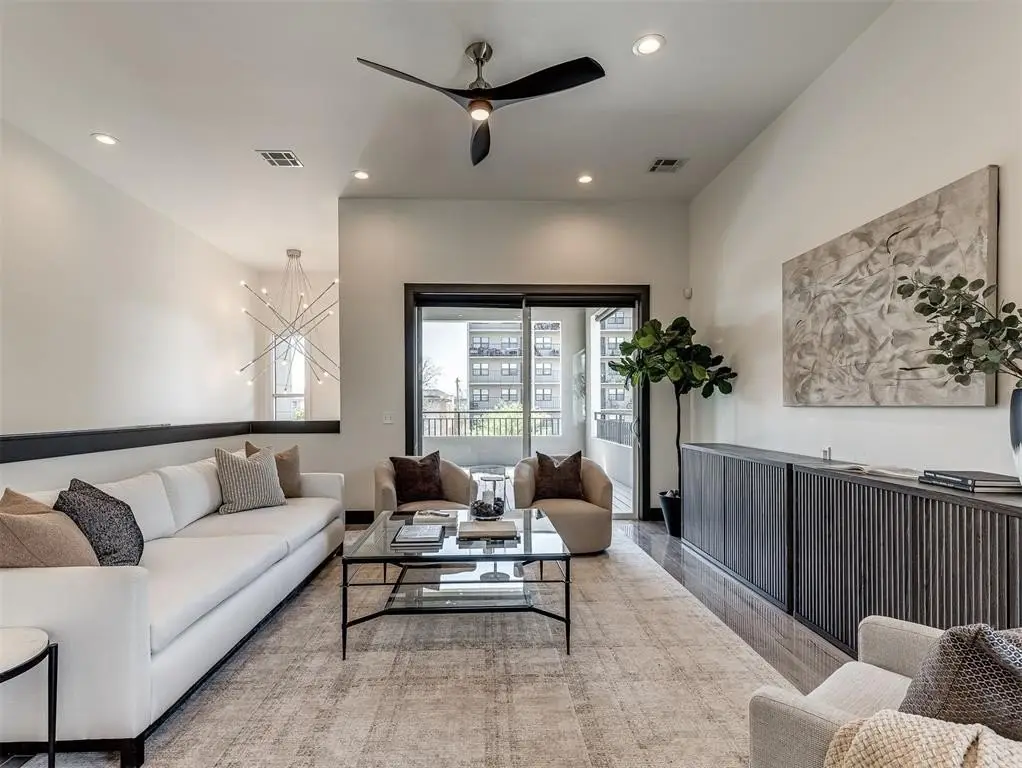
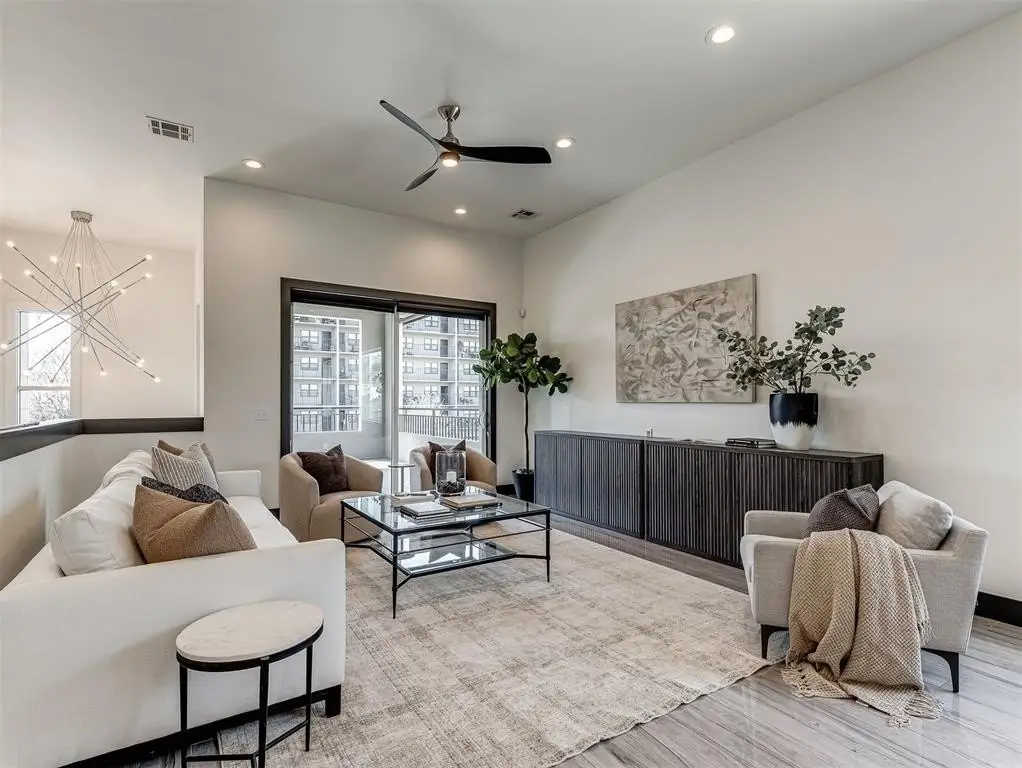
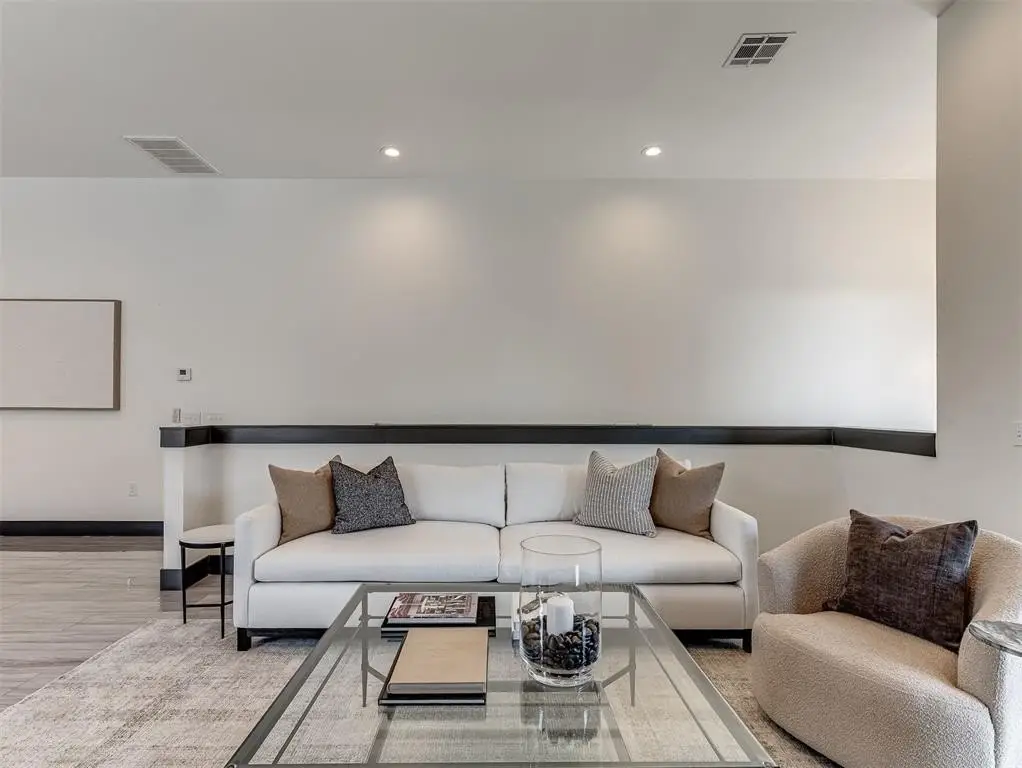
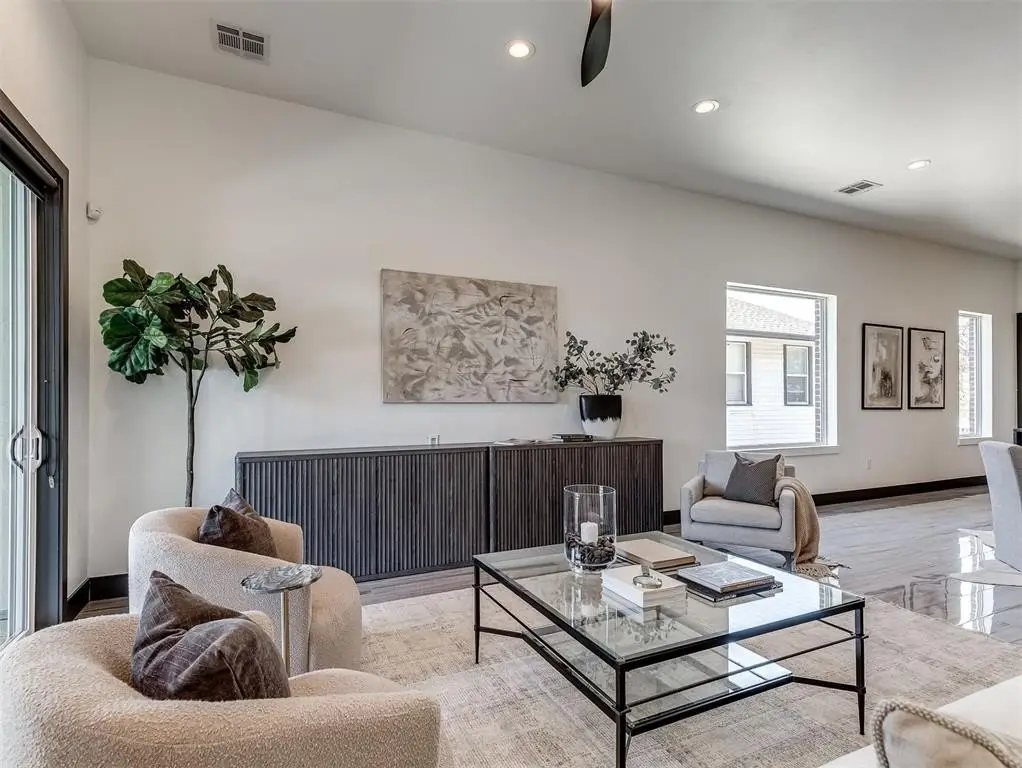
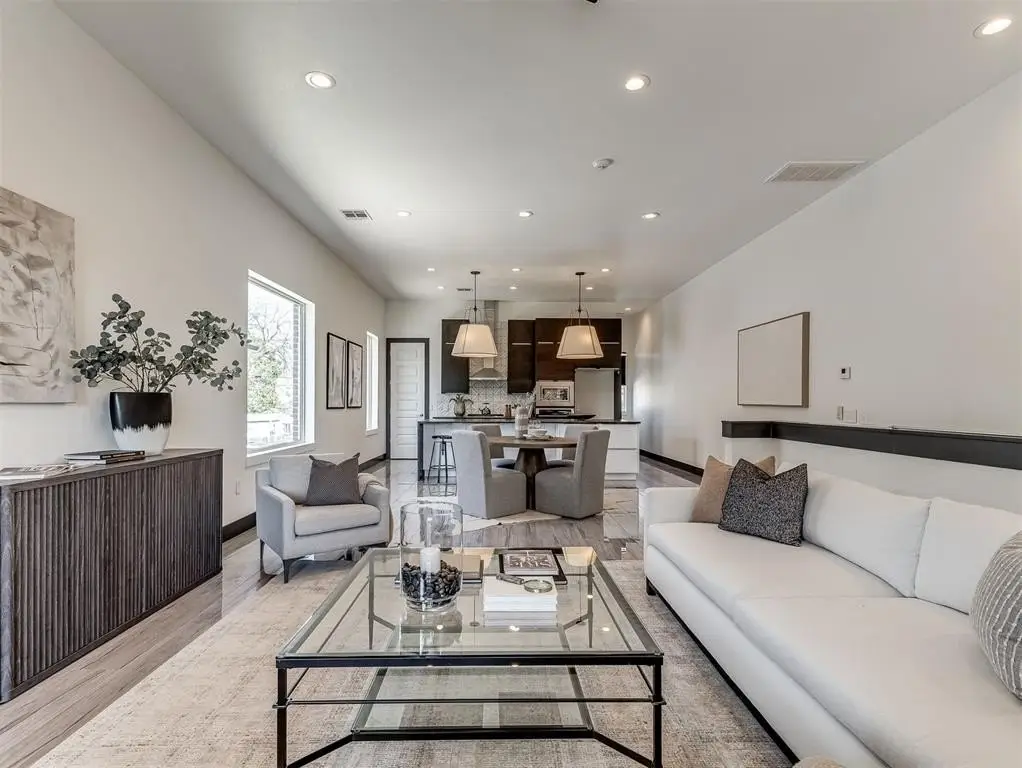
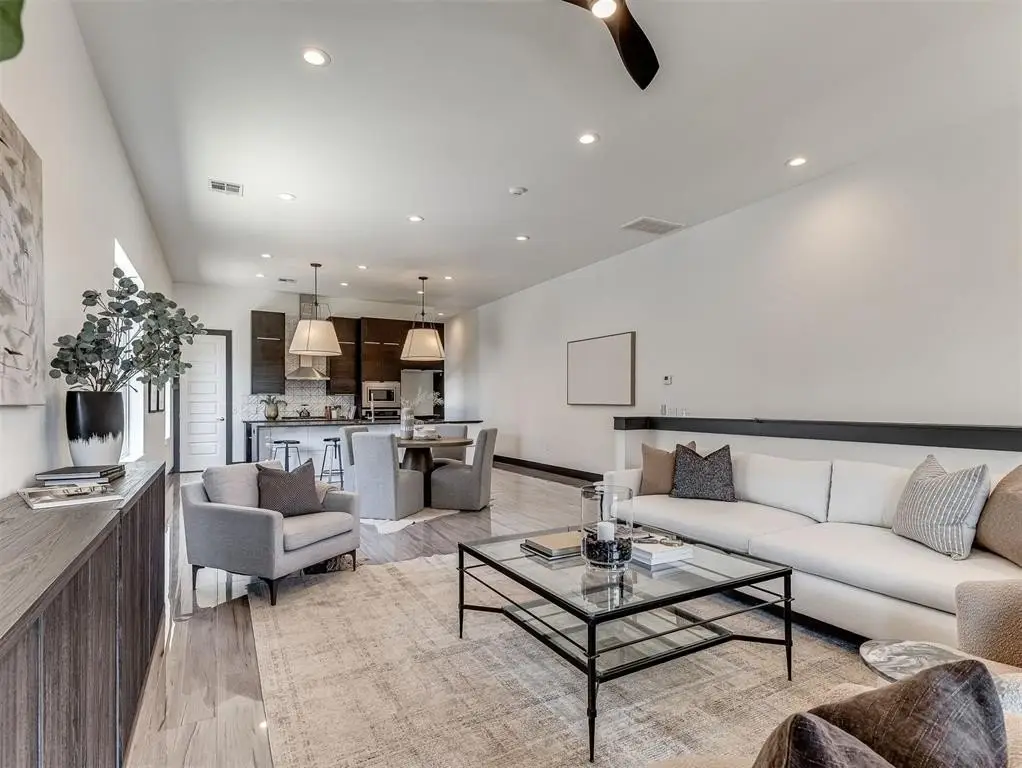
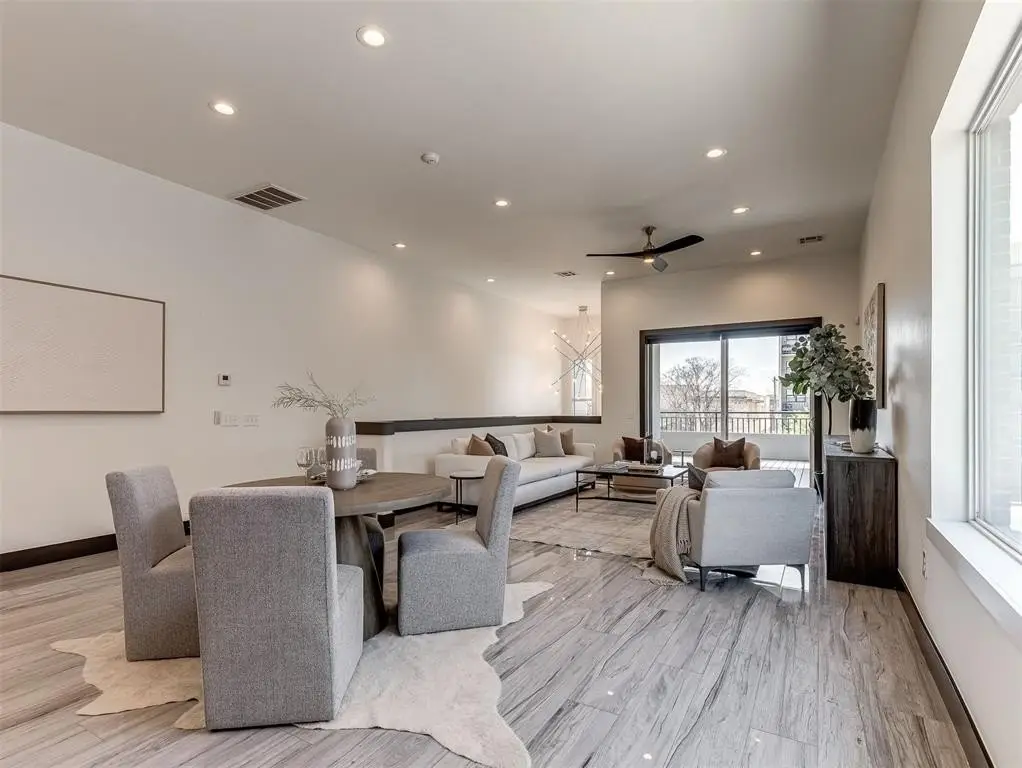
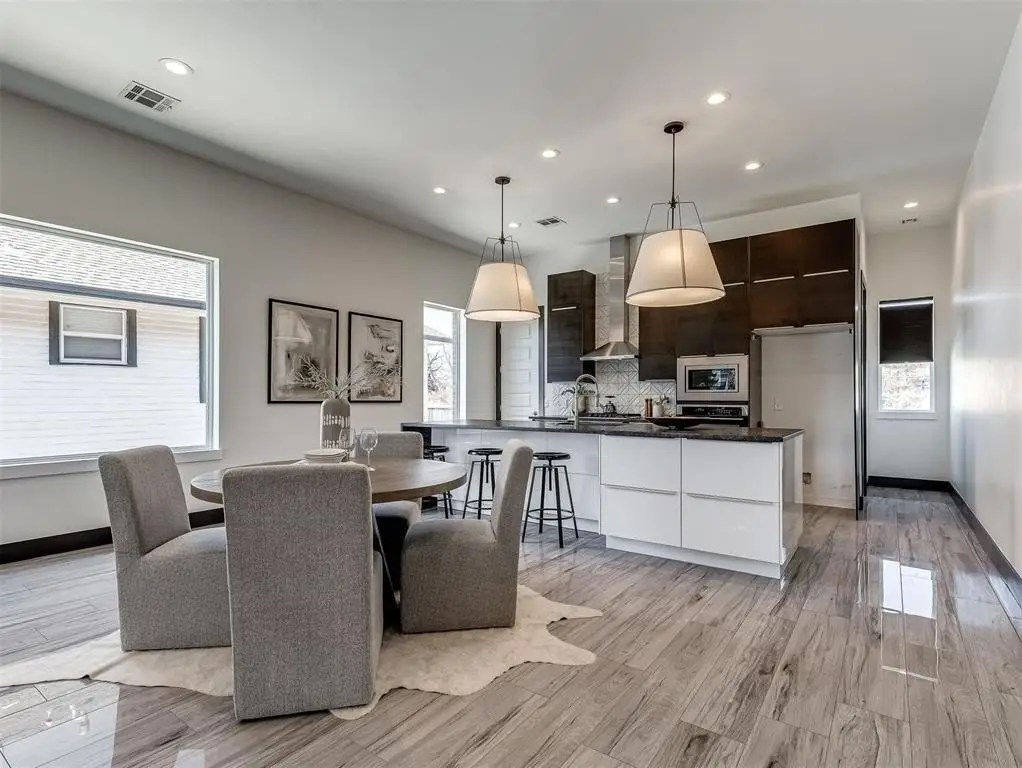
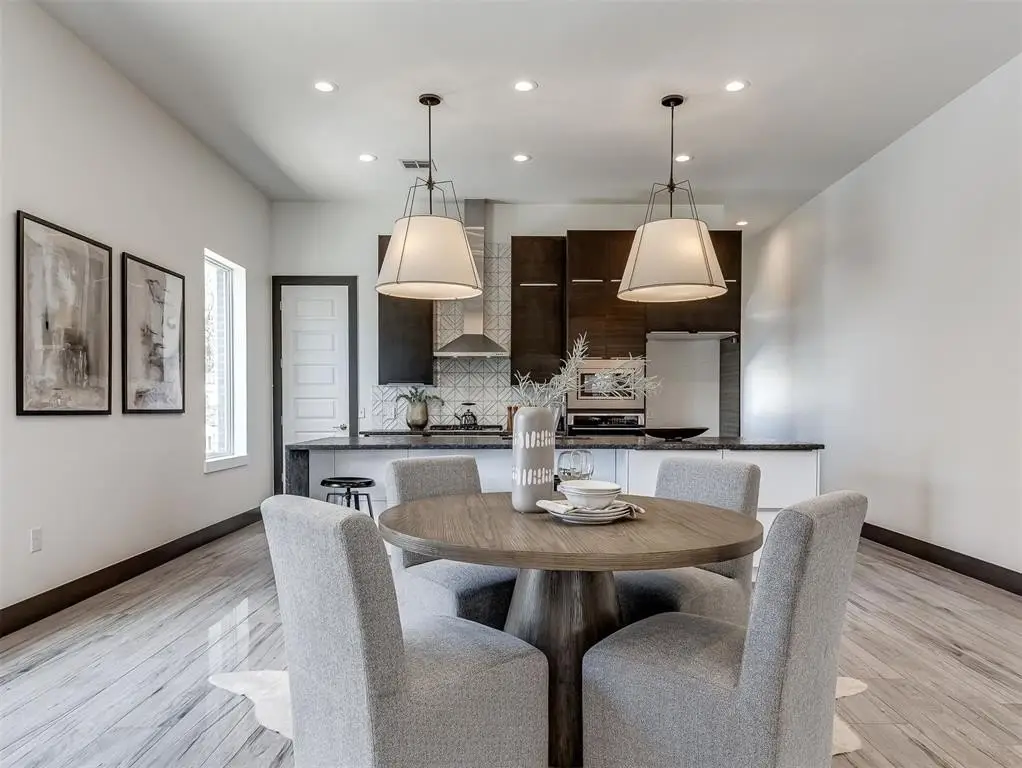
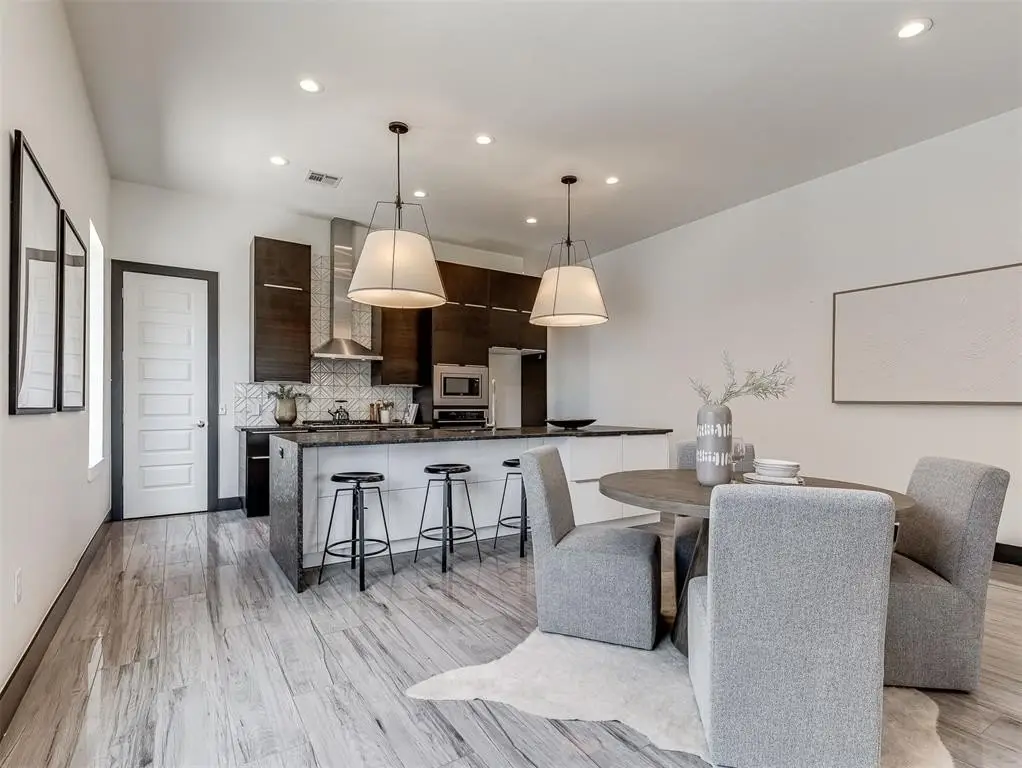
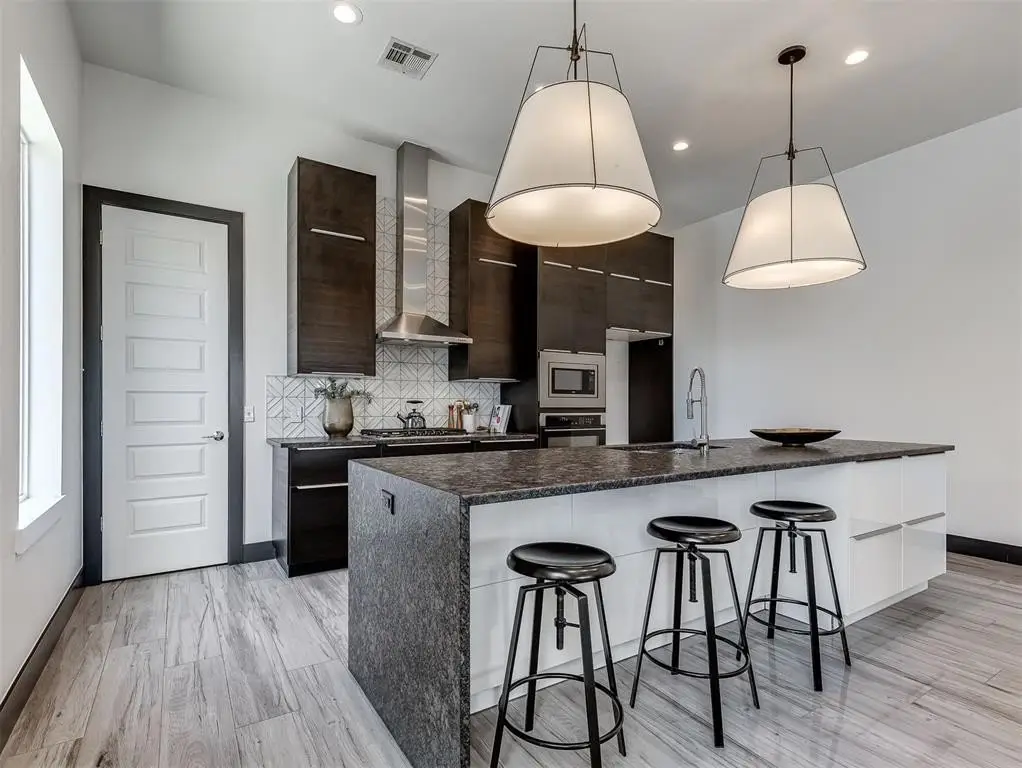
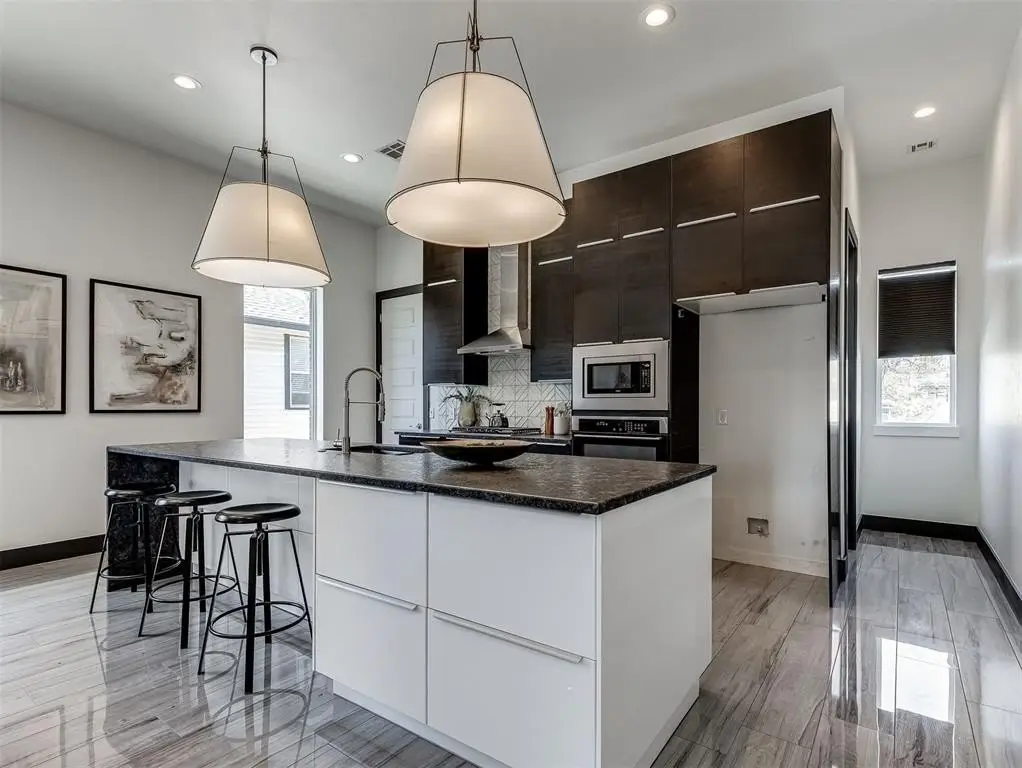
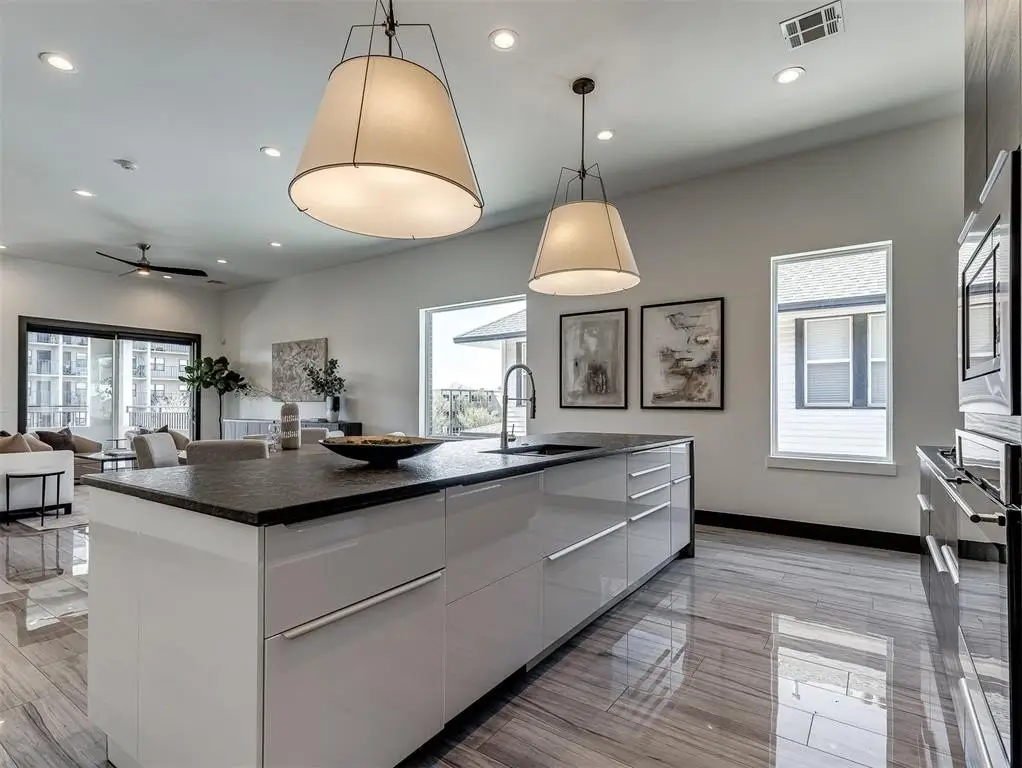
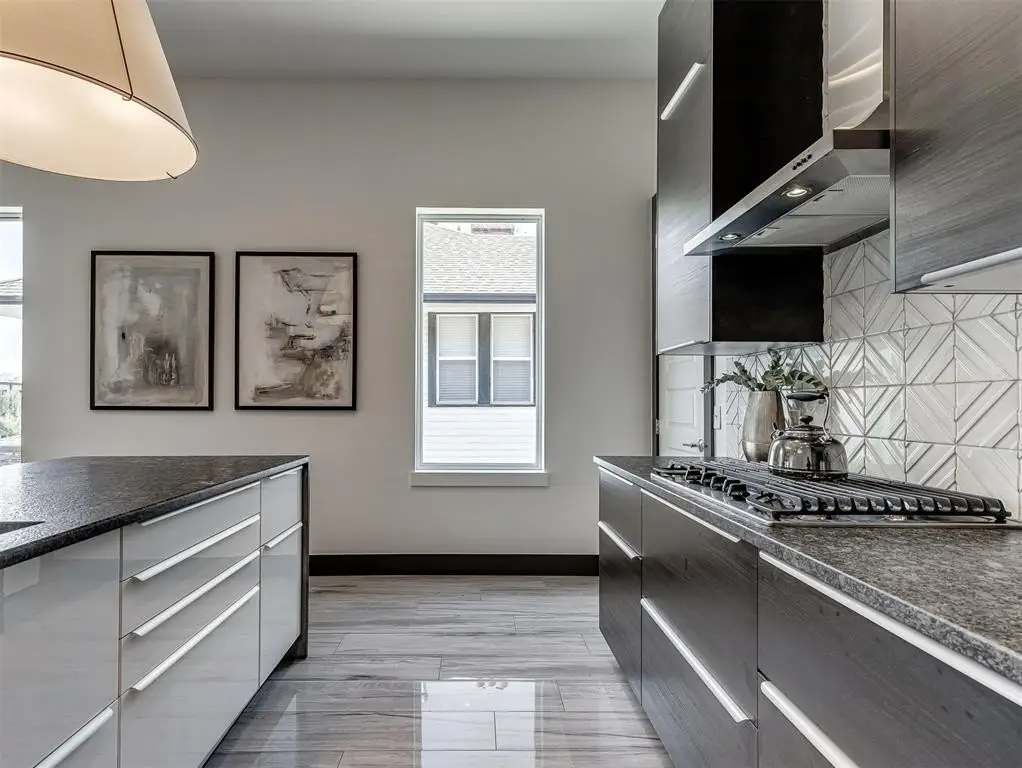
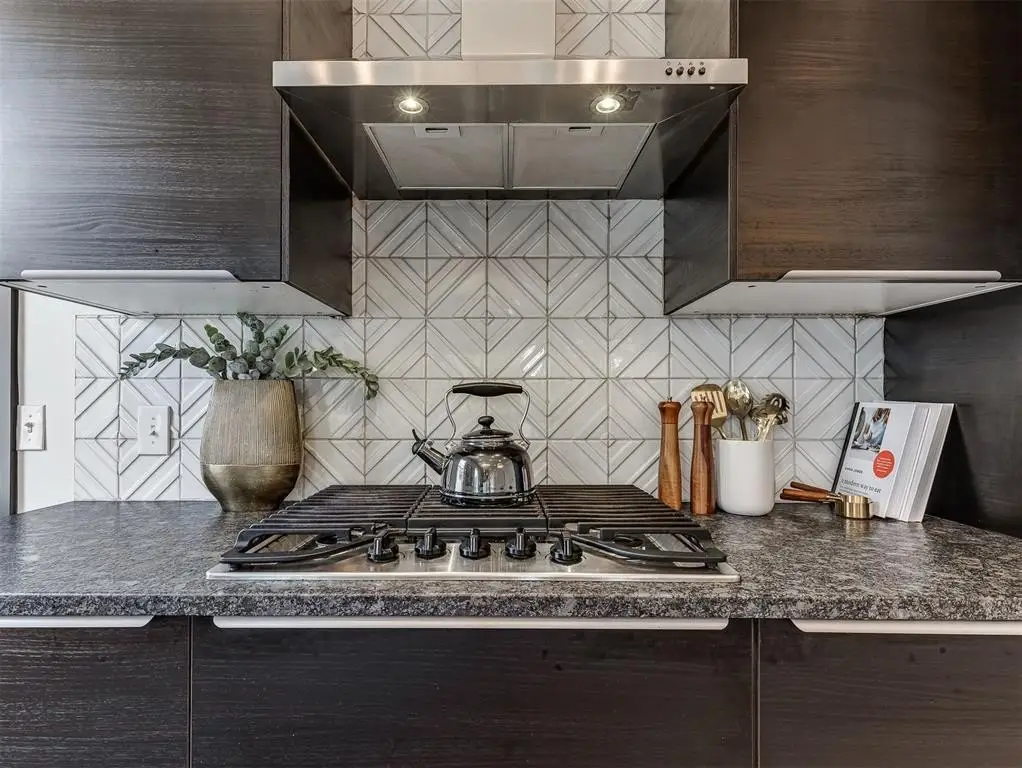
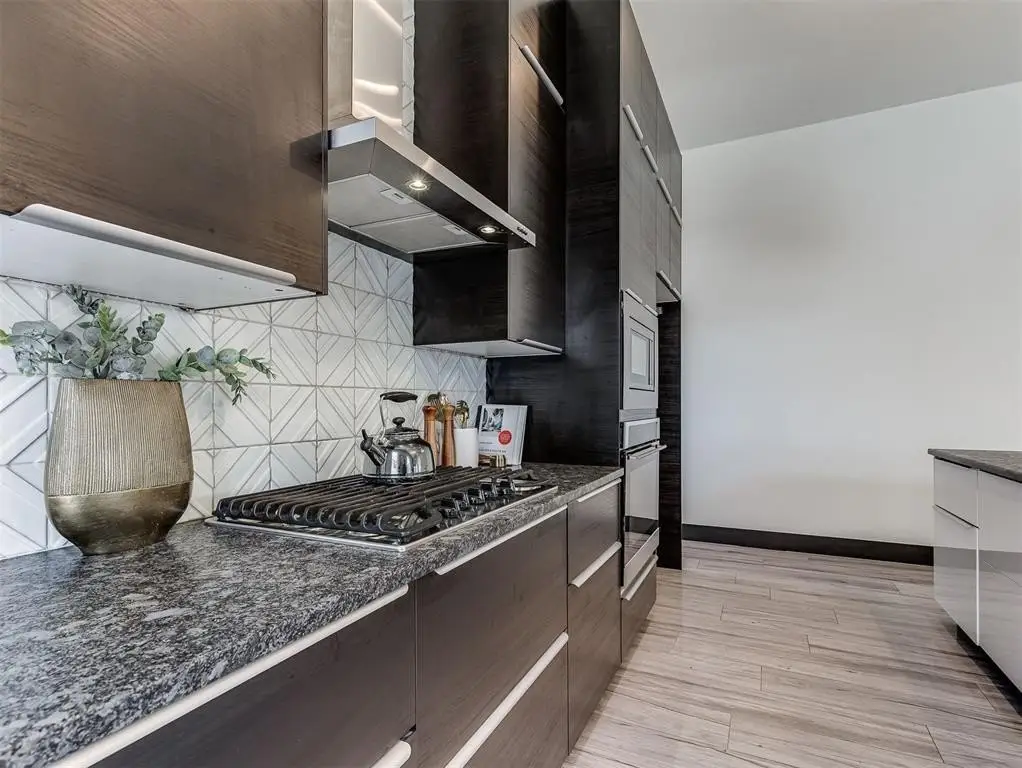
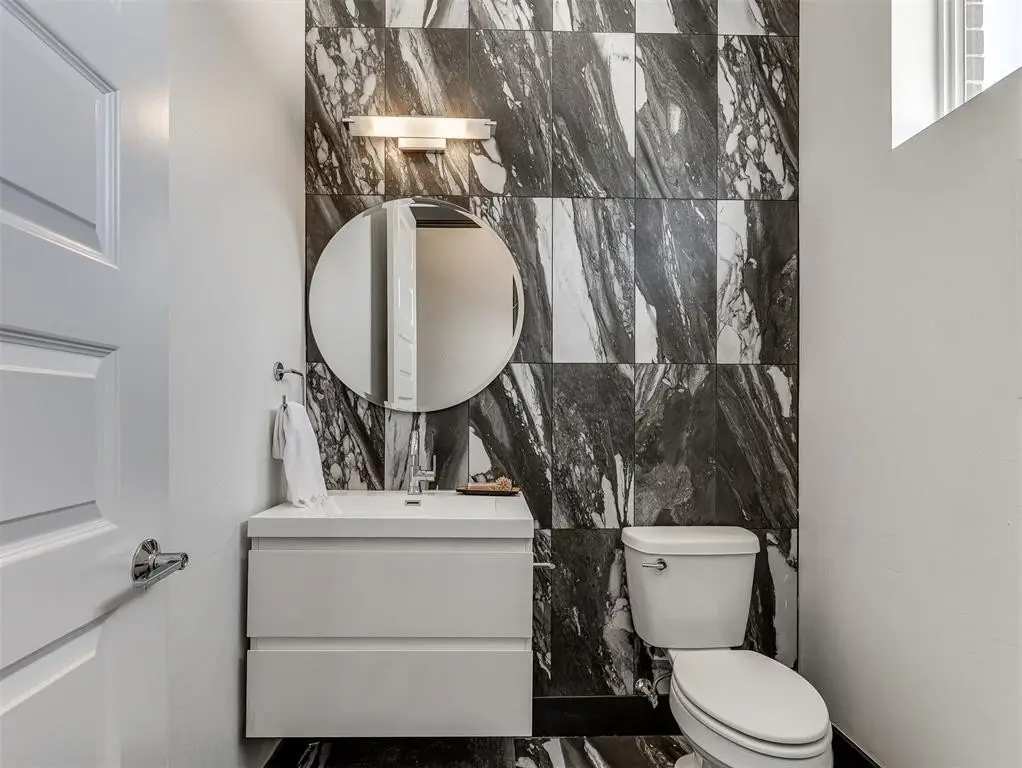
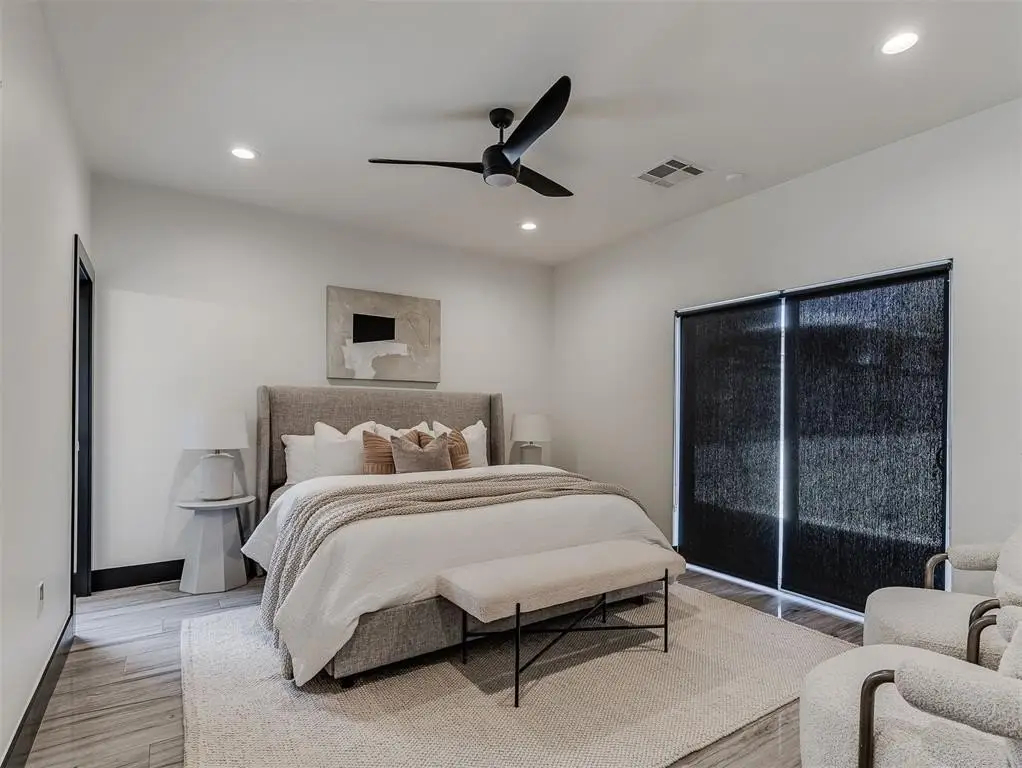
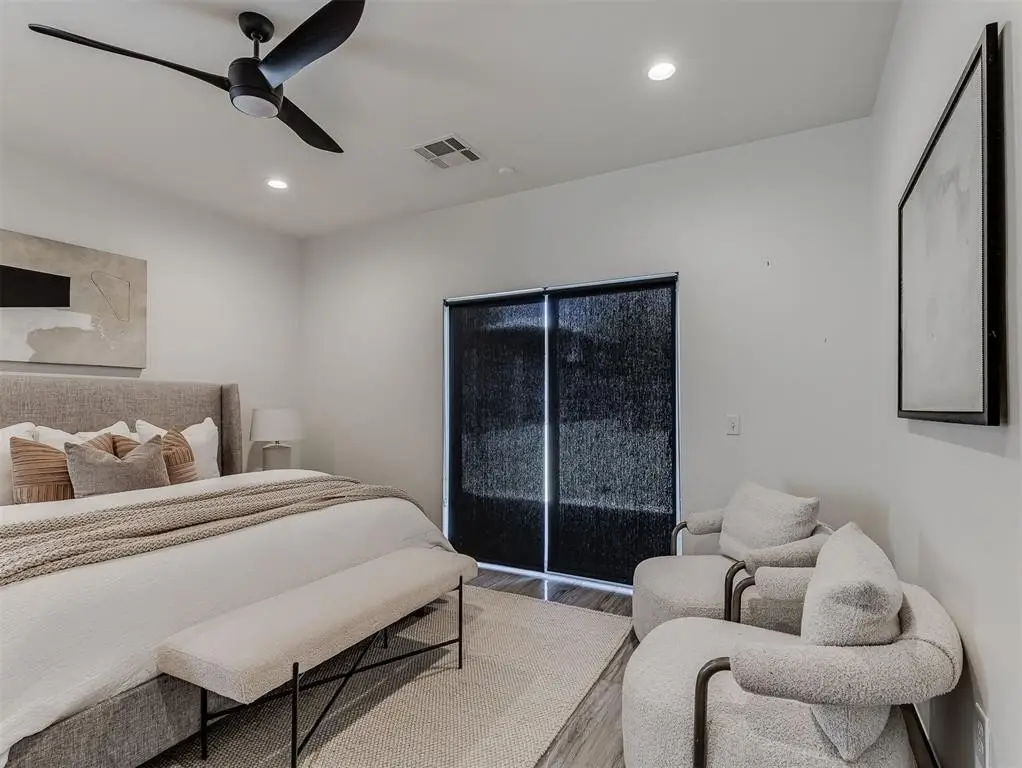
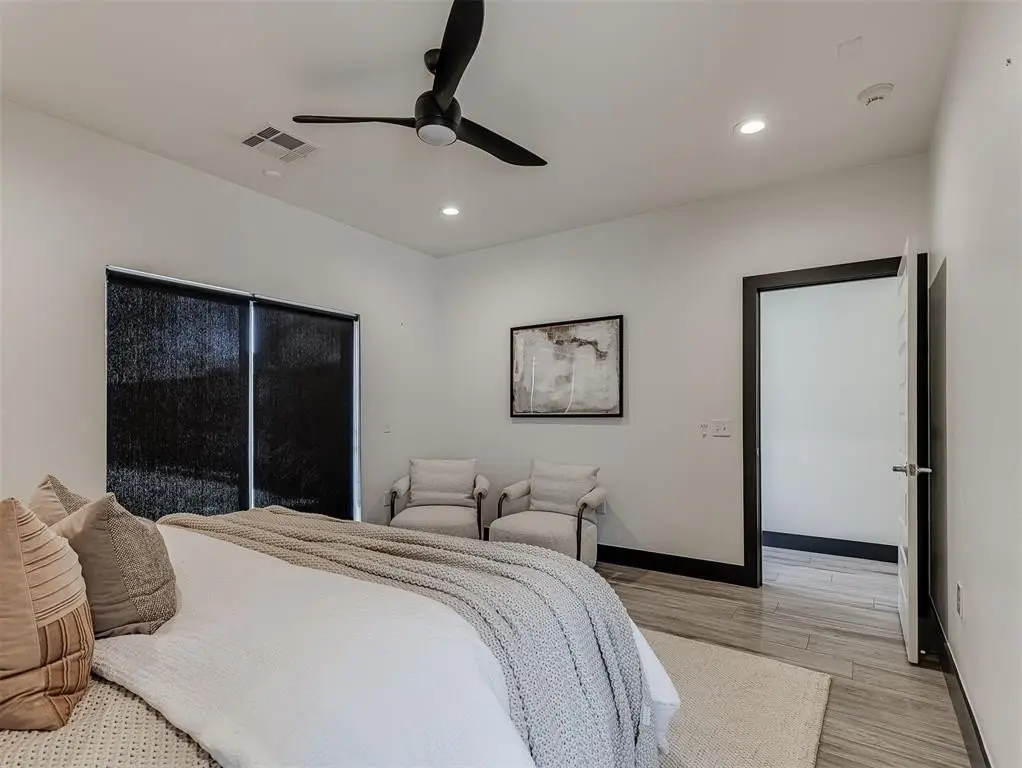
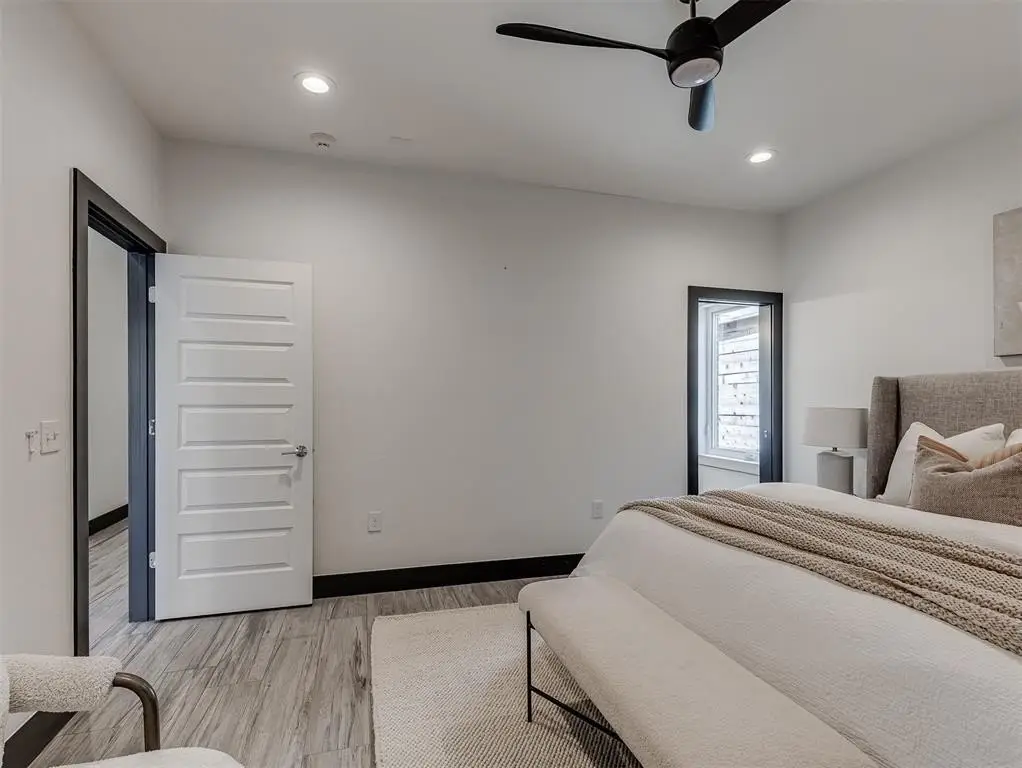
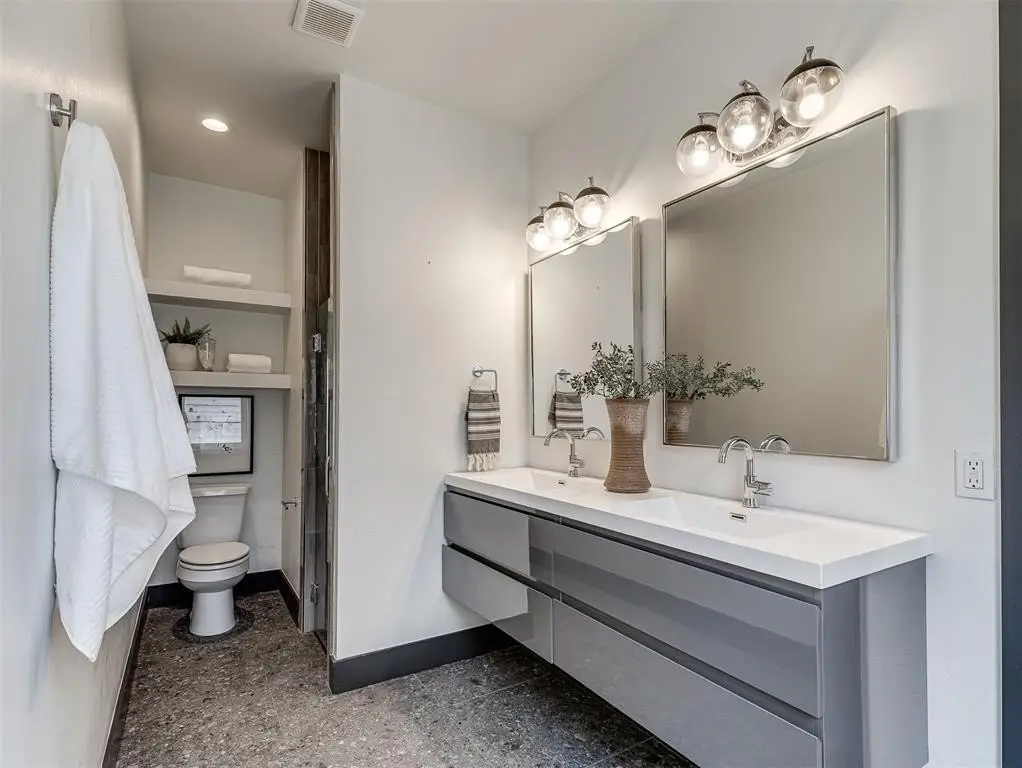
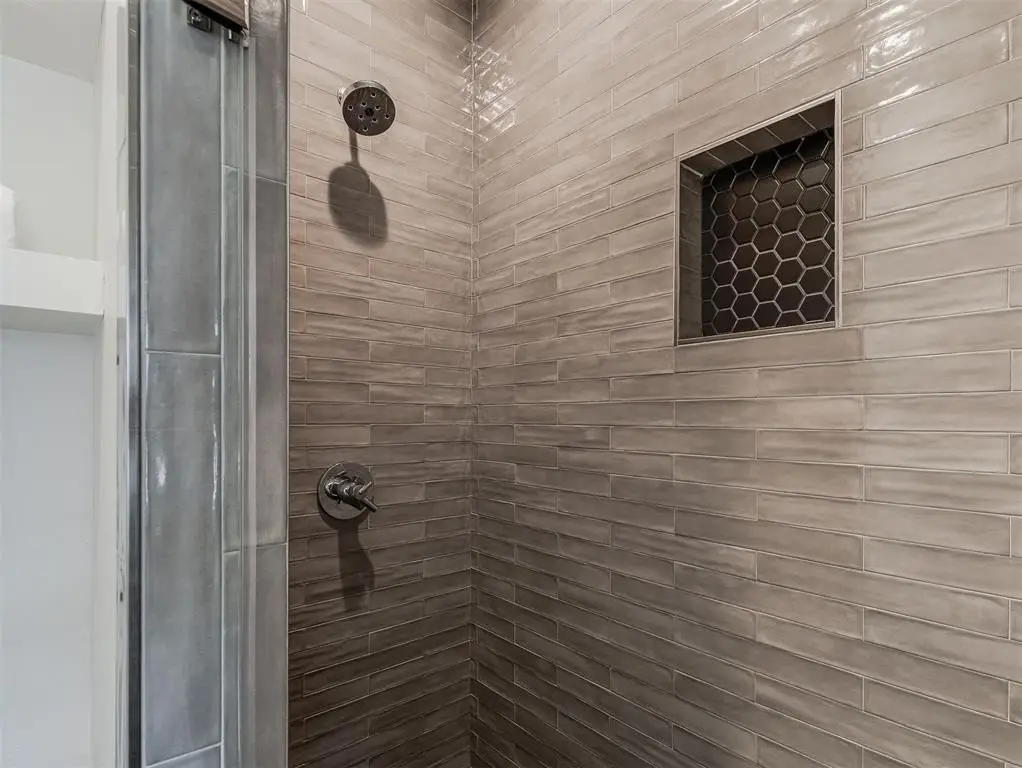
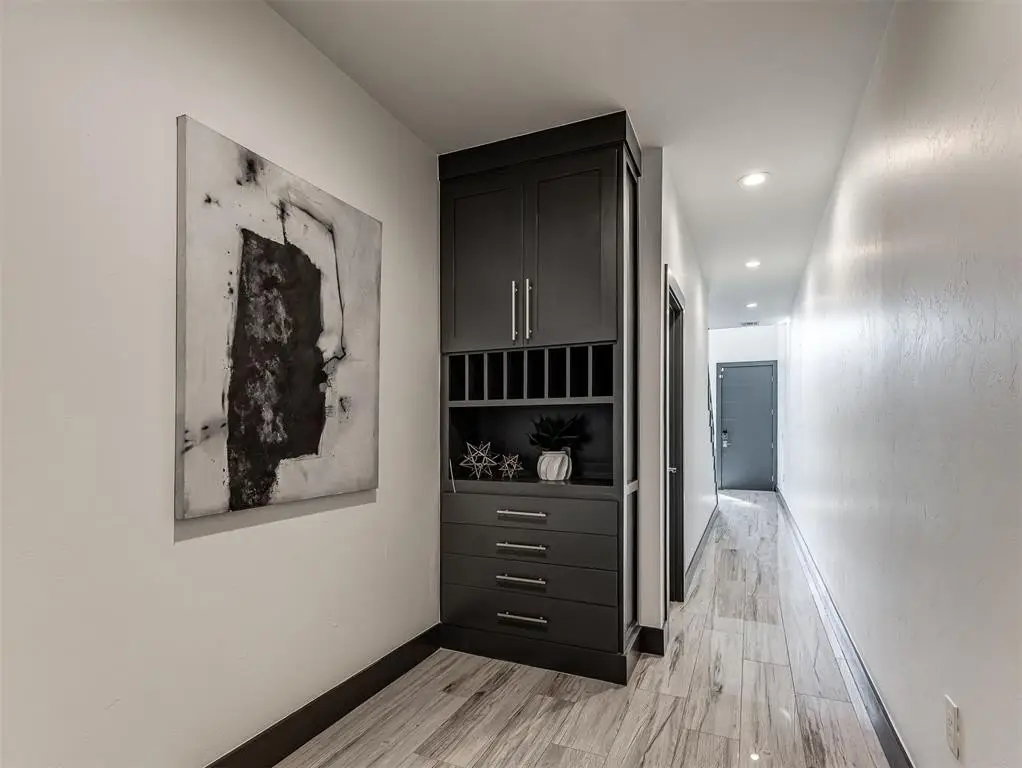
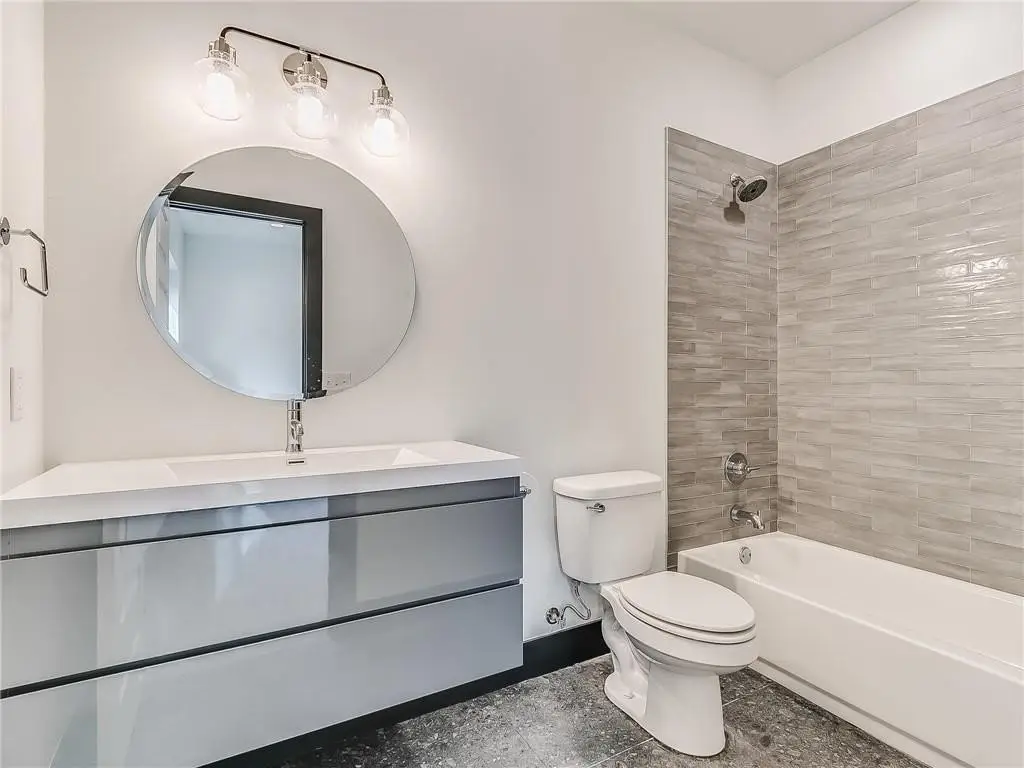
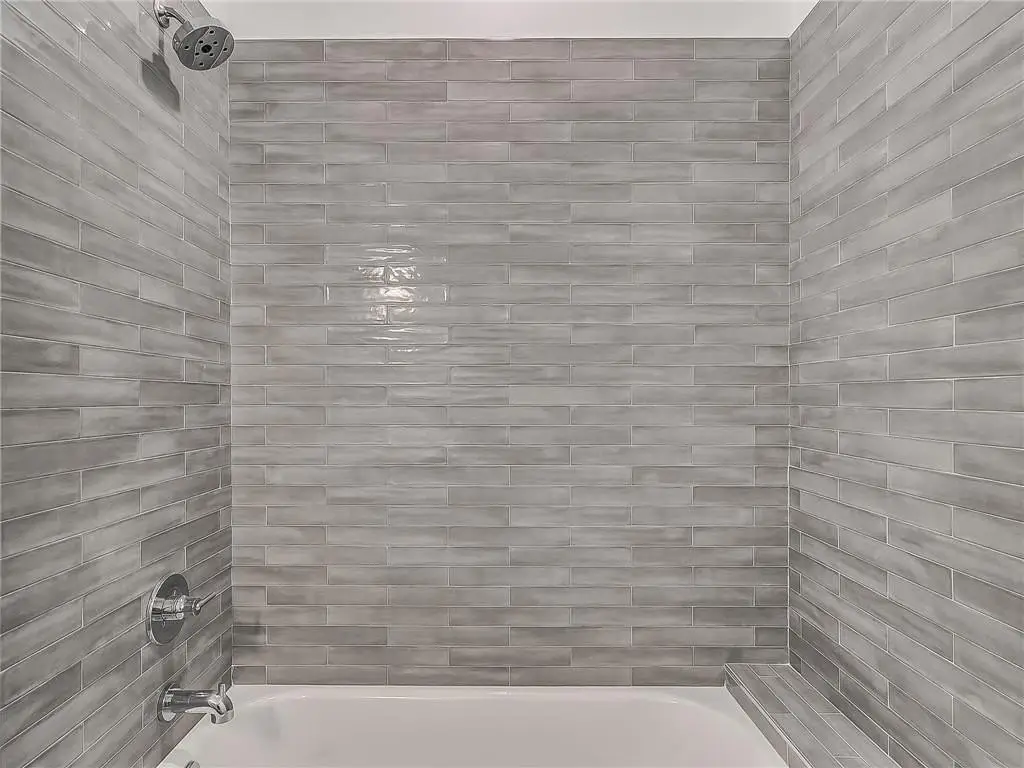
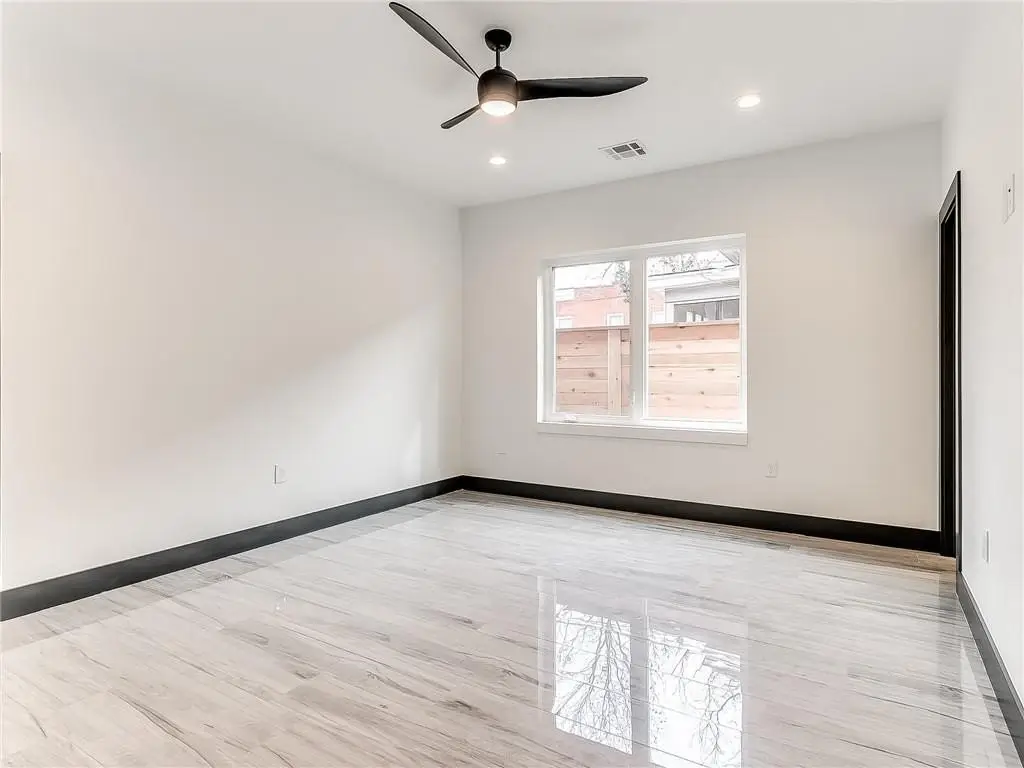
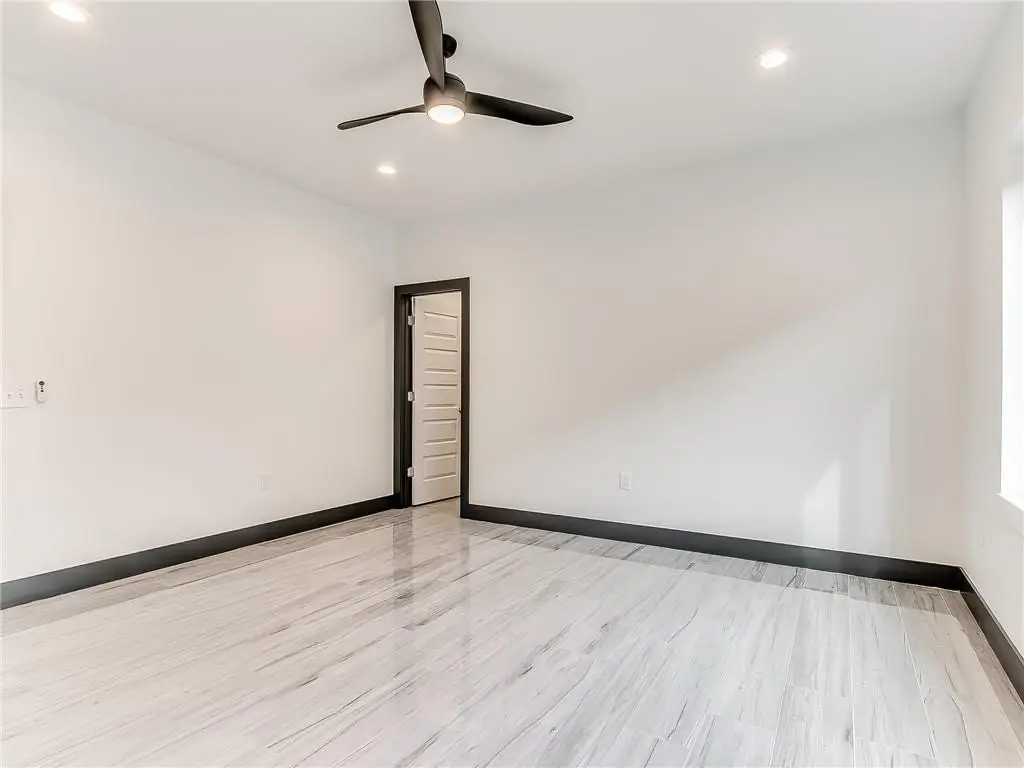
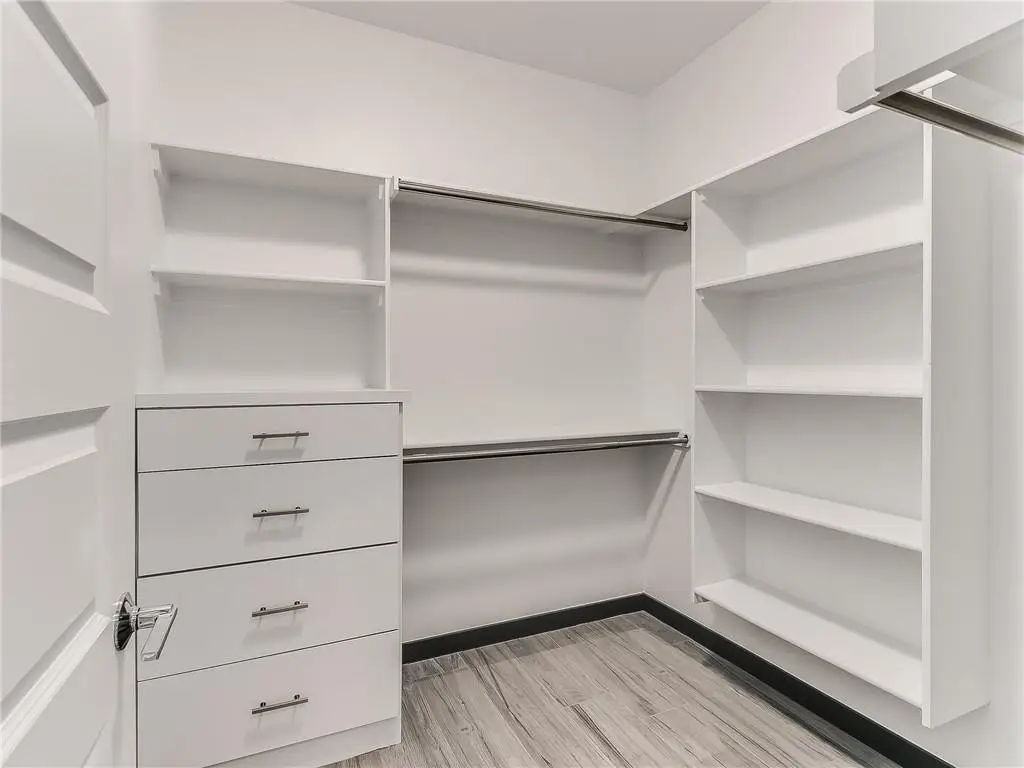
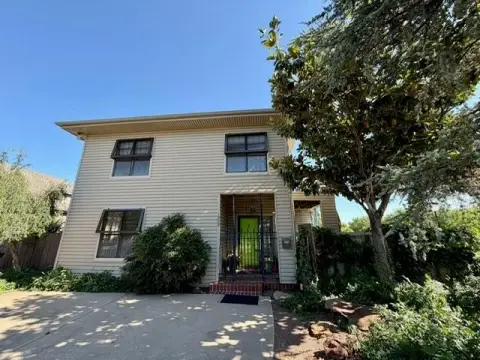
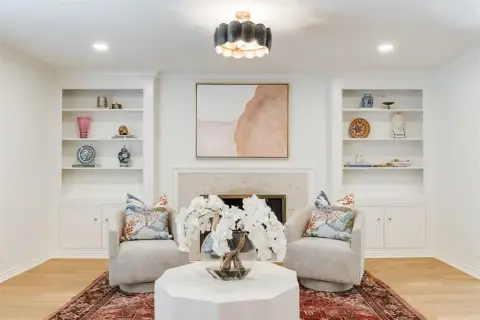
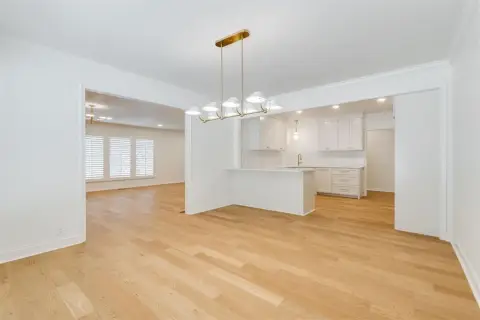
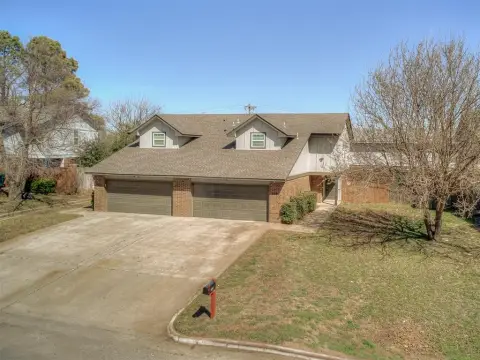
Built in 2020, this 4,418-square-foot modern duplex contains two matching residences with contemporary finishes and open-concept living areas. Each unit includes two bedrooms with private en suite bathrooms, a half bath near the main living space, and a kitchen equipped with a dishwasher, disposal, and microwave. Brick and stucco construction, natural gas heating, and electric cooling support the property’s functional design.
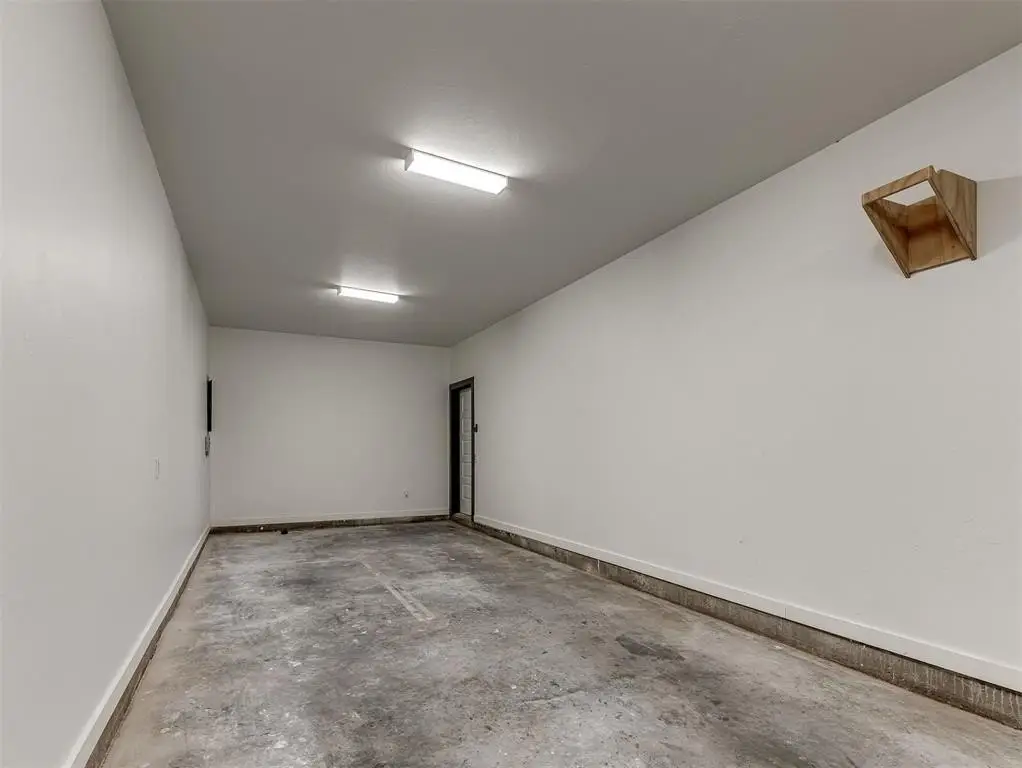
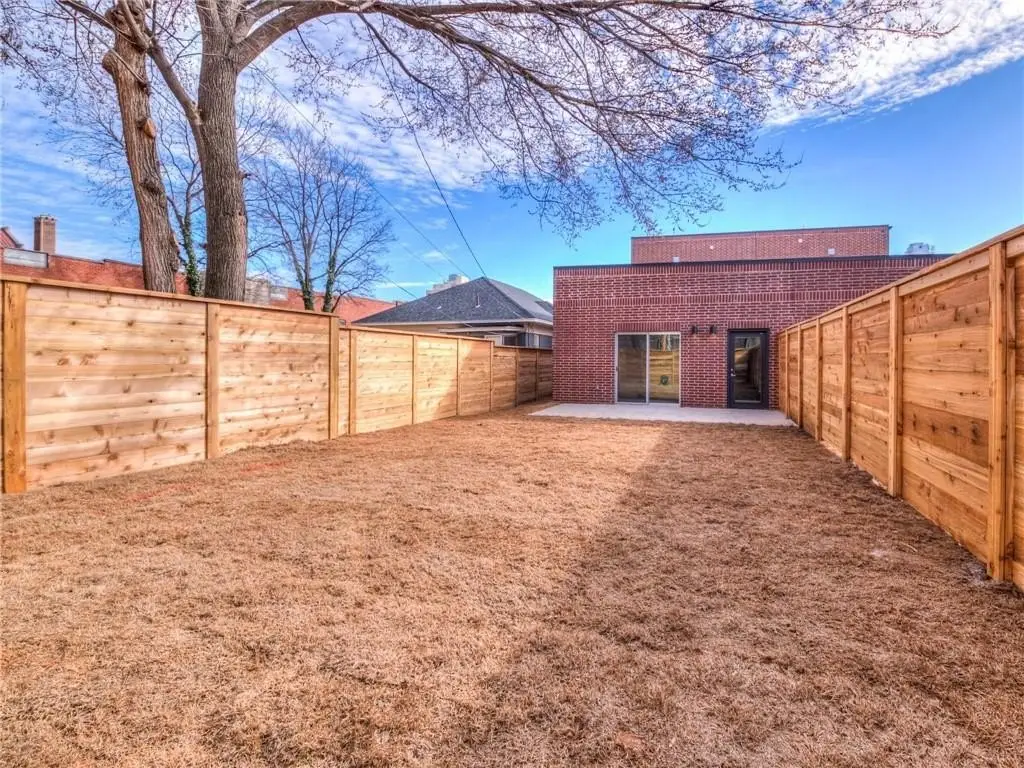
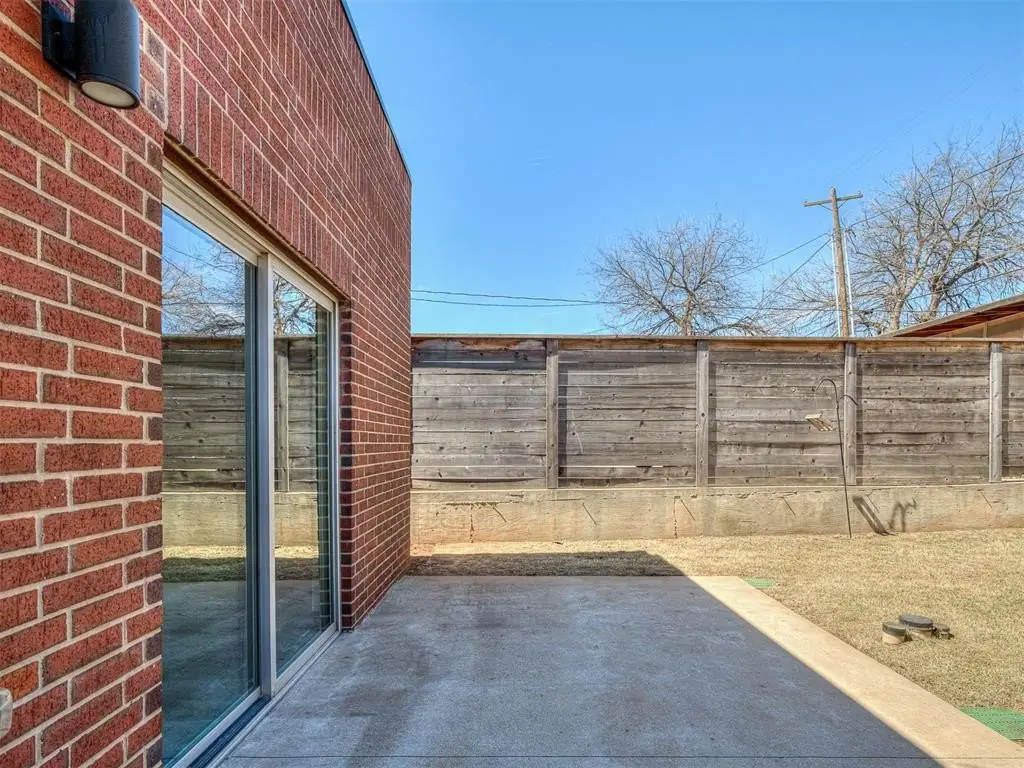
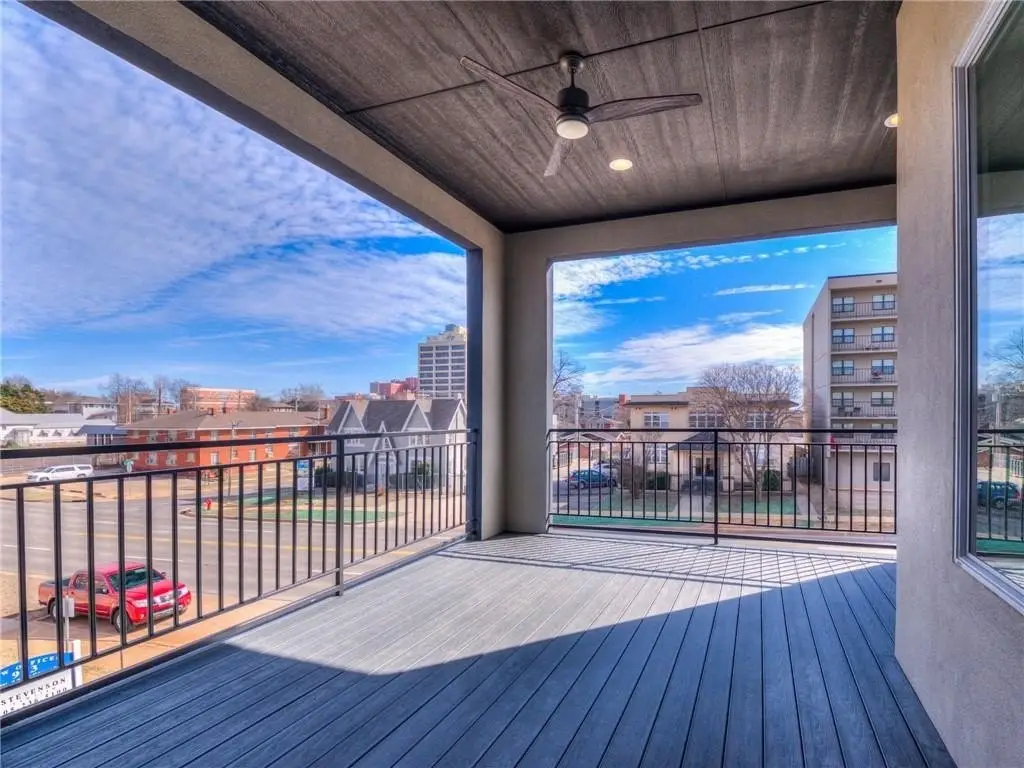
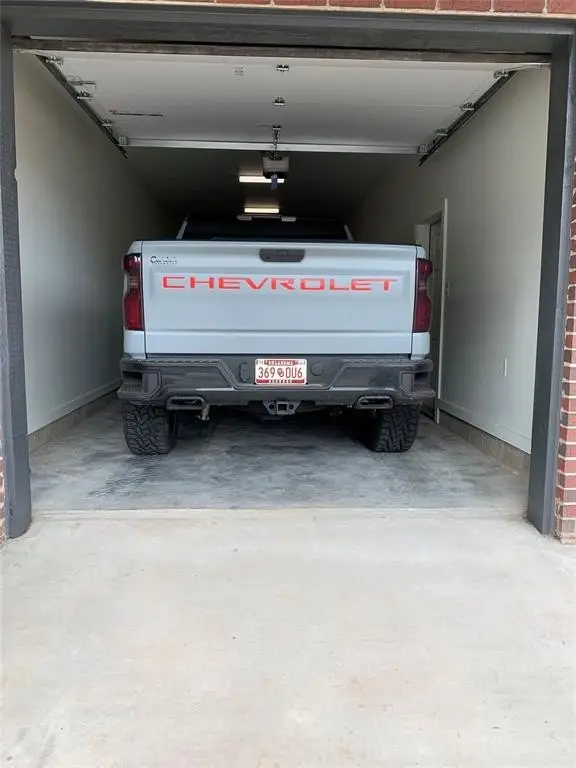
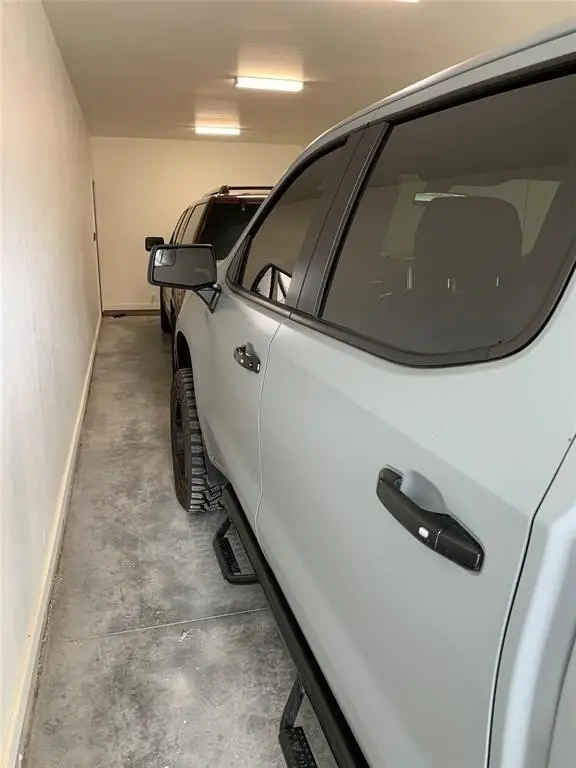
Outdoor features include an oversized backyard and a dedicated dog wash station, along with a two-car tandem garage. The property also offers views toward downtown Oklahoma City and is positioned near medical centers, dining, and nightlife. Its configuration supports separate residential use within a single duplex property.
Outdoor features include an oversized backyard and a dedicated dog wash station, along with a two-car tandem garage. The property also offers views toward downtown Oklahoma City and is positioned near medical centers, dining, and nightlife. Its configuration supports separate residential use within a single duplex property.
Key Highlights
- 4,418‑square‑foot duplex built in 2020
- Two matching units, each with two bedrooms and private en suite bathrooms
- Open‑concept kitchens and living areas with contemporary finishes
Financial Insights
Estimated NOI and Cap Rate
NOI / Yr
$40,331
Cap Rate
3.67%
Suggested Prices Based on Cap Rates
Cap Rate 5%
$806,620
$806.6K
Cap Rate 7%
$576,157
$576.2K
Cap Rate 9%
$448,122
$448.1K
Market Conditions
NOI Build-Up for 4,418 SF
Gross rent
$61.0K $13.80/SF
− Vacancy
−$3.4K −$0.76/SF
EGI
$57.6K $13.04/SF
− OpEx
−$17.3K −$3.91/SF
NOI
$40.3K $9.13/SF
Area
Oklahoma City, OK
Vacancy
5.50%
Lease Rate
$13.80 /SF/Yr
Expense Ratio
30.00%
Simulate Cap Rate and NOI
Suggested Prices Based on Cap Rates
Cap Rate 5%
$806,620
Cap Rate 7%
$576,157
Cap Rate 9%
$448,122
Alternative Uses
Best Use
Multifamily LT 5
$576.2K
$504.1K – $672.2K
NOI $40,331 @ 7.0% cap · market cap 3.67%
Second Best
Apartment 5plus
$533.1K
$466.5K – $622.0K
NOI $37,317 @ 7.0% cap · market cap 3.39%
Theoretical Best
Specialty Retail
$1.51M
$1.32M – $1.76M
NOI $105,767 @ 7.0% cap · market cap 9.62%
Zoning and permitted uses should be independently verified with authorities.
How Realmo checks its estimates
Property Analytics
Unlock full access to Insights
Subscribe to Realmo Intelligence
Open Analytics
Current Use
Lease Details
2
Residential units
Location Intelligence
Trade Area within ½ mile
2,278
Businesses Nearby
Explore this area
Business Placement
Demographics for 73106, OK
12,956
Population
6,069
Households
2.1
Avg Household Size
32
Median Age
40%
College-Educated
85%
High-School Grad
3.0 sq mi
ZIP Area
4,319
Density / Sq Mi
$51,934
Median Household Income
$32,145
Median Earnings
$1,050
Median Rent
$262,500
Median Home Value
Check the figures for this property
Cap Rate, Value Estimation, Potential NOI and more
View Realmo Analytics
Market
Vacancy Rate% for Multifamily in South region

Questions? Ask Rey
Realmo’s AI knows this listing — price, zoning, demand, history. Ask anything.




Frequently Asked Questions
What type of property is this?
Duplex - Modern duplex with open-concept interiors, private bedroom suites, and a tandem garage.
Where is this duplex located?
The property is located at 911 NW 13 Street Oklahoma City, OK.
What is the asking price?
The asking price for this property is $1,100,000.
What are key features of this property?
This property features: 4,418‑square‑foot duplex built in 2020; Two matching units, each with two bedrooms and private en suite bathrooms; Open‑concept kitchens and living areas with contemporary finishes


