Remodeled Duplex with En-Suite
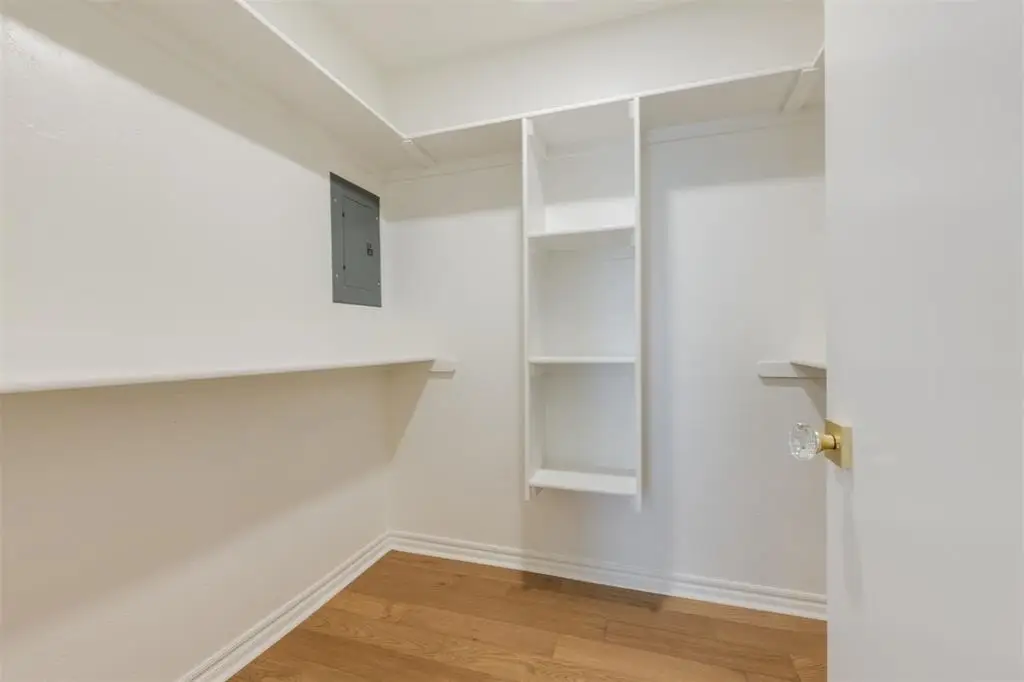
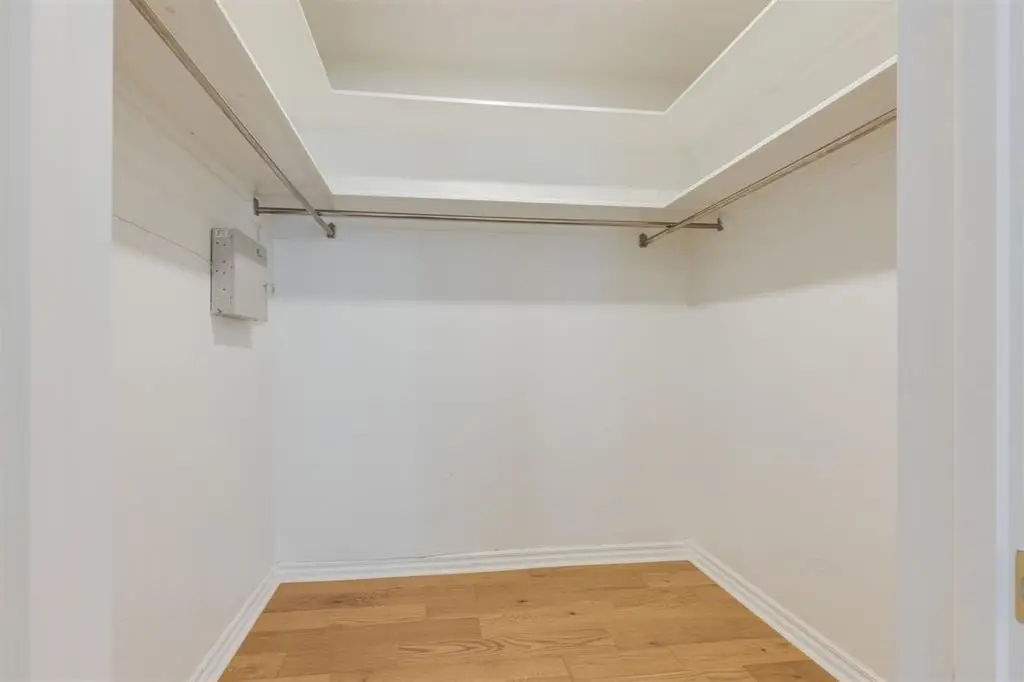
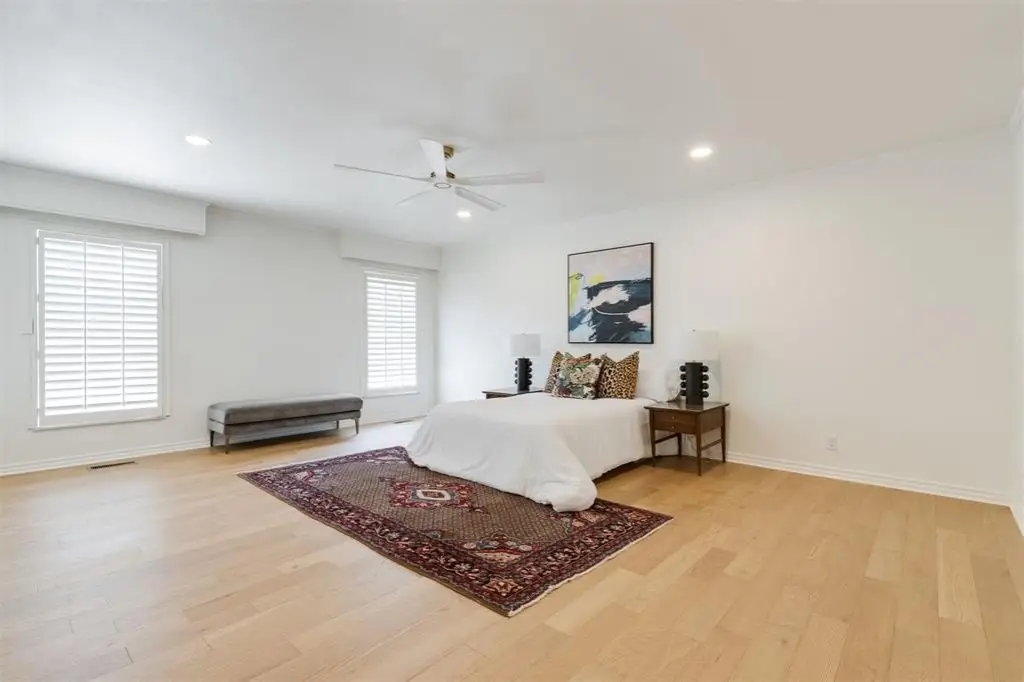
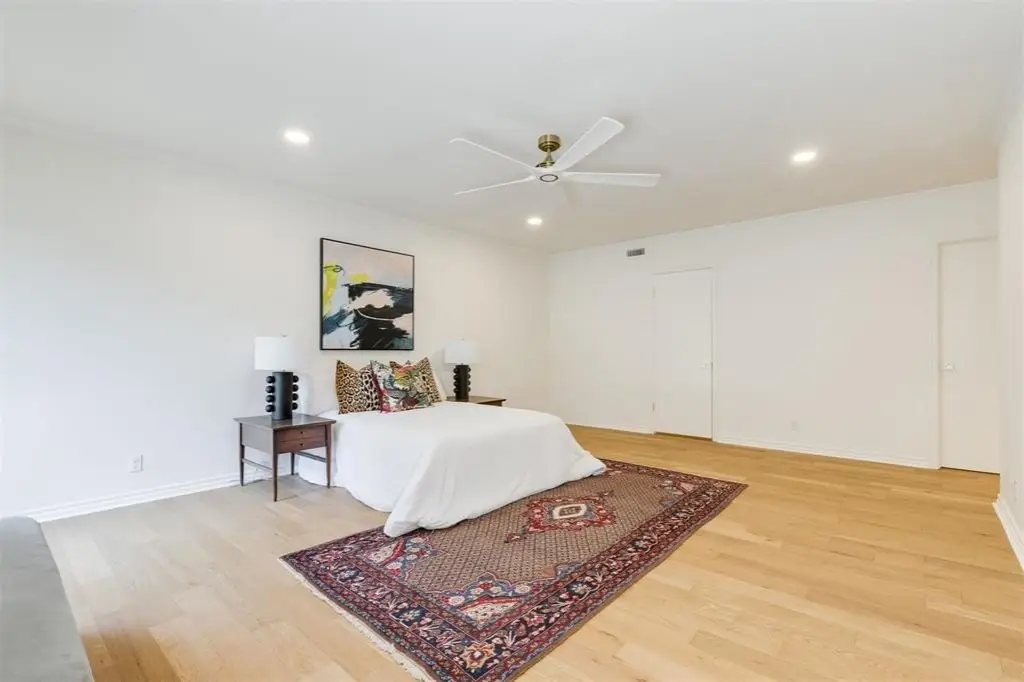
For Sale
$549,900
6341 Glenbrook Court, Oklahoma City, OK 73118
Residential, Oklahoma City, OK
Property Size3,033 SF
Lot Size0.16 Acres
Price / SF$181.31
Days on Market60
Property Features for 6341 Glenbrook Court
General Information
Property type
Residential
Property subtype
Duplex
Bedrooms
3
Bathrooms
4
Full bathrooms
3
Half bathrooms
1
Rooms
Bathroom 3, Bedroom 1, Bedroom 2, Bathroom 4, Bedroom 3, Bathroom 1, Bathroom 2
Patio and Porch features
Patio
Interior features
Ceiling Fan(s), Paint Woodwork
Exterior features
Water Feature
Fireplace
1
Appliances
Dishwasher, Disposal, Microwave
Lot features
Interior Lot
Elementary school
Nichols Hills ES
Middle school
Belle Isle MS
High school
John Marshall HS
Elementary school district
Oklahoma City
Middle school district
Oklahoma City
High school district
Oklahoma City
Directions
From NW 63rd Street, between N. Pennsylvania Ave. and NW Grand Blvd., turn south onto Glenbrook Court. Property is second unit on the right.
Standard status
Active
APN
6341NONEGlenbrook73118
Size
3,033 SF
Lot size
0.16 Acres
Utilities
Heating system
Zoned
Cooling system
Zoned
Building Details
Year built
1970
Flooring type
Combo
Building materials
Brick
Roof type
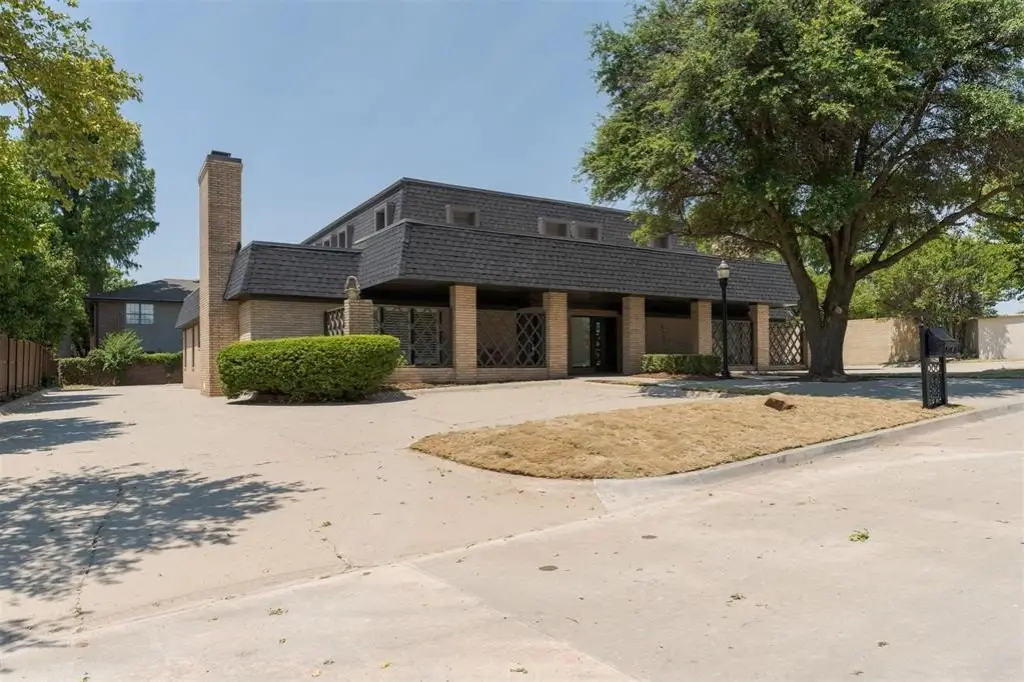
Mansard
Architectural style
Contemporary, Modern
Listing Agency:
Metro Mark Realtors
(405) 848-8818
Listed By:
Julie Donley · License #143108
(405) 409-0182
Added: Aug 7
Changed: Oct 3
Last Checked: Oct 5 at 9:06PM
MLS# 1243329
Copyright © 2026 MLSOK, Inc. All rights reserved. All information provided by the listing agent/broker is deemed reliable but is not guaranteed and should be independently verified.
Investment Insights
Based on property information with market context.
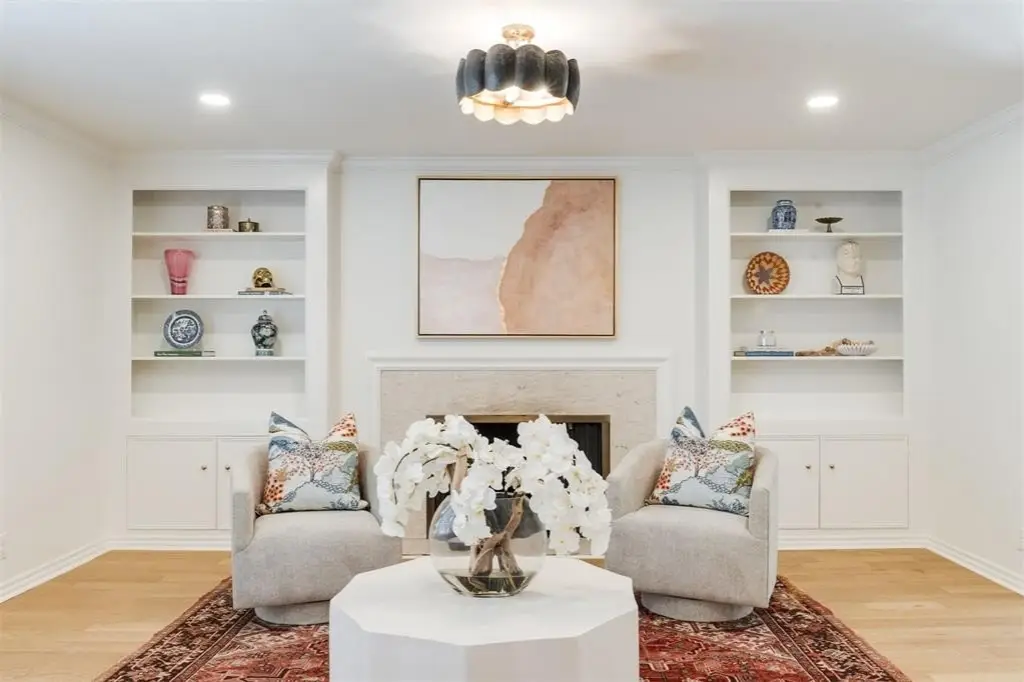
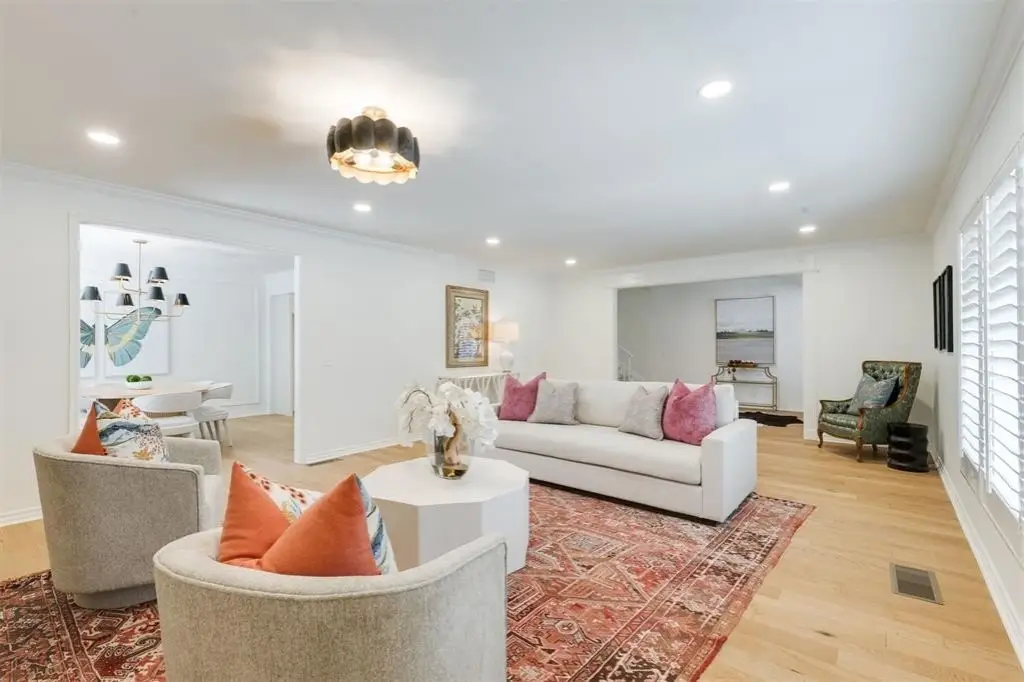
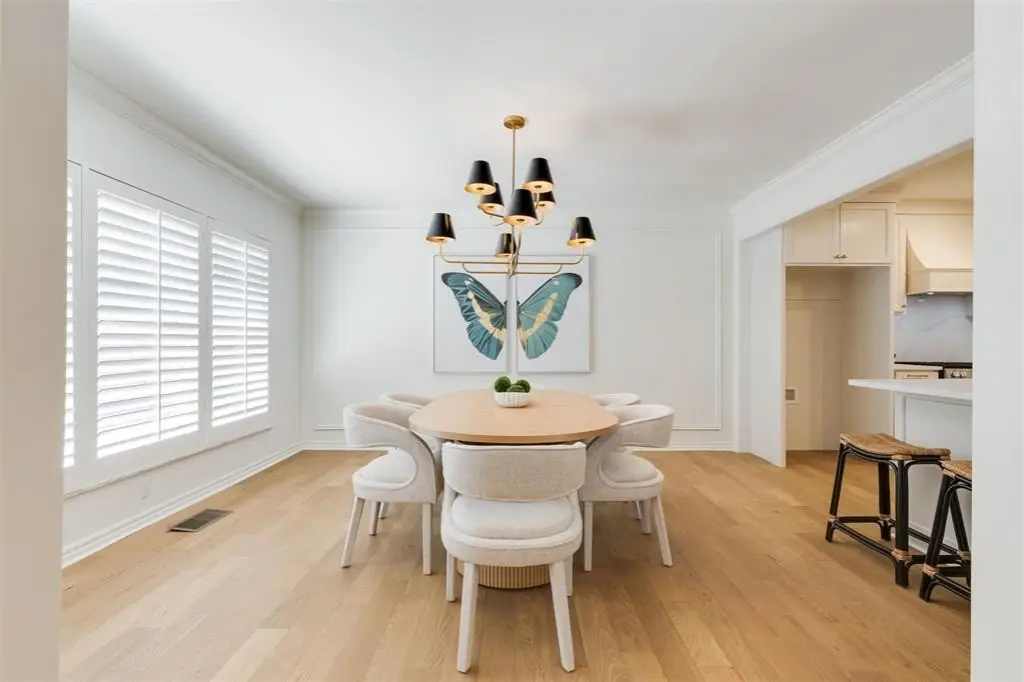
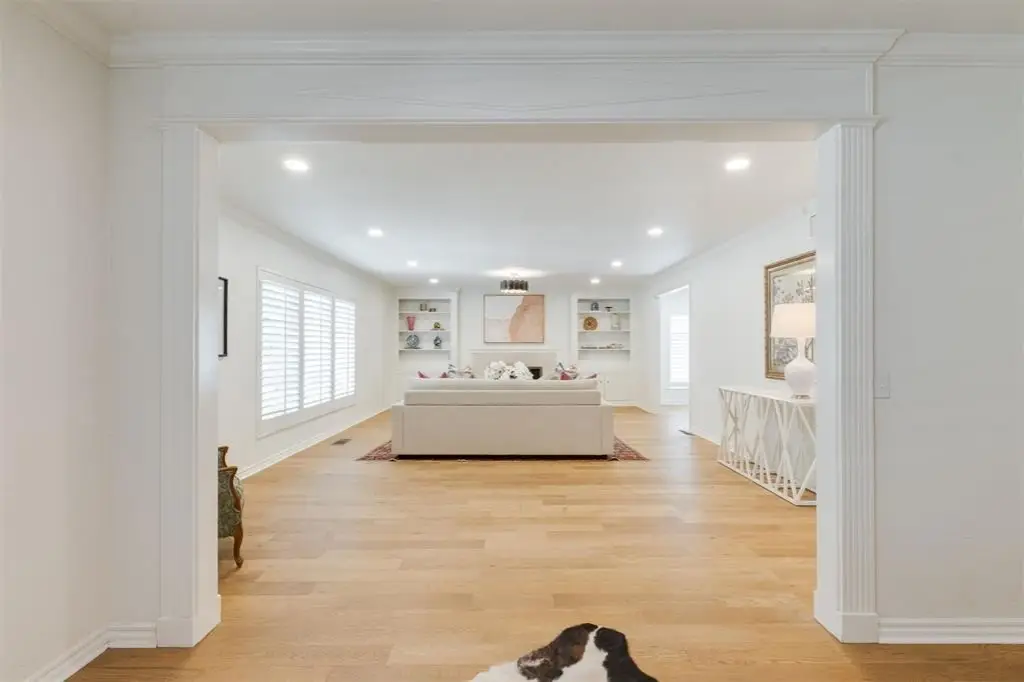
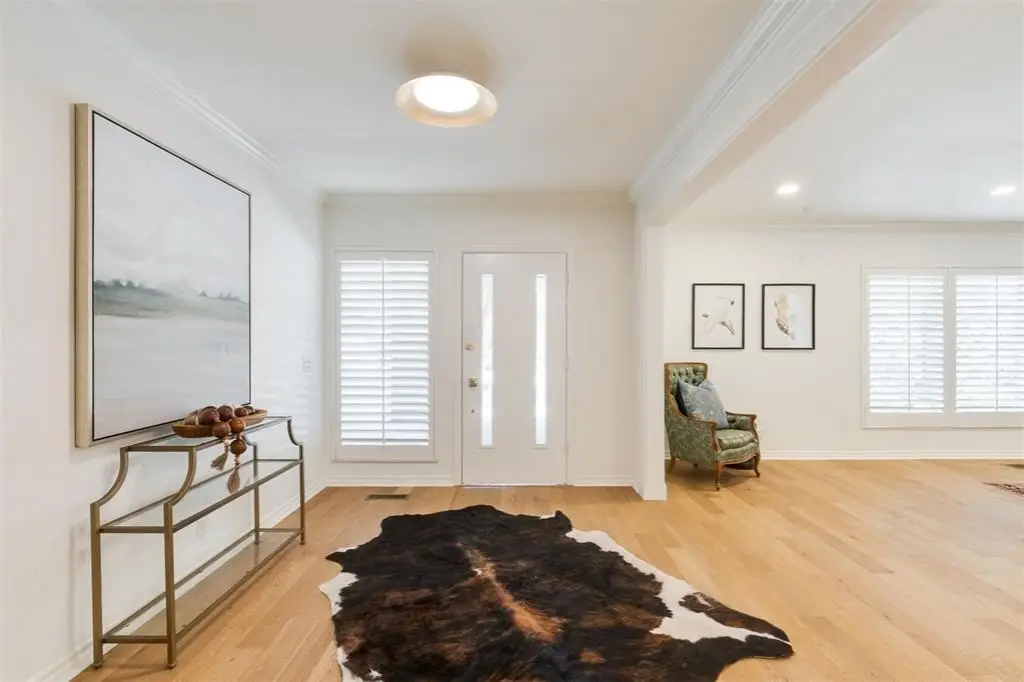
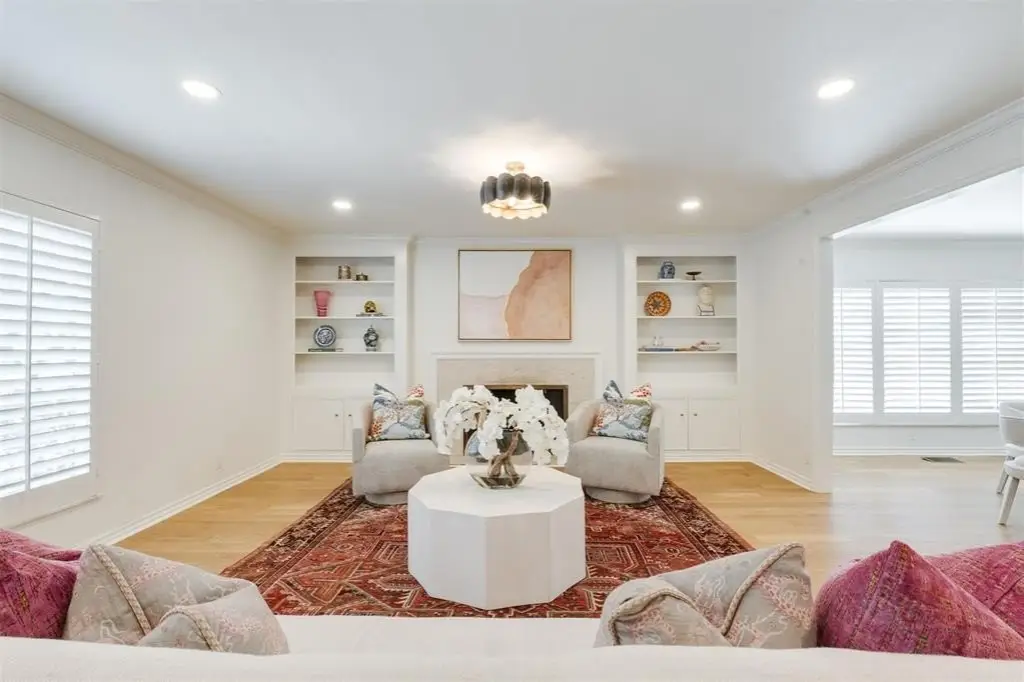
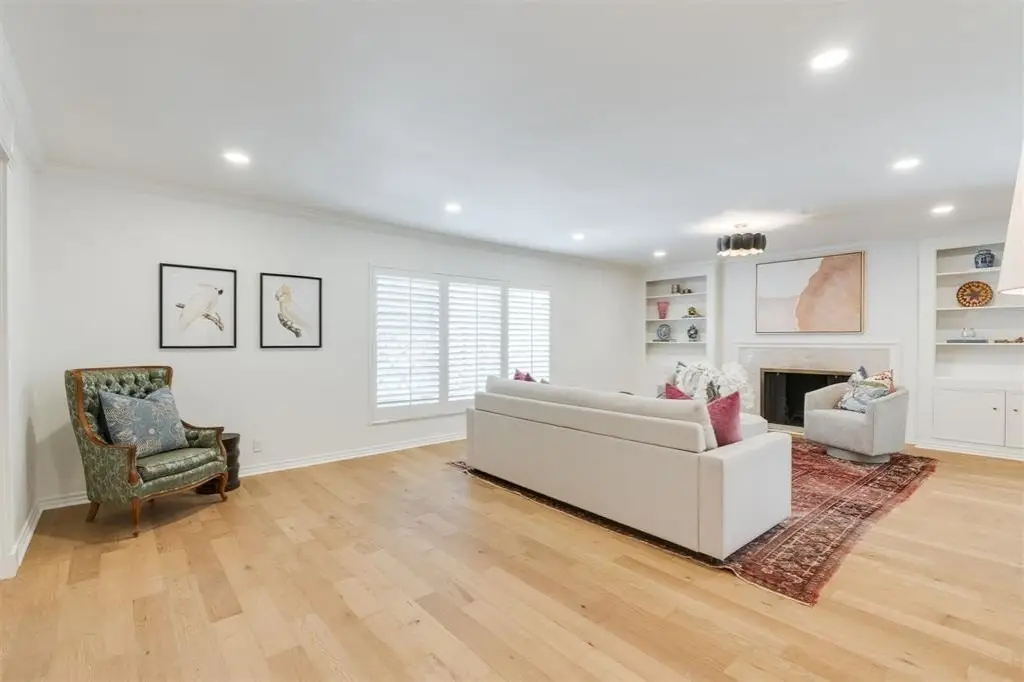
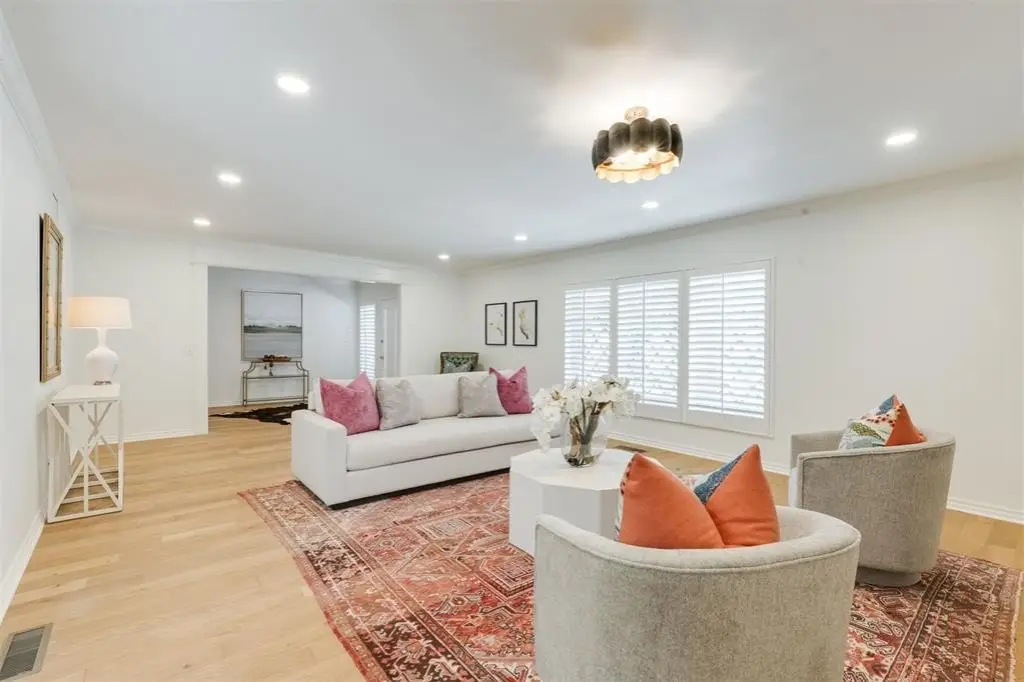
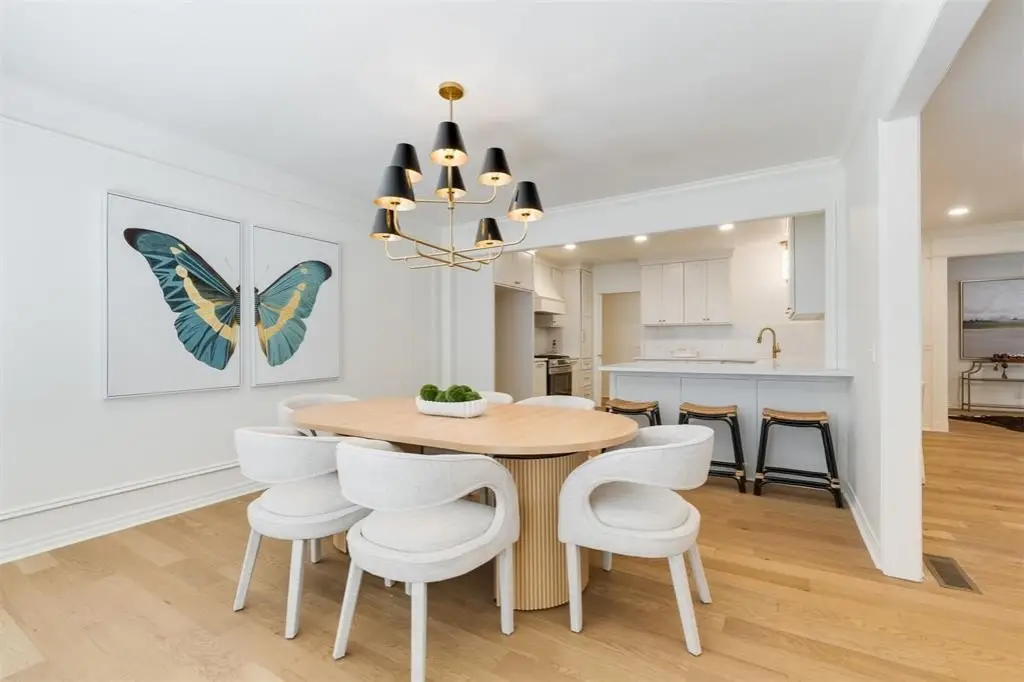
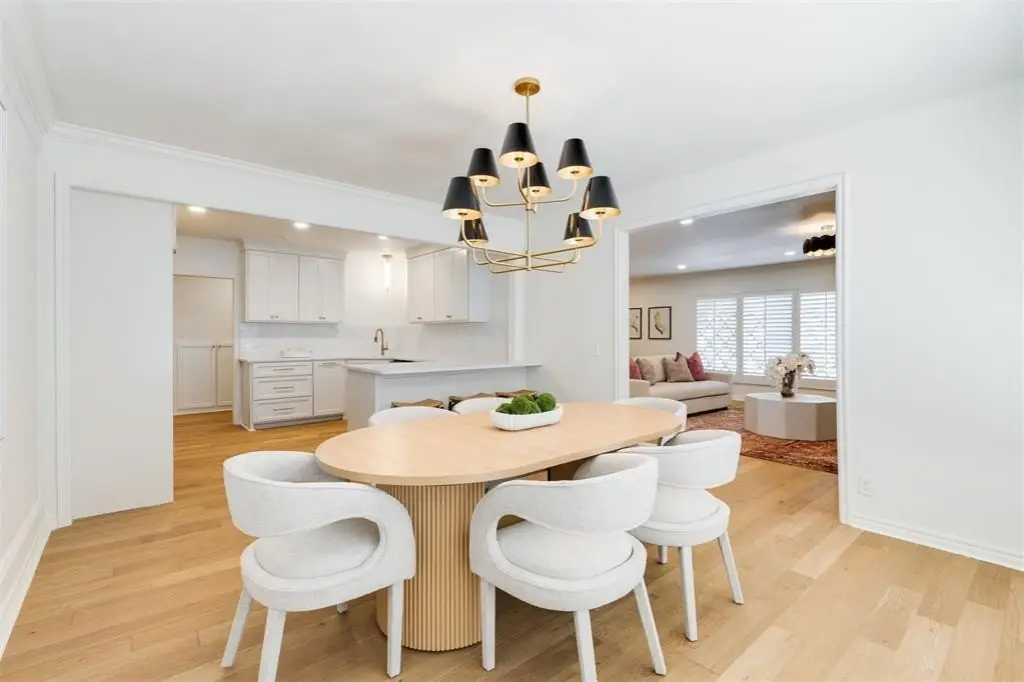
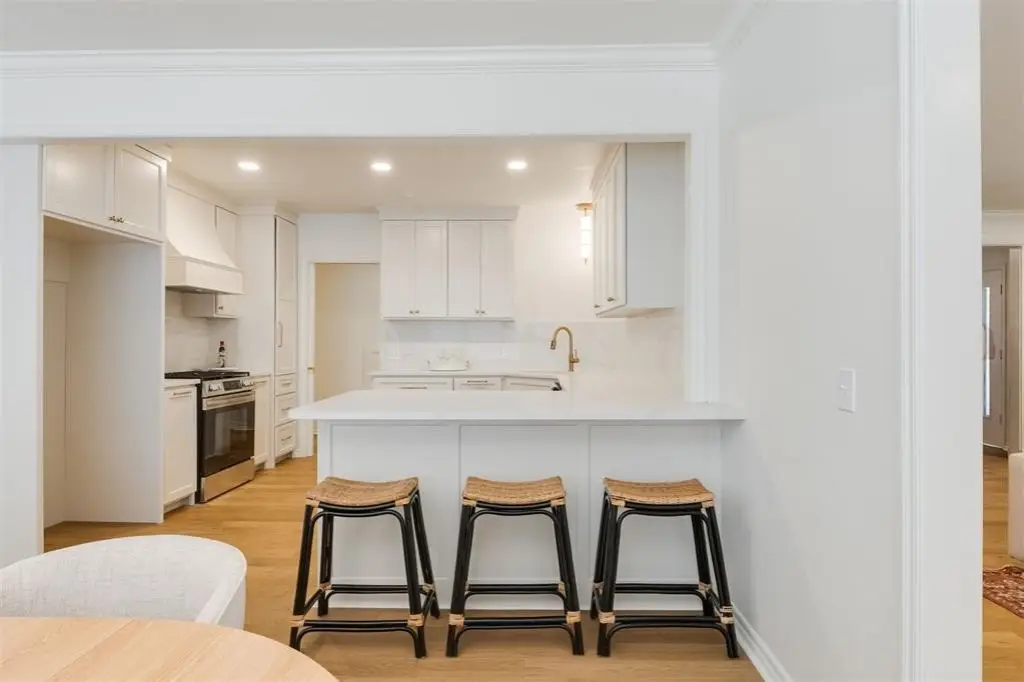
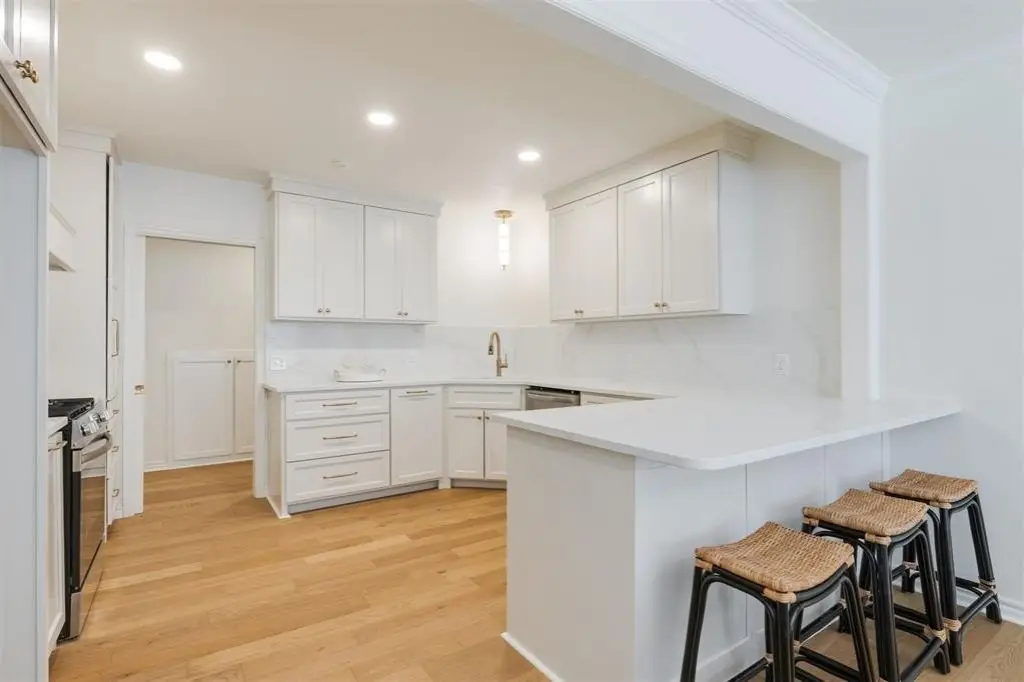
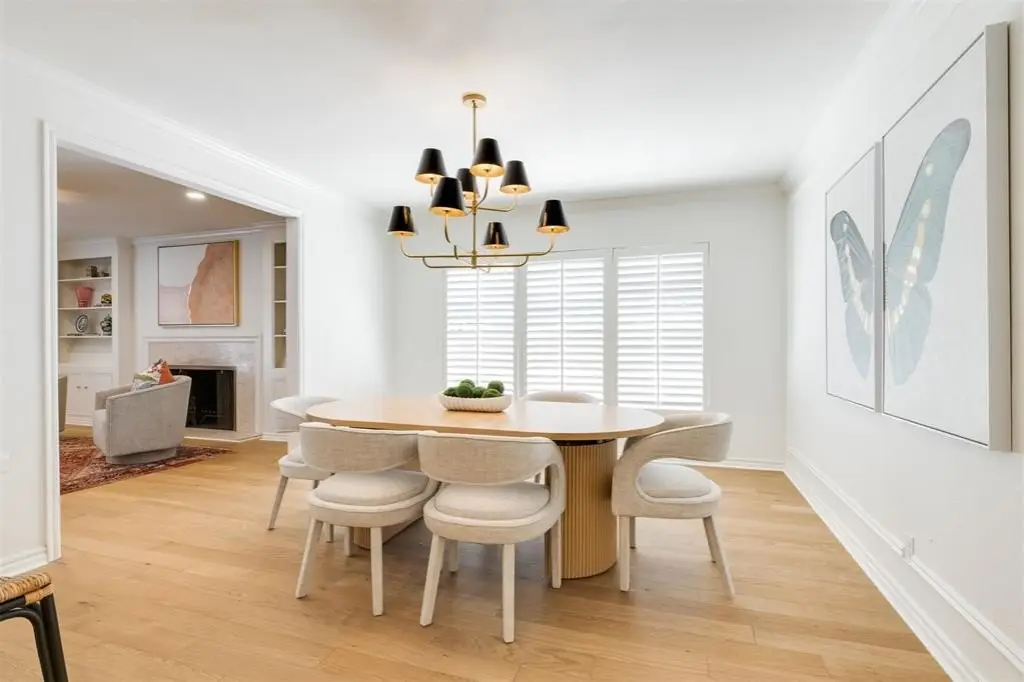
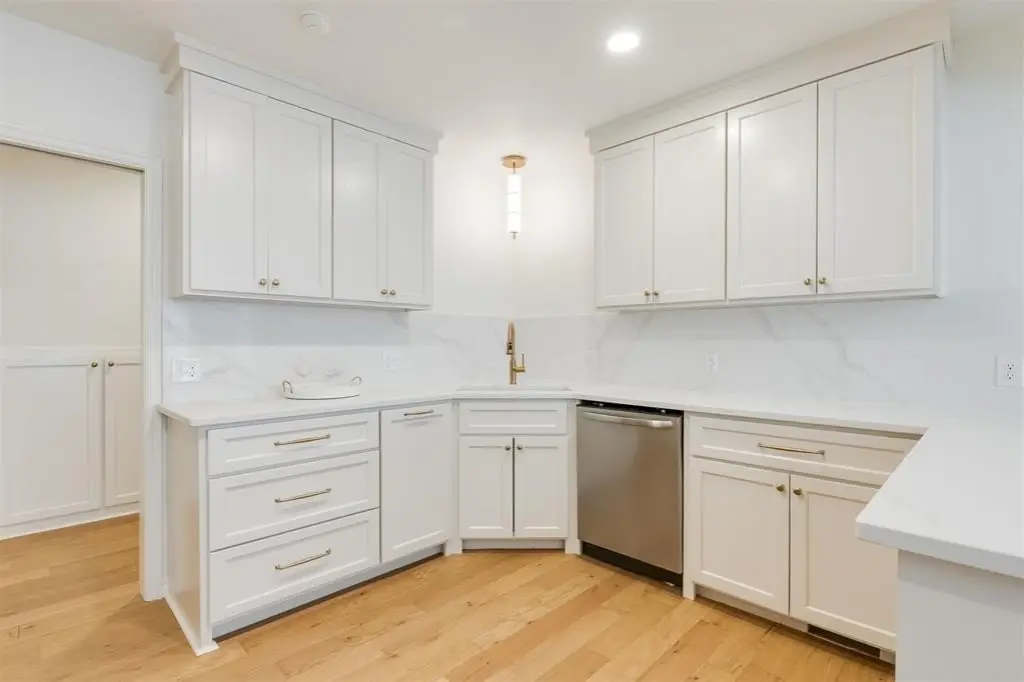
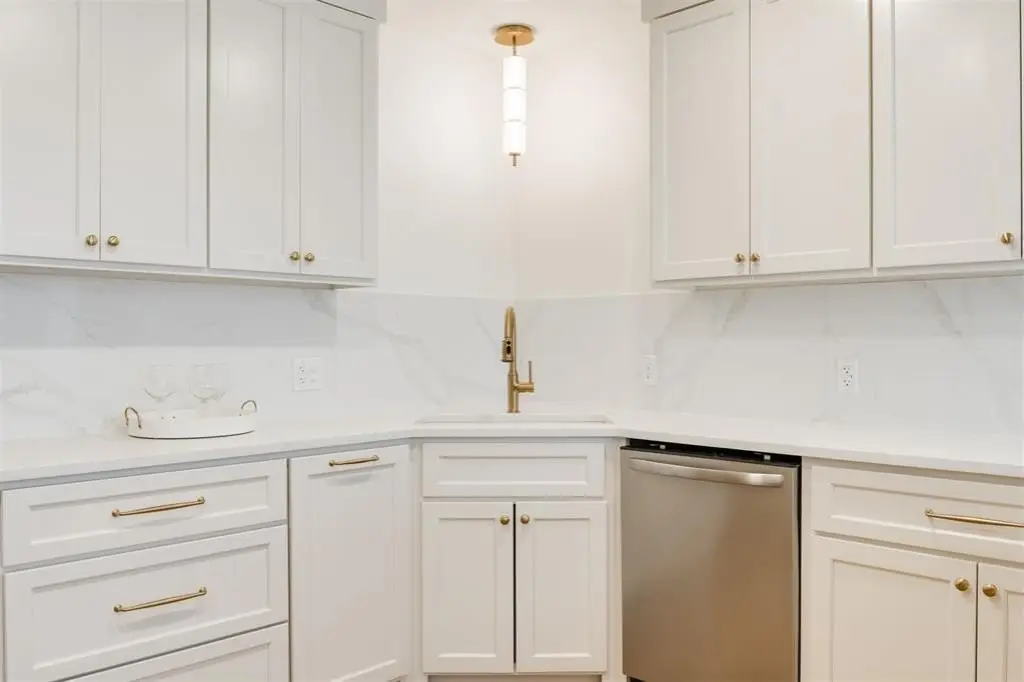
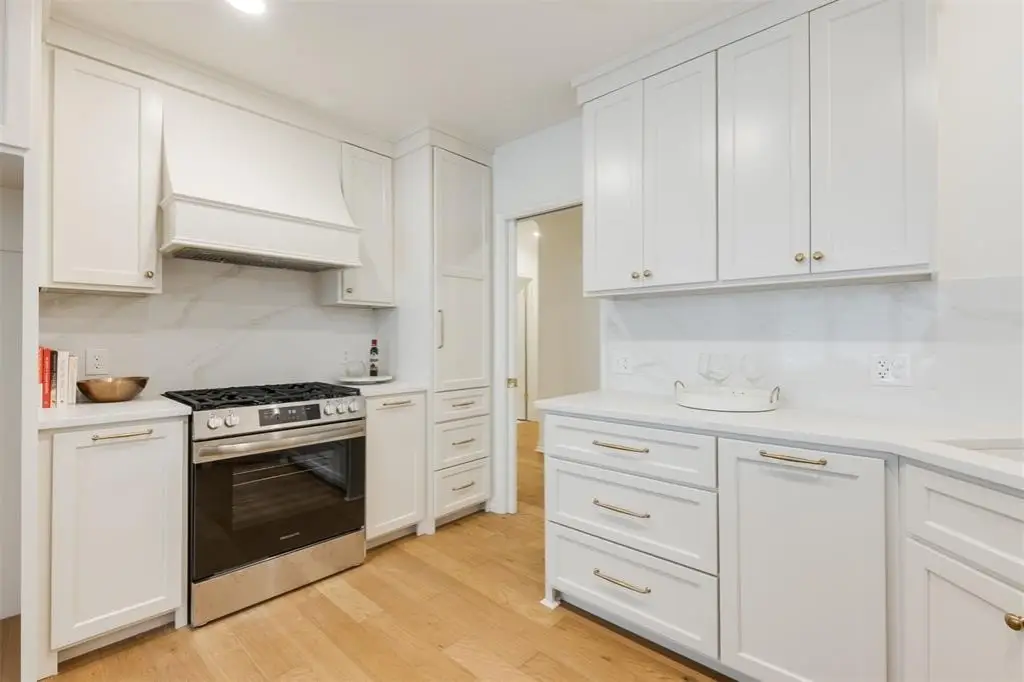
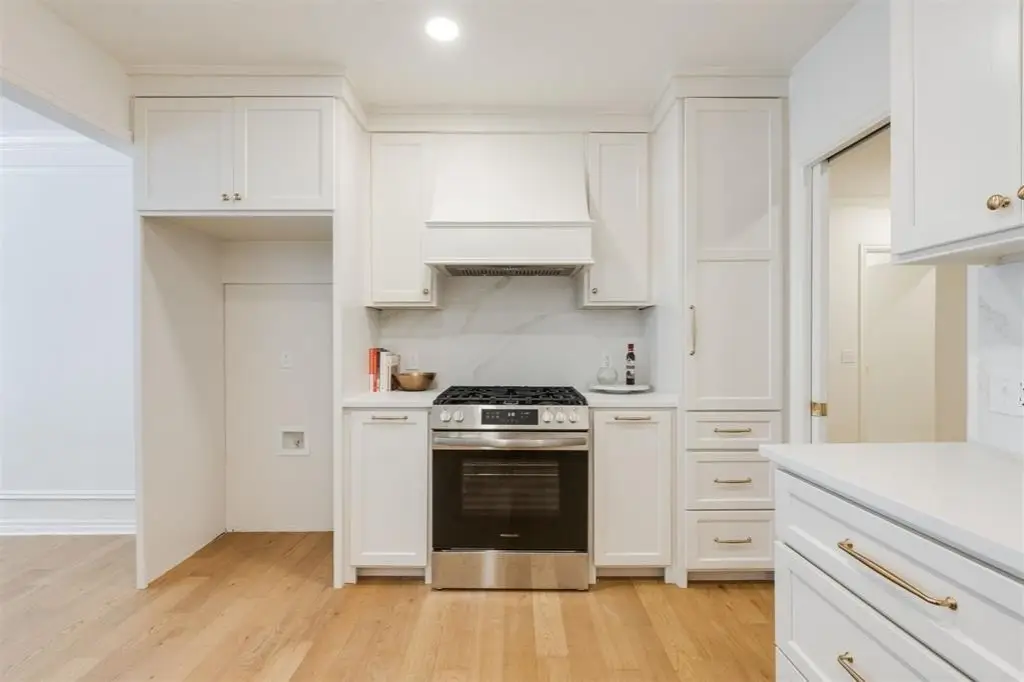
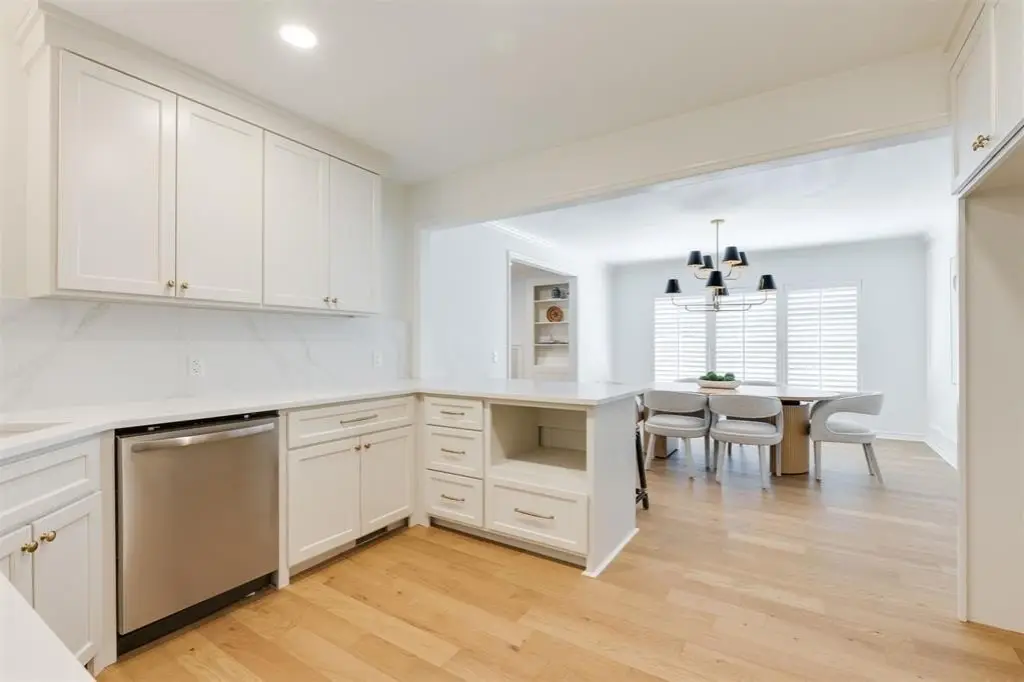
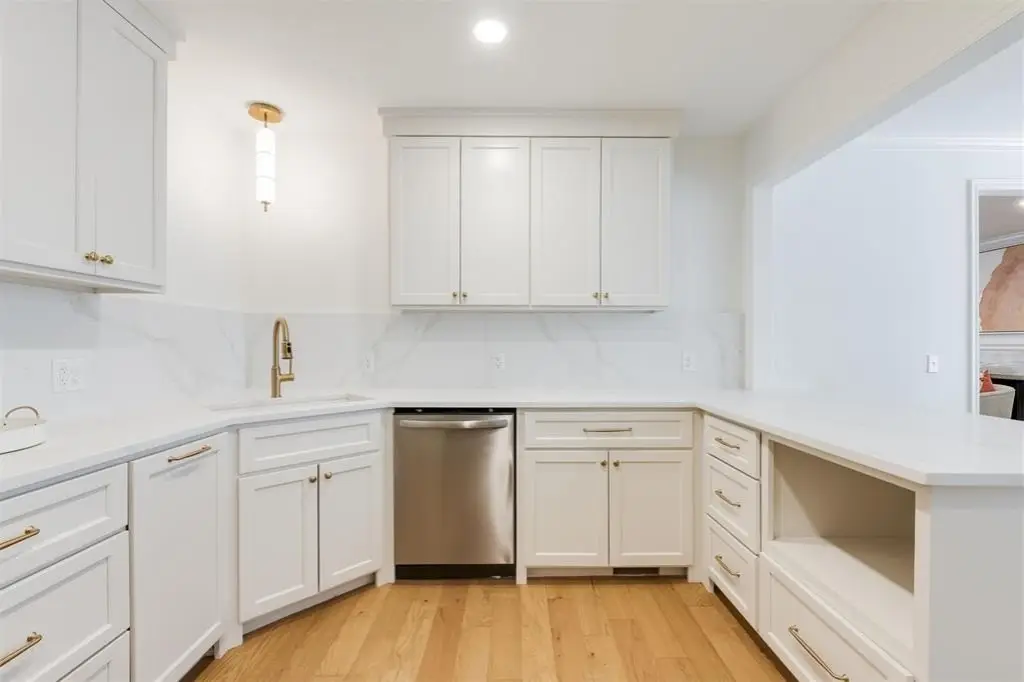
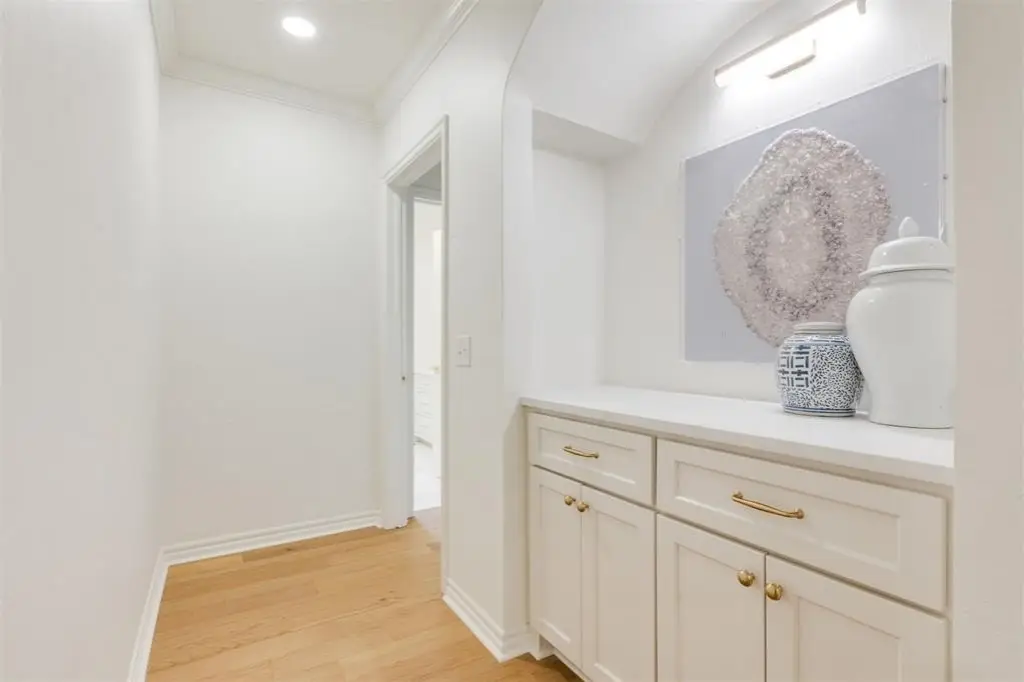
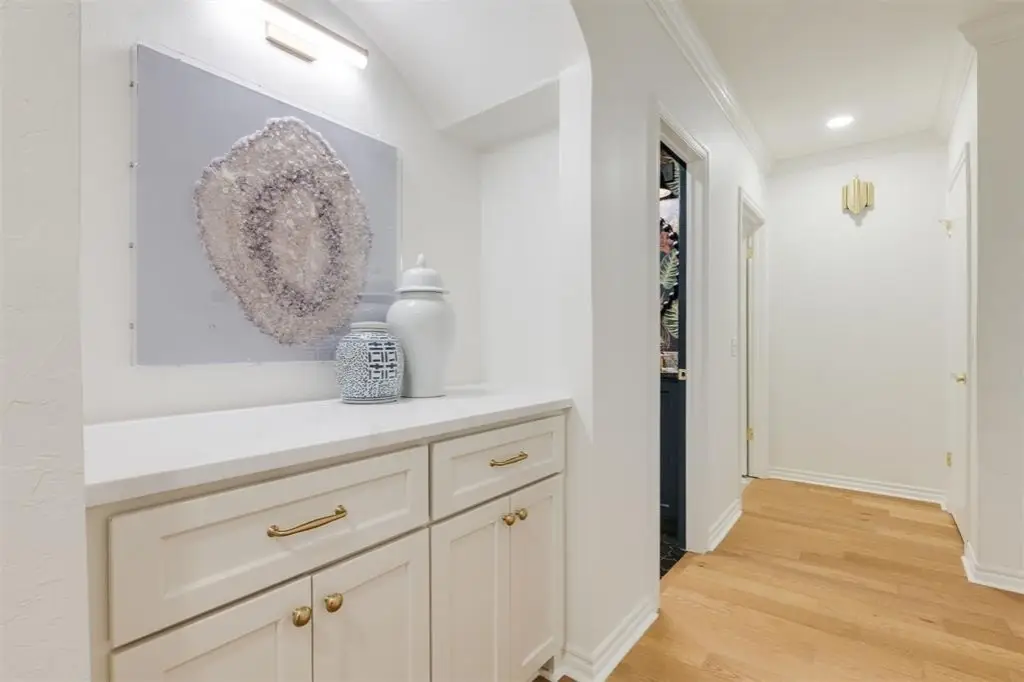
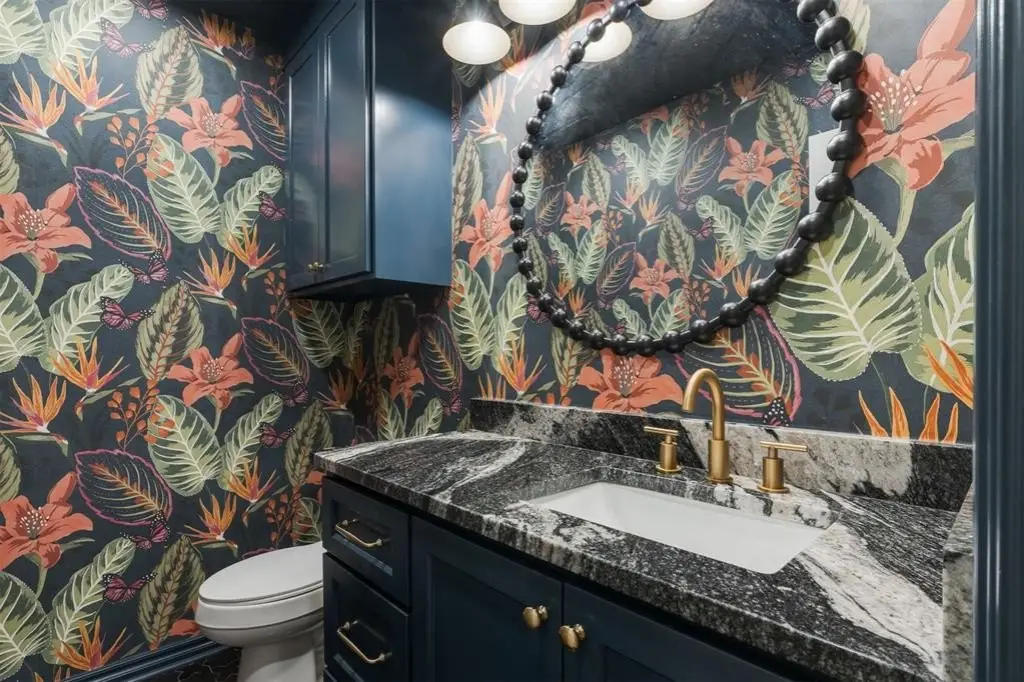
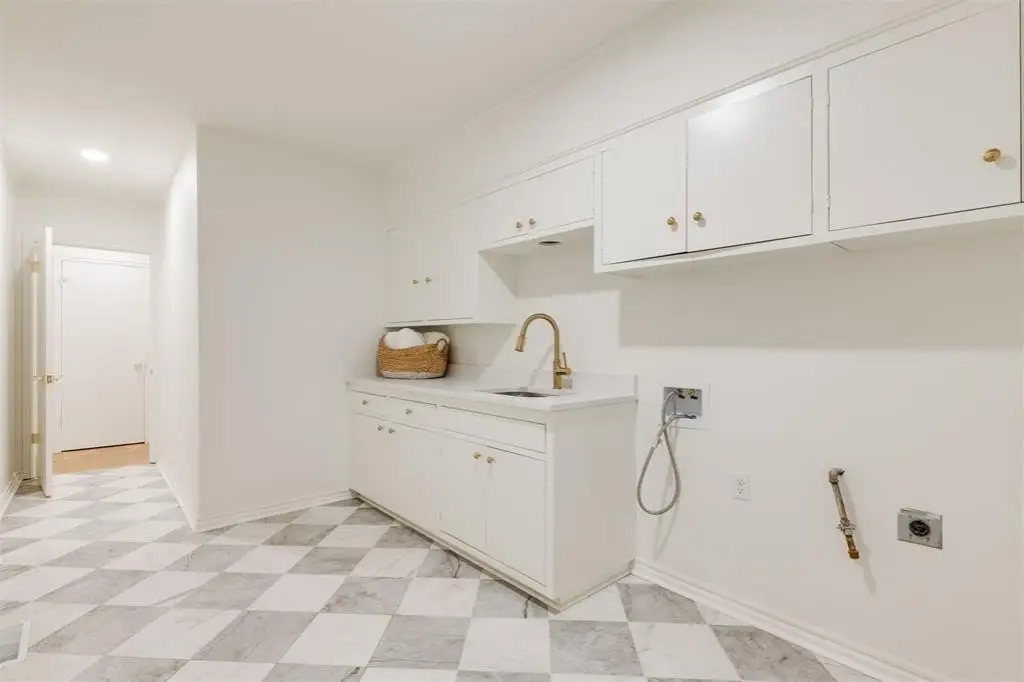
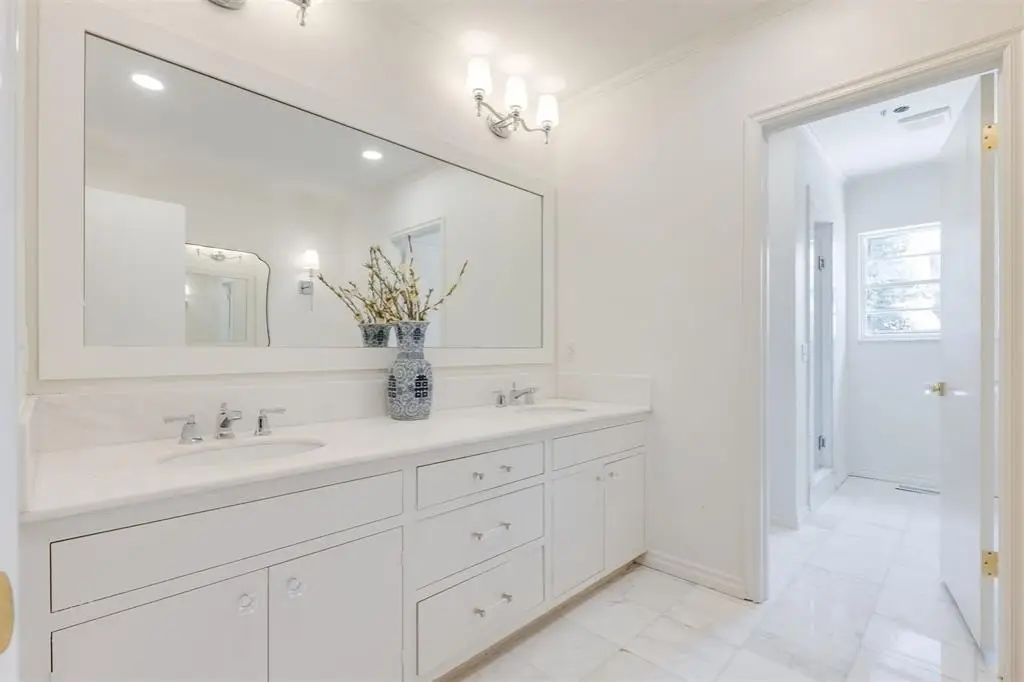
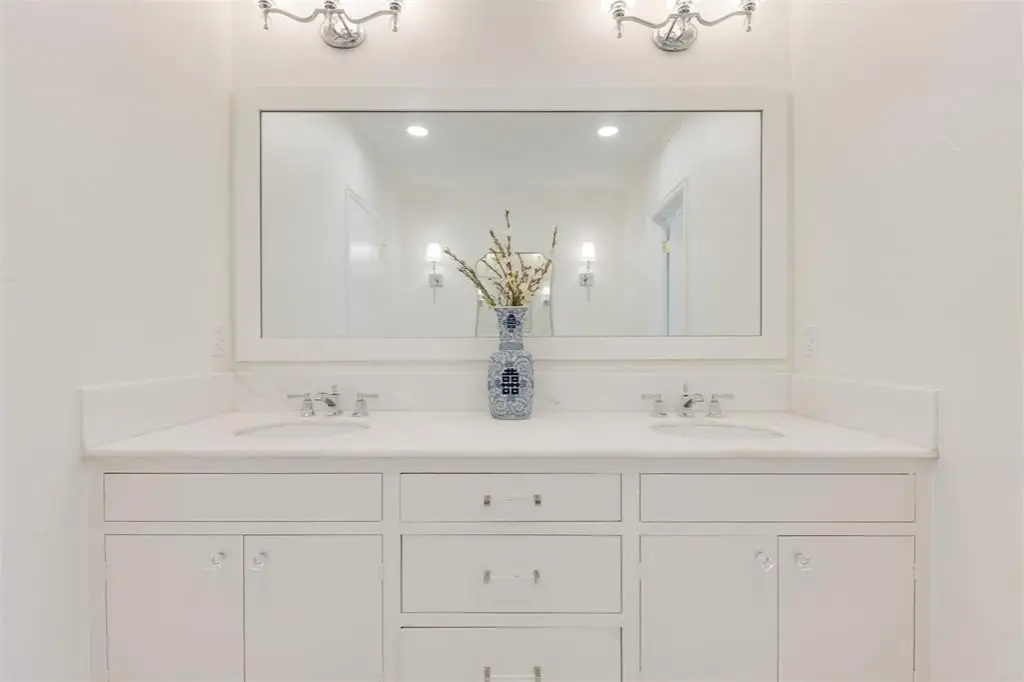
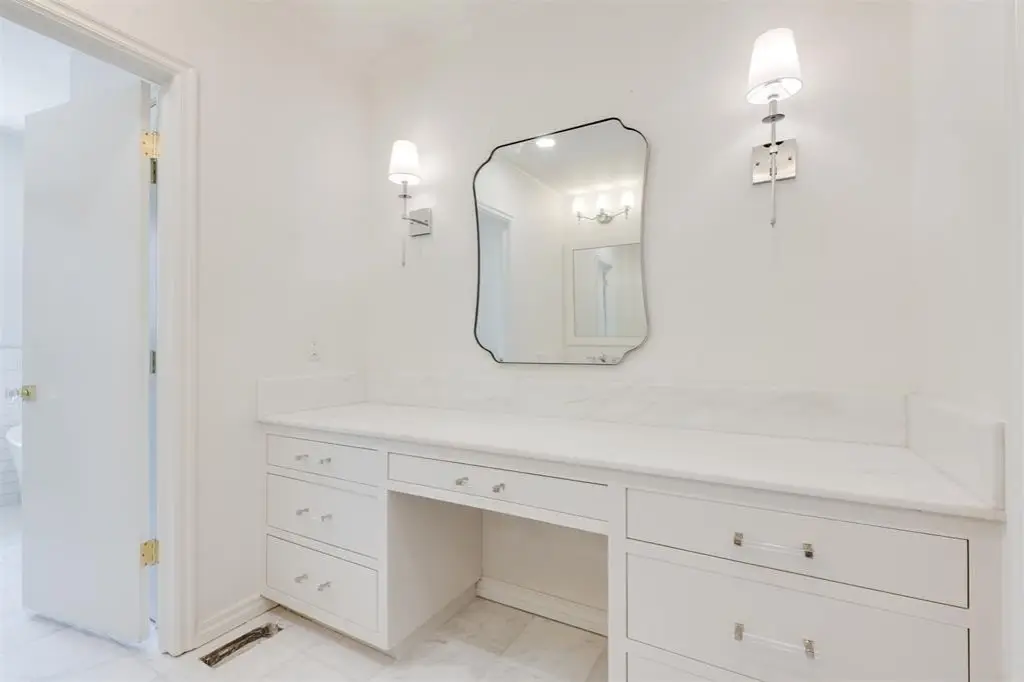
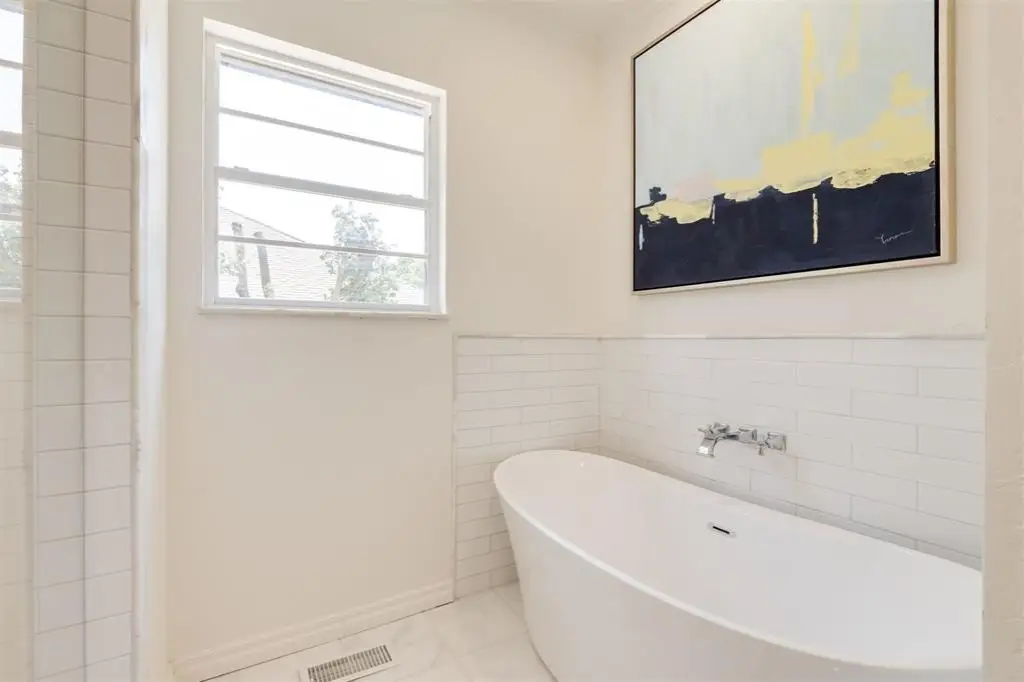
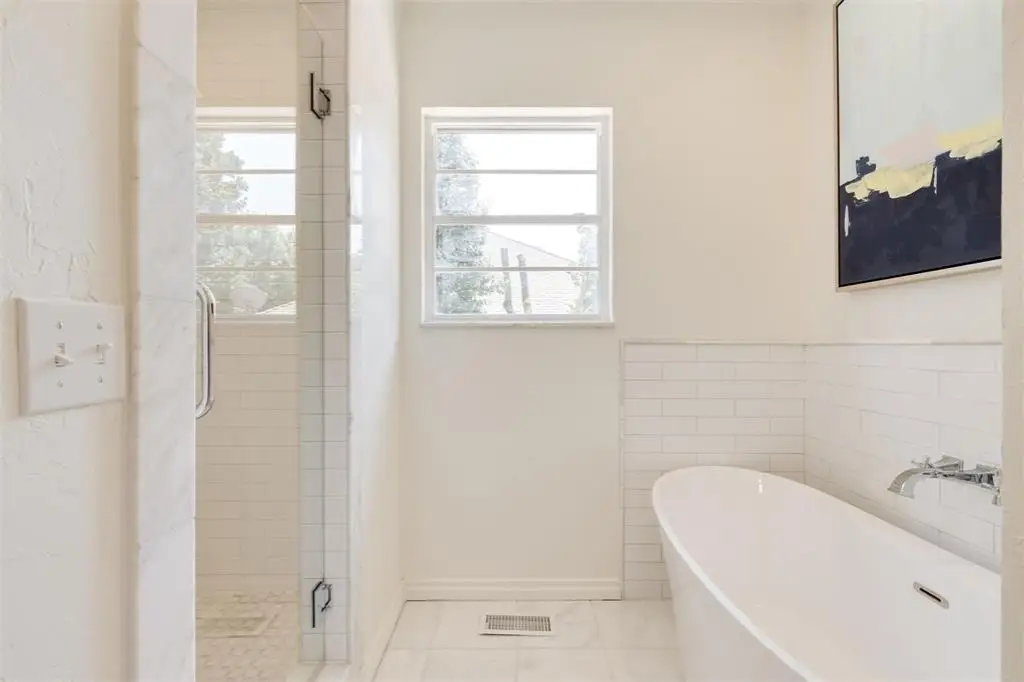
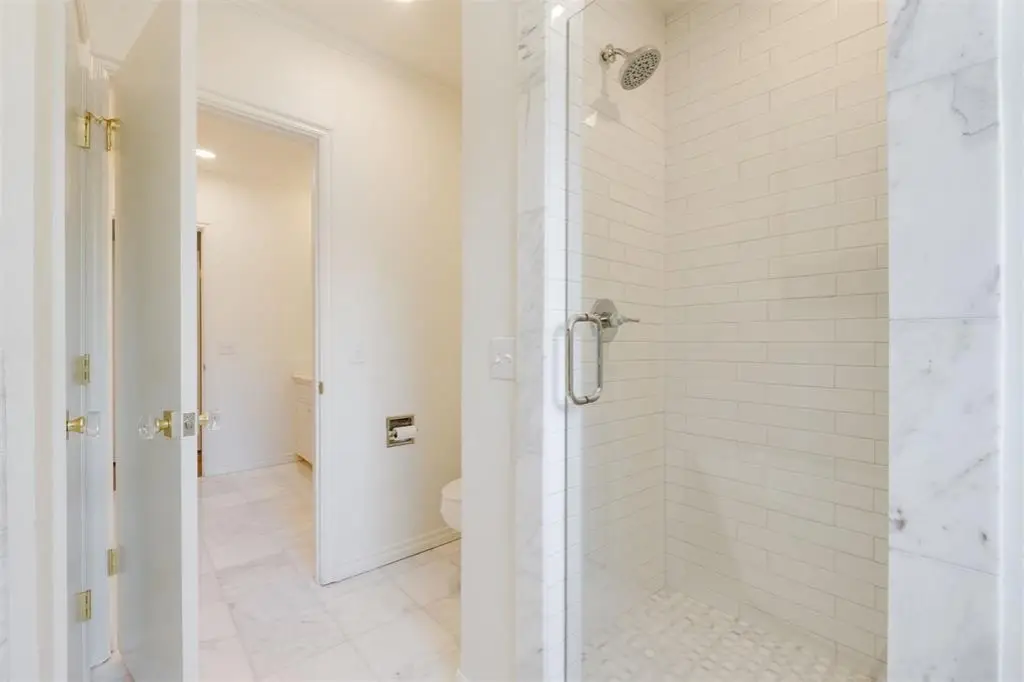
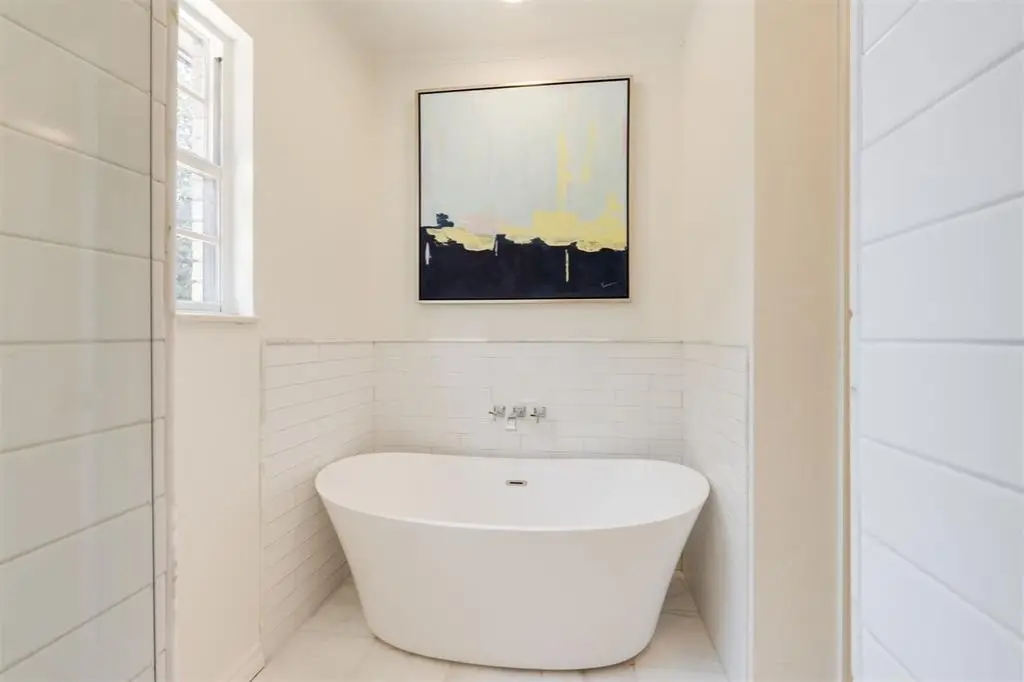
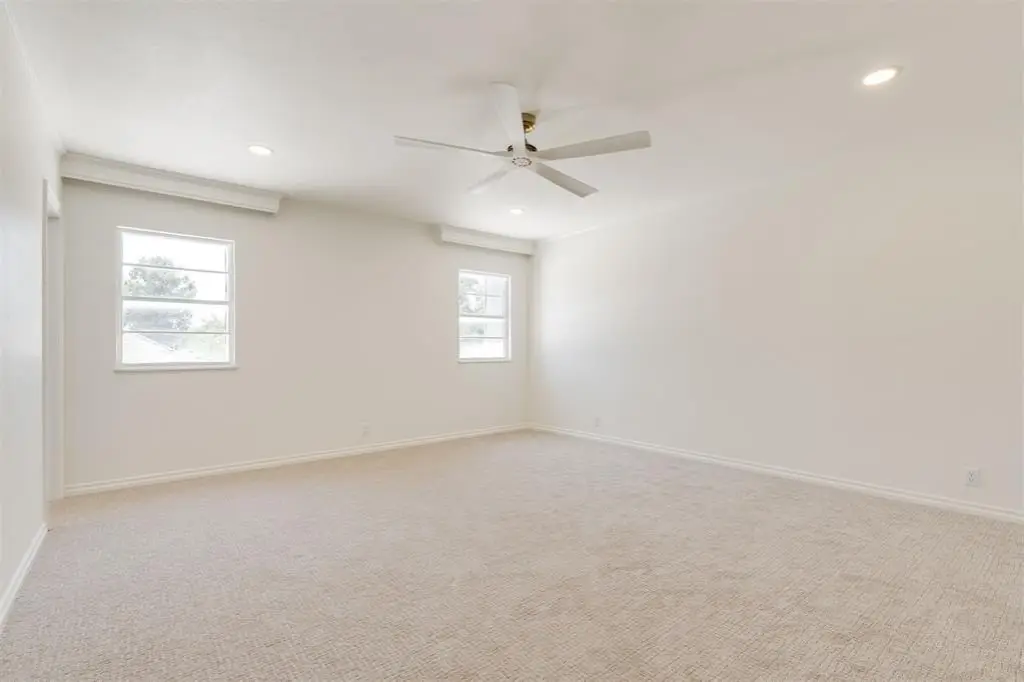
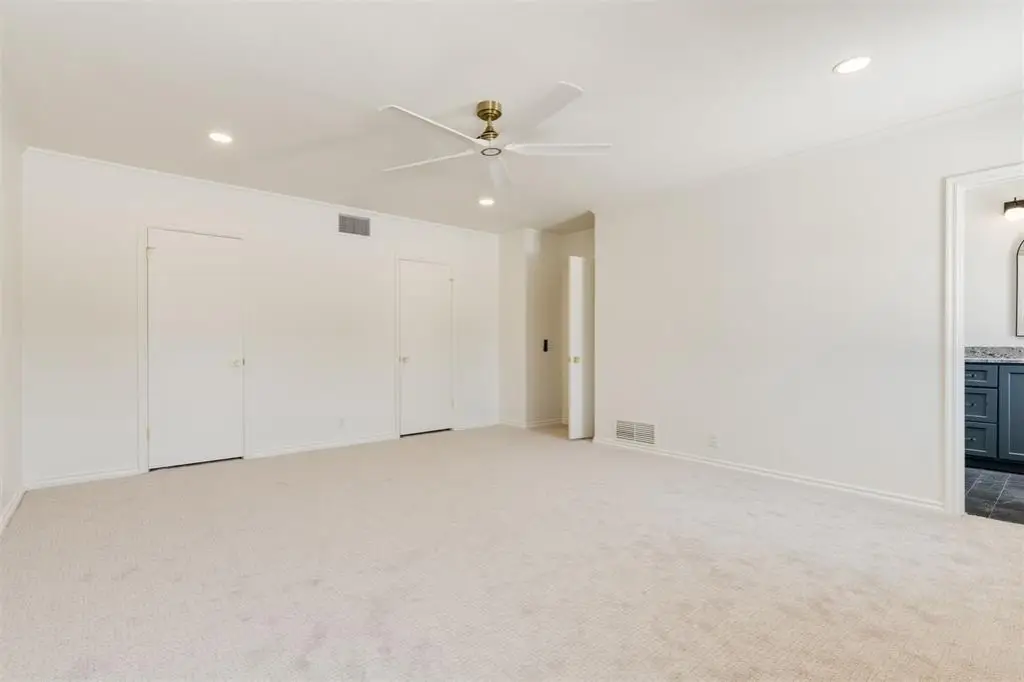
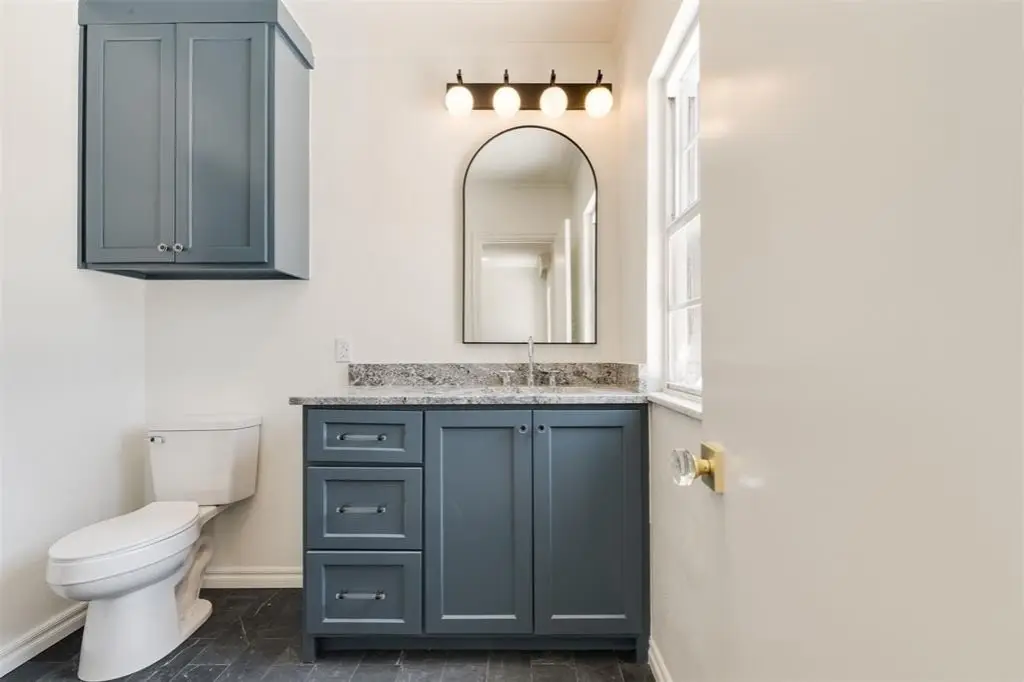
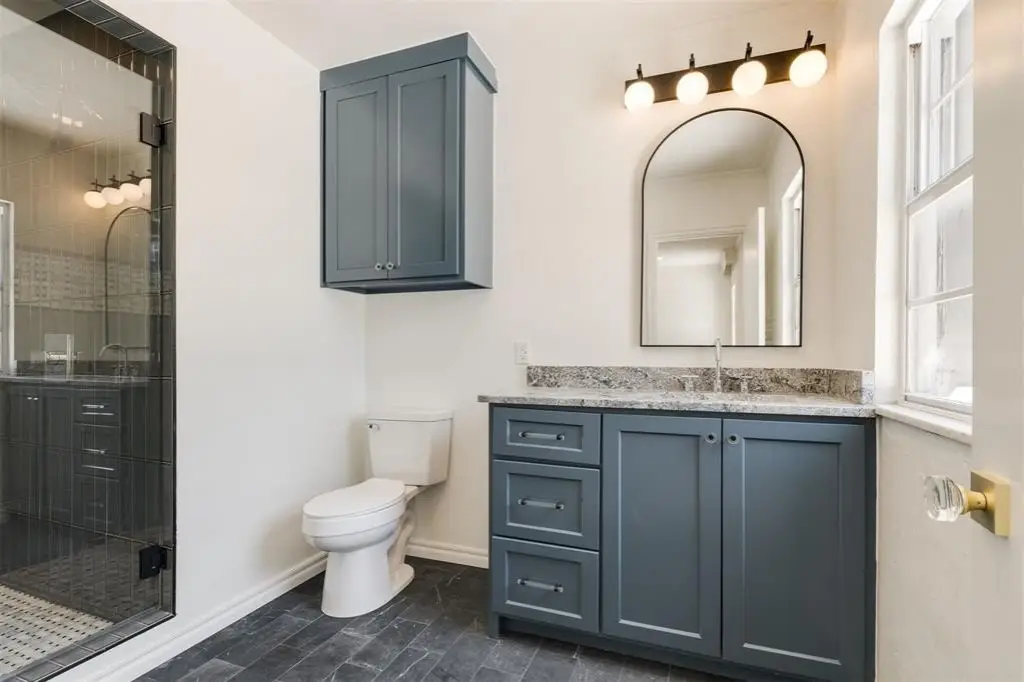
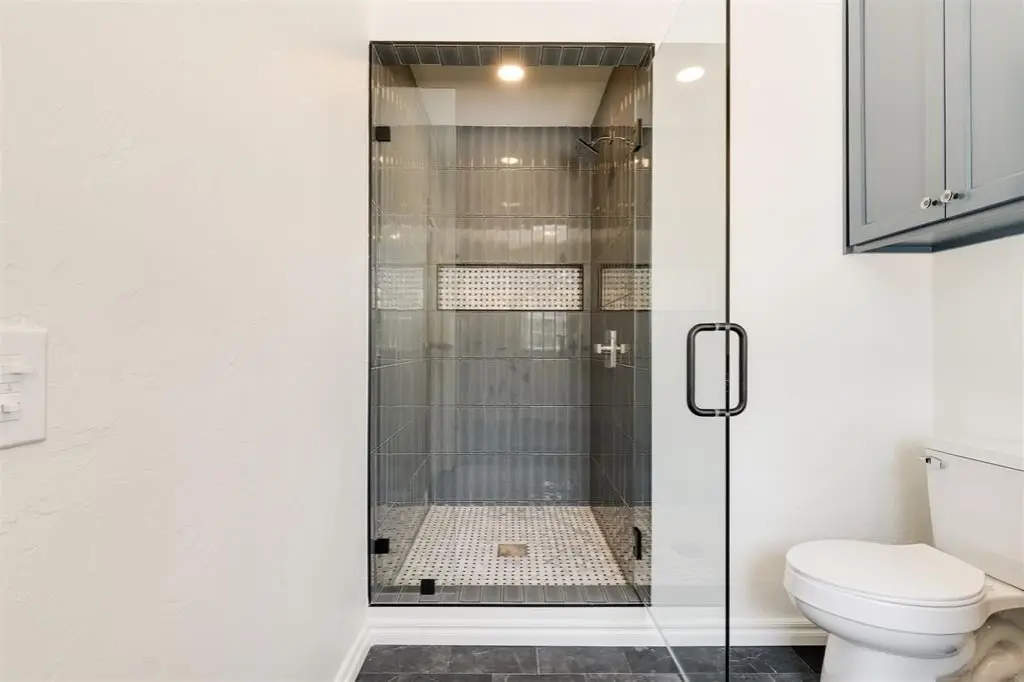
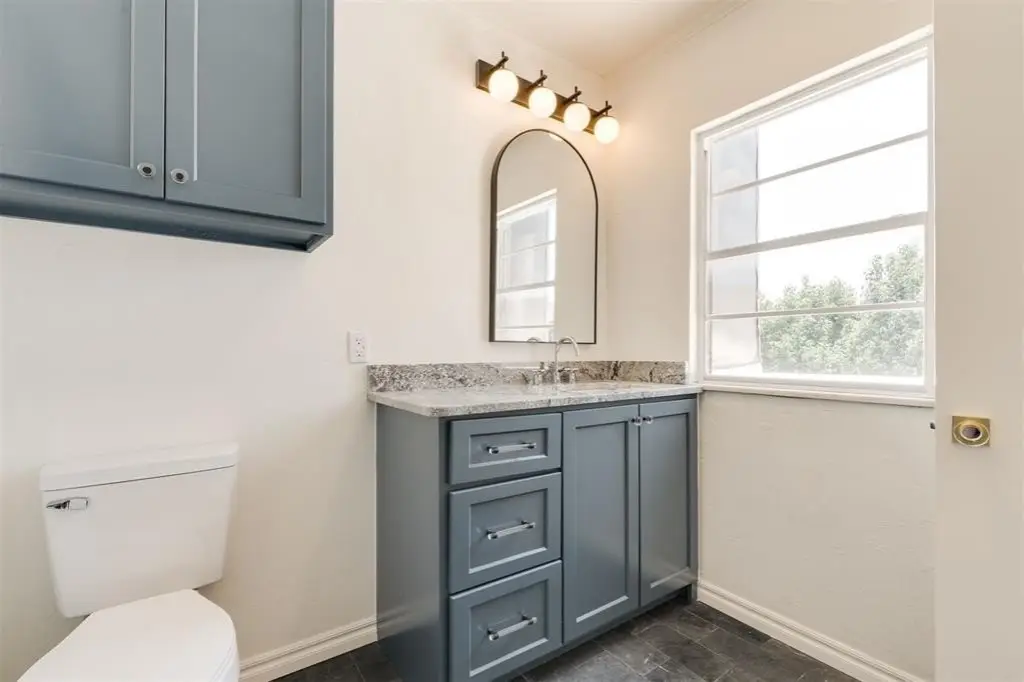
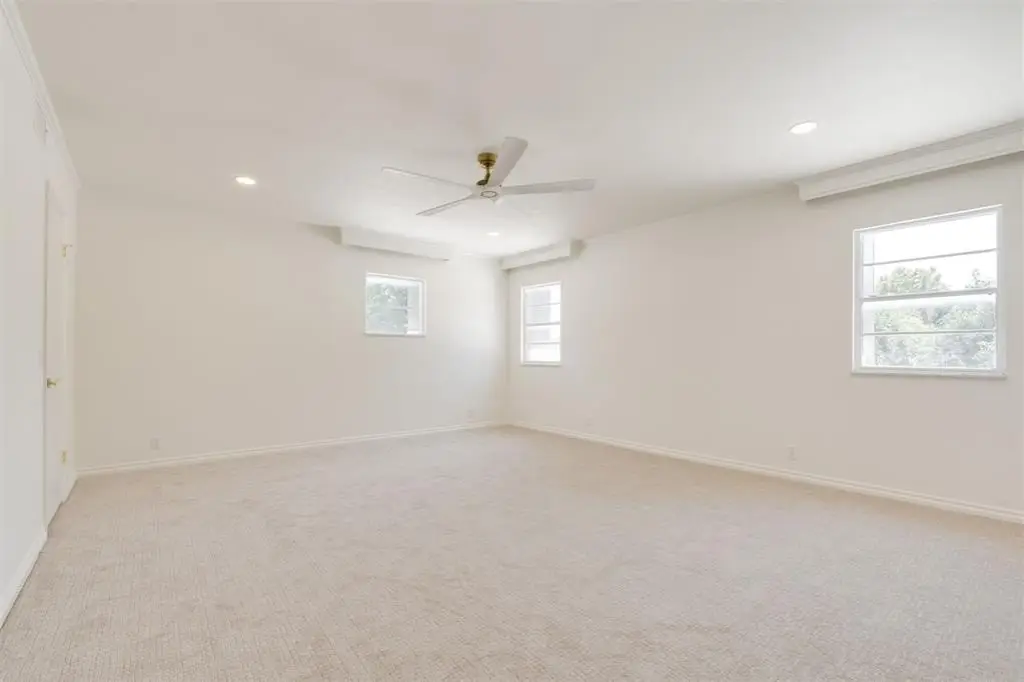
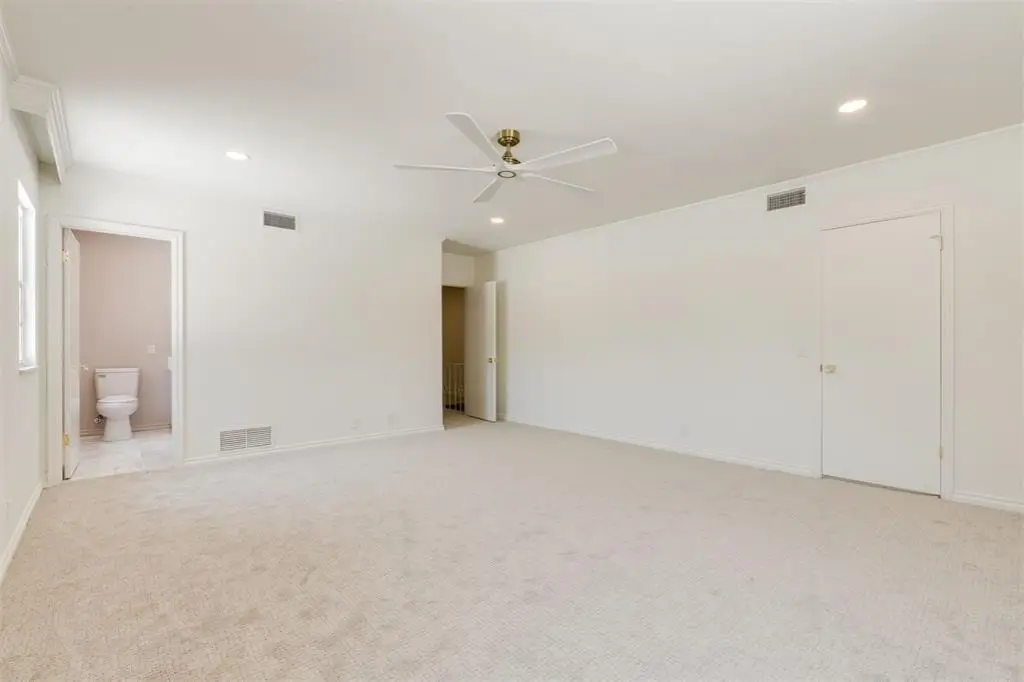
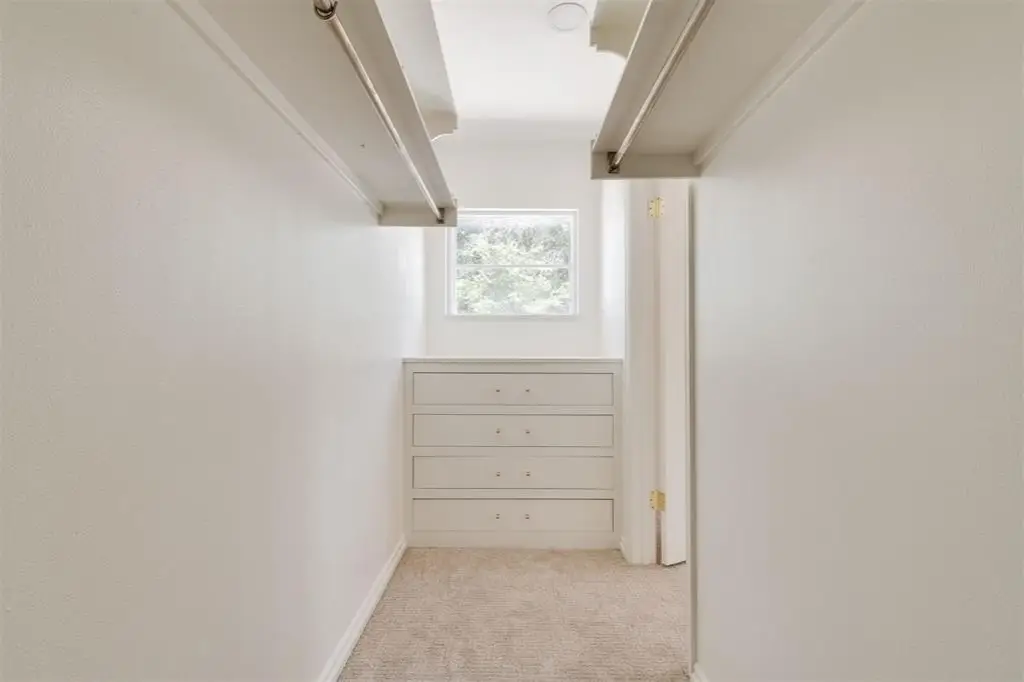
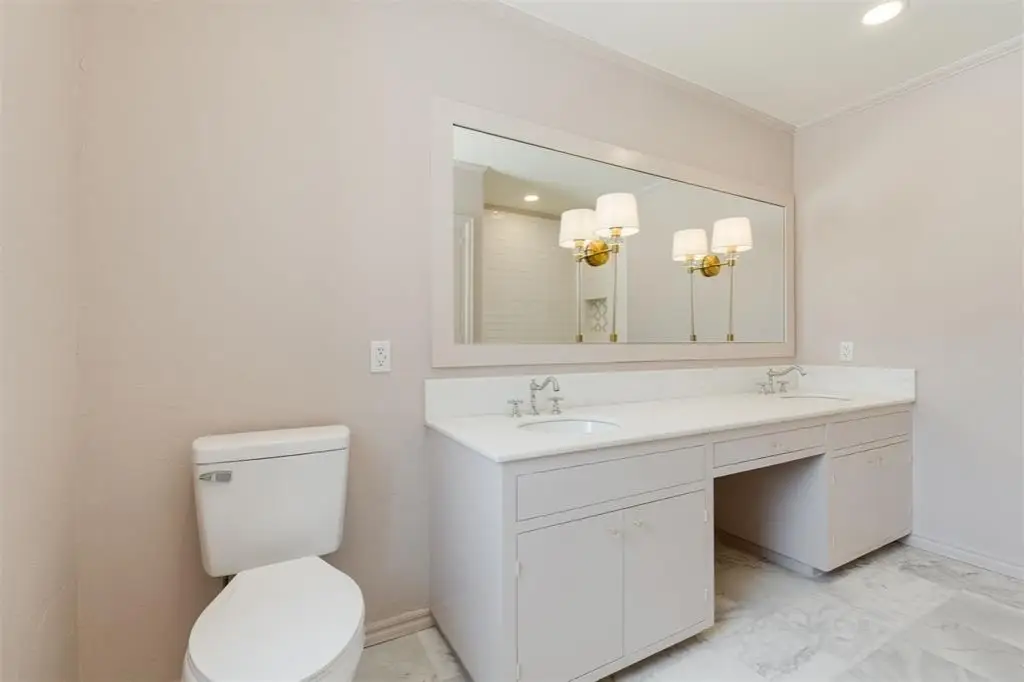
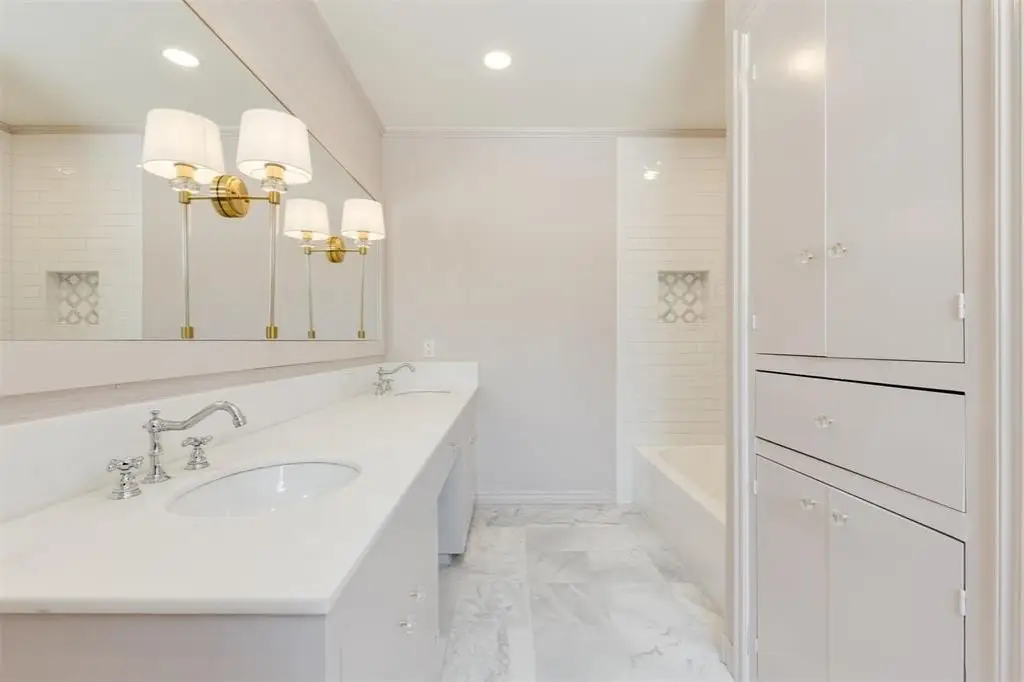
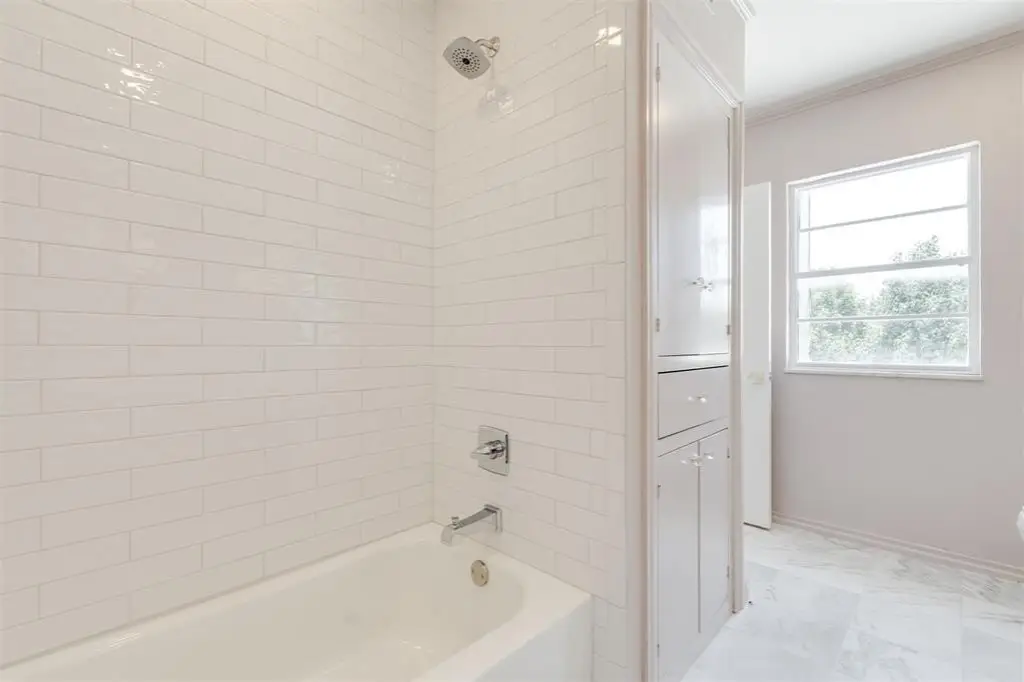
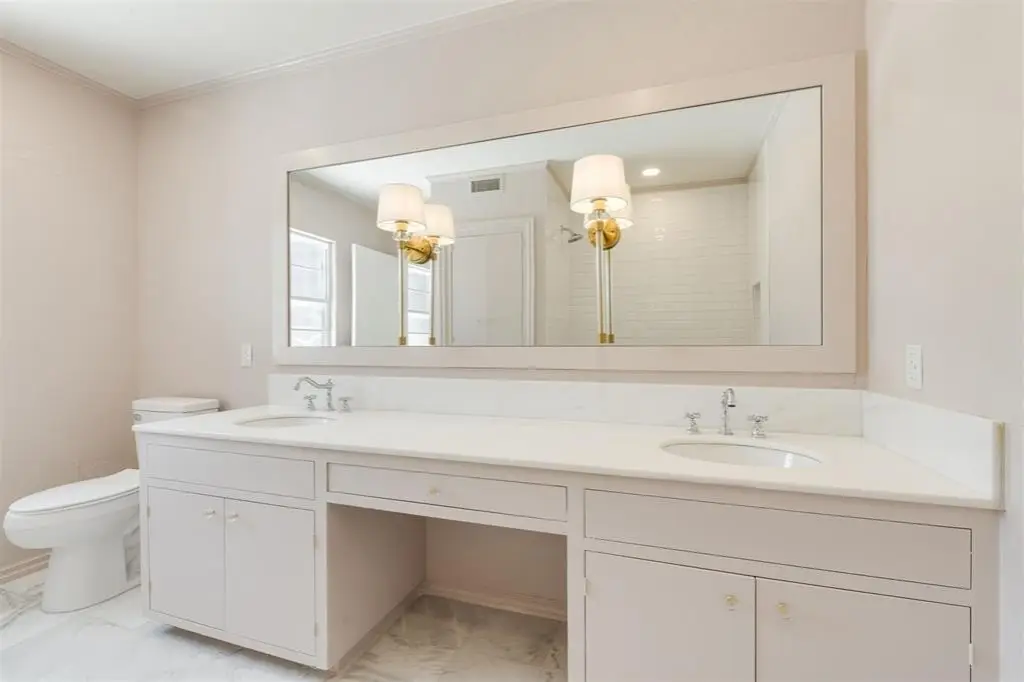
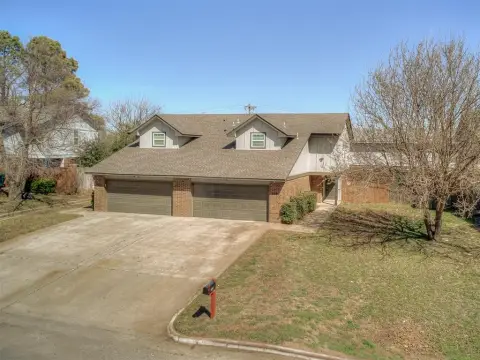
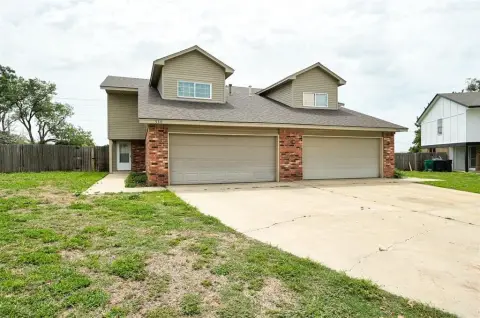
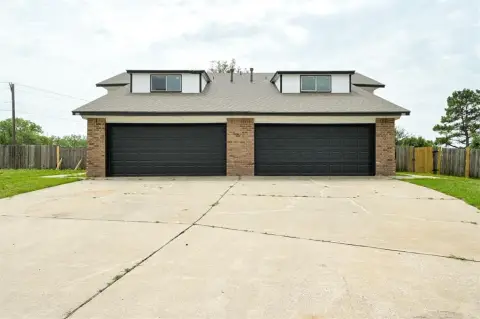
This remodeled duplex residence offers 3,033 square feet with three bedrooms, 3.1 bathrooms, and a layout that gives each bedroom a private en-suite bath. The main level also includes a half bath, while the kitchen combines quartz countertops with custom built-in cabinetry. Marble bathroom surfaces, brick construction, a fireplace, and a patio add to the interior and exterior character. Zoned heating and cooling support comfort throughout the home, and included appliances consist of a dishwasher, disposal, and microwave.
Built in 1970, the property features modern and contemporary design elements alongside a mansard roof and combination flooring. Set within the Glenbrook community in Oklahoma City, it offers access to shopping, dining, medical facilities, and major highways. The 0.155-acre lot and no-yard-maintenance setup support a simplified ownership experience.
Built in 1970, the property features modern and contemporary design elements alongside a mansard roof and combination flooring. Set within the Glenbrook community in Oklahoma City, it offers access to shopping, dining, medical facilities, and major highways. The 0.155-acre lot and no-yard-maintenance setup support a simplified ownership experience.
Key Highlights
- 3,033‑square‑foot duplex with three bedrooms and 3.1 bathrooms
- Each of the three bedrooms includes a private en‑suite bathroom
- 0.155‑acre lot in the Glenbrook community
Financial Insights
Estimated NOI and Cap Rate
NOI / Yr
$27,687
Cap Rate
5.03%
Suggested Prices Based on Cap Rates
Cap Rate 5%
$553,740
$553.7K
Cap Rate 7%
$395,529
$395.5K
Cap Rate 9%
$307,633
$307.6K
Market Conditions
NOI Build-Up for 3,033 SF
Gross rent
$41.9K $13.80/SF
− Vacancy
−$2.3K −$0.76/SF
EGI
$39.6K $13.04/SF
− OpEx
−$11.9K −$3.91/SF
NOI
$27.7K $9.13/SF
Area
Oklahoma City, OK
Vacancy
5.50%
Lease Rate
$13.80 /SF/Yr
Expense Ratio
30.00%
Simulate Cap Rate and NOI
Suggested Prices Based on Cap Rates
Cap Rate 5%
$553,740
Cap Rate 7%
$395,529
Cap Rate 9%
$307,633
Alternative Uses
Best Use
Multifamily LT 5
$395.5K
$346.1K – $461.5K
NOI $27,687 @ 7.0% cap · market cap 5.03%
Second Best
Apartment 5plus
$366.0K
$320.2K – $427.0K
NOI $25,619 @ 7.0% cap · market cap 4.66%
Theoretical Best
Specialty Retail
$1.04M
$907.6K – $1.21M
NOI $72,610 @ 7.0% cap · market cap 13.20%
Zoning and permitted uses should be independently verified with authorities.
Property Analytics
Unlock full access to Insights
Subscribe to Realmo Intelligence
Open Analytics
Current Use
Lease Details
Yes
Highway access
Location Intelligence
Trade Area within ½ mile
639
Businesses Nearby
Explore this area
Business Placement
Demographics for 73118, OK
13,521
Population
7,856
Households
1.7
Avg Household Size
37
Median Age
49%
College-Educated
92%
High-School Grad
4.8 sq mi
ZIP Area
2,817
Density / Sq Mi
$69,321
Median Household Income
$45,494
Median Earnings
$1,064
Median Rent
$252,500
Median Home Value
Check the figures for this property
Cap Rate, Value Estimation, Potential NOI and more
View Realmo Analytics
Market
Vacancy Rate% for Multifamily in South region

Questions? Ask Rey
Realmo’s AI knows this listing — price, zoning, demand, history. Ask anything.



Frequently Asked Questions
What type of property is this?
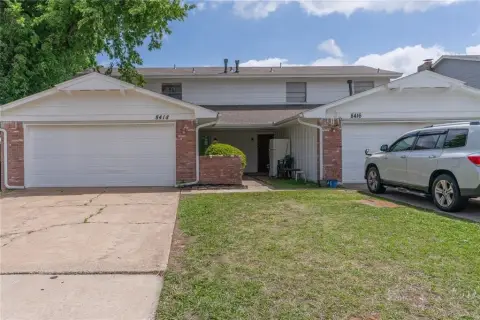
Duplex - Updated duplex residence with contemporary finishes, zoned climate control, a patio, and a low-maintenance exterior.
Where is this duplex located?
The property is located at 6341 Glenbrook Court Oklahoma City, OK.
What is the asking price?
The asking price for this property is $549,900.
What are key features of this property?
This property features: 3,033‑square‑foot duplex with three bedrooms and 3.1 bathrooms; Each of the three bedrooms includes a private en‑suite bathroom; 0.155‑acre lot in the Glenbrook community