Updated Multifamily Income
For Sale
Contact for pricing
Pending
911 NW 12th Avenue # 2 #1-2, Fort Lauderdale, FL 33311
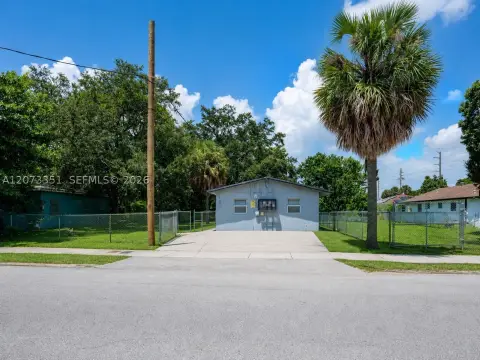
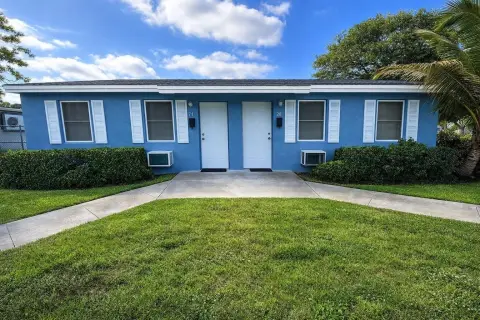
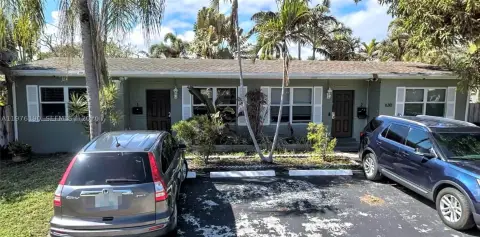
Well-maintained, updated multifamily building with in-place tenants, located just off Sunrise Blvd in a stable neighborhood.
Property Size1,071 SF
Days on Market284
Property Features for 911 NW 12th Avenue # 2 #1-2
General Information
Standard status
Pending
Size
1,071 SF
Property subtype
Multifamily
Zoning
RMM-25
Building Details
Year Built
1953
Units
2
Listing Agency:
Dynasty Realty Group Inc
Listed By:
Robert Piccolo · License #FL
(954) 776-4175
Source:
Crexi
Added: Dec 29, 2025
Changed: Oct 4
Last Checked: Oct 7 at 12:44PM
Displayed information is deemed reliable but is not guaranteed and should be independently verified. All listing content including descriptions, pricing, images are the copyrighted material of Dynasty Realty Group Inc
Investment Insights
Based on property information with market context.
This for-sale multifamily income property is described as being in very good condition and “all updated.” The offering includes a residential multifamily building designed to generate rental income with existing tenants in place. The public remarks indicate the property has received updates, supporting a turnkey feel for a buyer who wants a maintained asset rather than a deferred-maintenance project.
The property is located just off Sunrise Blvd in a nice, working neighborhood. That setting is reflected in the remarks as stable and tenant-occupied, with the building referenced as having excellent tenants. While the exact street frontage and specific access details are not provided, the location positioning “just off” a major boulevard typically supports convenient day-to-day travel for residents.
For buyers or owner-operators looking at residential income properties, the combination of a well-kept building and updated condition can simplify near-term planning. With tenants already in place, the property may suit an investor seeking an income-producing multifamily asset without requiring immediate comprehensive renovations, subject to standard due diligence on existing leases and physical condition.
The property is located just off Sunrise Blvd in a nice, working neighborhood. That setting is reflected in the remarks as stable and tenant-occupied, with the building referenced as having excellent tenants. While the exact street frontage and specific access details are not provided, the location positioning “just off” a major boulevard typically supports convenient day-to-day travel for residents.
For buyers or owner-operators looking at residential income properties, the combination of a well-kept building and updated condition can simplify near-term planning. With tenants already in place, the property may suit an investor seeking an income-producing multifamily asset without requiring immediate comprehensive renovations, subject to standard due diligence on existing leases and physical condition.
Key Highlights
- Multifamily building built in 1953
- Well‑maintained building in very good condition
- Updated multifamily property
Financial Insights
Estimated NOI and Cap Rate
NOI / Yr
$16,082
Cap Rate
3.92%
Suggested Prices Based on Cap Rates
Cap Rate 5%
$321,640
$321.6K
Cap Rate 7%
$229,743
$229.7K
Cap Rate 9%
$178,689
$178.7K
Market Conditions
NOI Build-Up for 1,071 SF
Gross rent
$30.8K $28.80/SF
− Vacancy
−$1.6K −$1.50/SF
EGI
$29.2K $27.30/SF
− OpEx
−$13.2K −$12.29/SF
NOI
$16.1K $15.02/SF
Area
Fort Lauderdale, FL
Vacancy
5.20%
Lease Rate
$28.80 /SF/Yr
Expense Ratio
45.00%
Simulate Cap Rate and NOI
Suggested Prices Based on Cap Rates
Cap Rate 5%
$321,640
Cap Rate 7%
$229,743
Cap Rate 9%
$178,689
Alternative Uses
Best Use
Apartment 5plus
$229.7K
$201.0K – $268.0K
NOI $16,082 @ 7.0% cap · market cap 3.92%
Second Best
—
—
no second resolved use
Theoretical Best
Office A
$719.7K
$629.8K – $839.7K
NOI $50,380 @ 7.0% cap · market cap 12.29%
Zoning and permitted uses should be independently verified with authorities.
Property Analytics
Unlock full access to Insights
Subscribe to Realmo Intelligence
Open Analytics
Current Use
Location Intelligence
Trade Area within ½ mile
1,268
Businesses Nearby
Explore this area
Business Placement
Demographics for 33311, FL
69,413
Population
27,330
Households
2.5
Avg Household Size
37
Median Age
18%
College-Educated
81%
High-School Grad
10.4 sq mi
ZIP Area
6,674
Density / Sq Mi
$51,918
Median Household Income
$32,717
Median Earnings
$1,385
Median Rent
$276,600
Median Home Value
Check the figures for this property
Cap Rate, Value Estimation, Potential NOI and more
View Realmo Analytics
Market
Vacancy Rate% for Multifamily in South region

Questions? Ask Rey
Realmo’s AI knows this listing — price, zoning, demand, history. Ask anything.



Frequently Asked Questions
What type of property is this?
Multifamily property - Well-maintained, updated multifamily building with in-place tenants, located just off Sunrise Blvd in a stable neighborhood.
Where is this multifamily property located?
The property is located at 911 NW 12th Avenue # 2 #1-2 Fort Lauderdale, FL.
What is the asking price?
The asking price for this property is $410,000.
What are key features of this property?
This property features: Multifamily building built in 1953; Well‑maintained building in very good condition; Updated multifamily property


