Service Garage with Drive-In
9100 W BEAVER Street Jacksonville, FL 32220
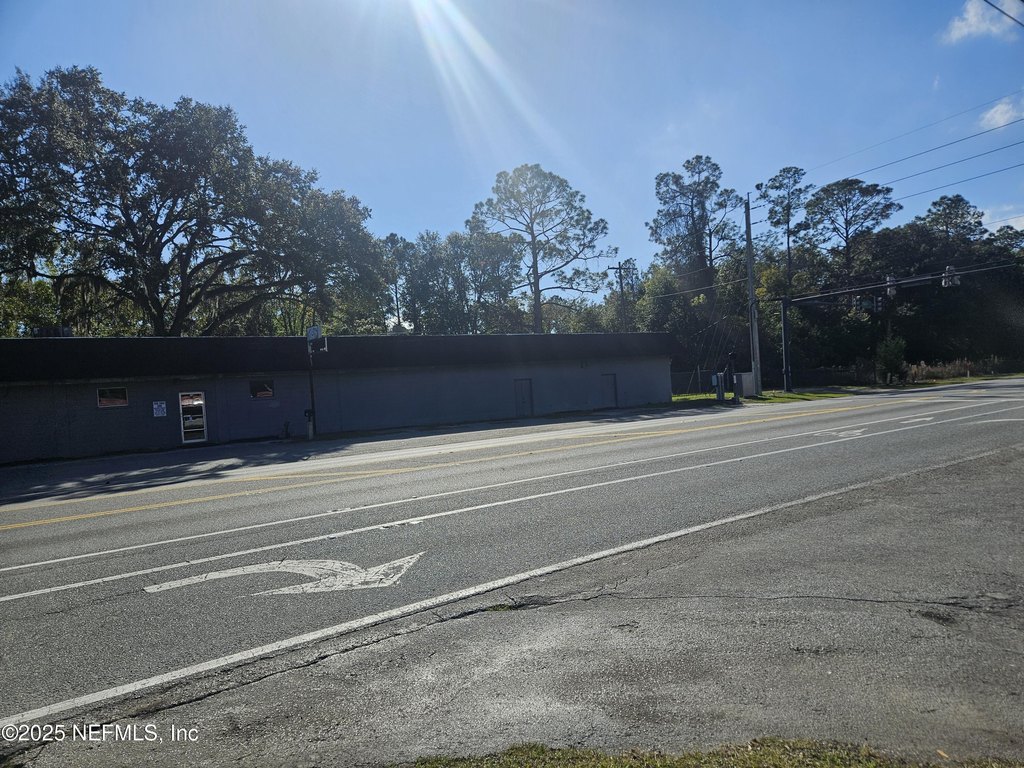
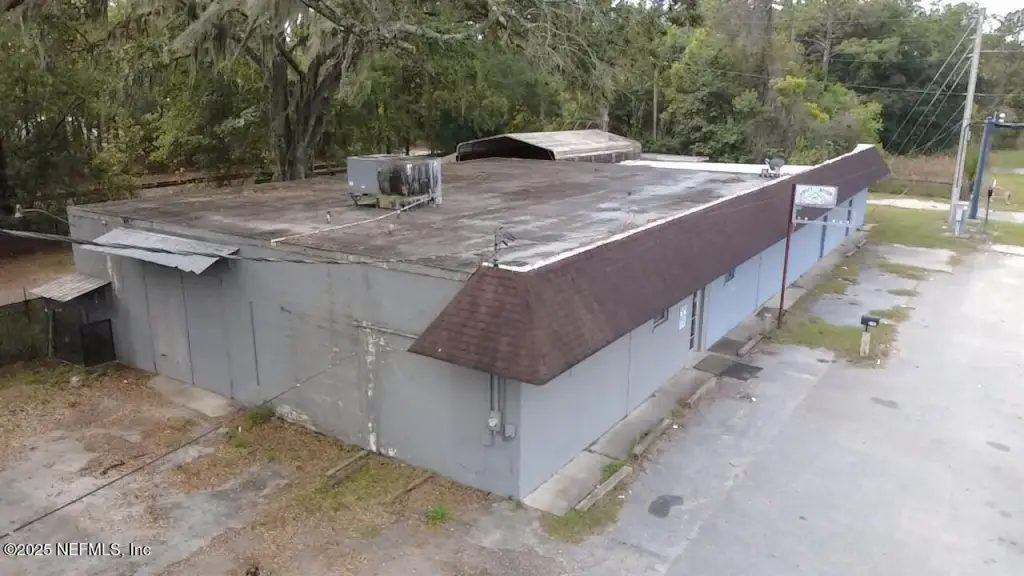
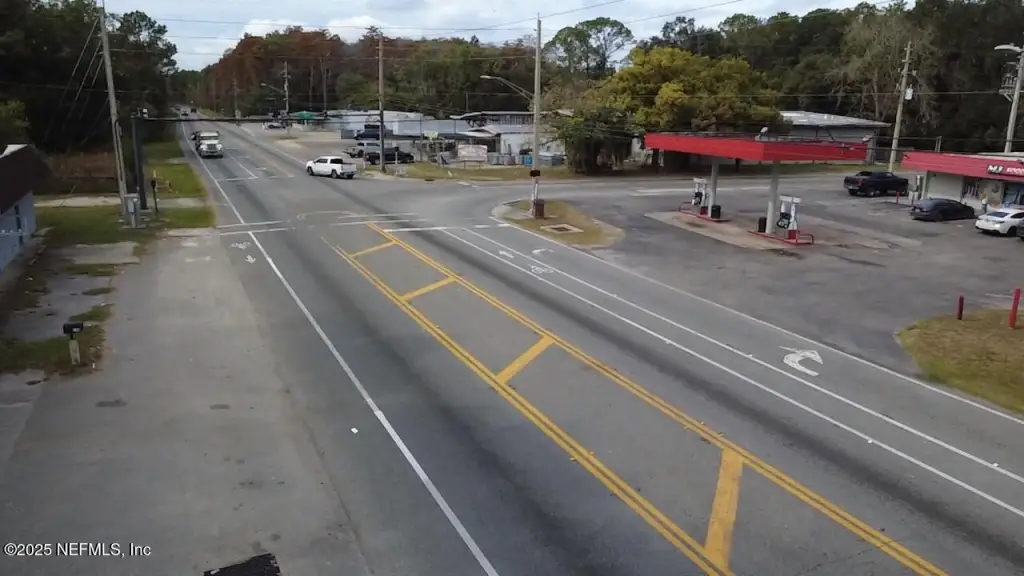
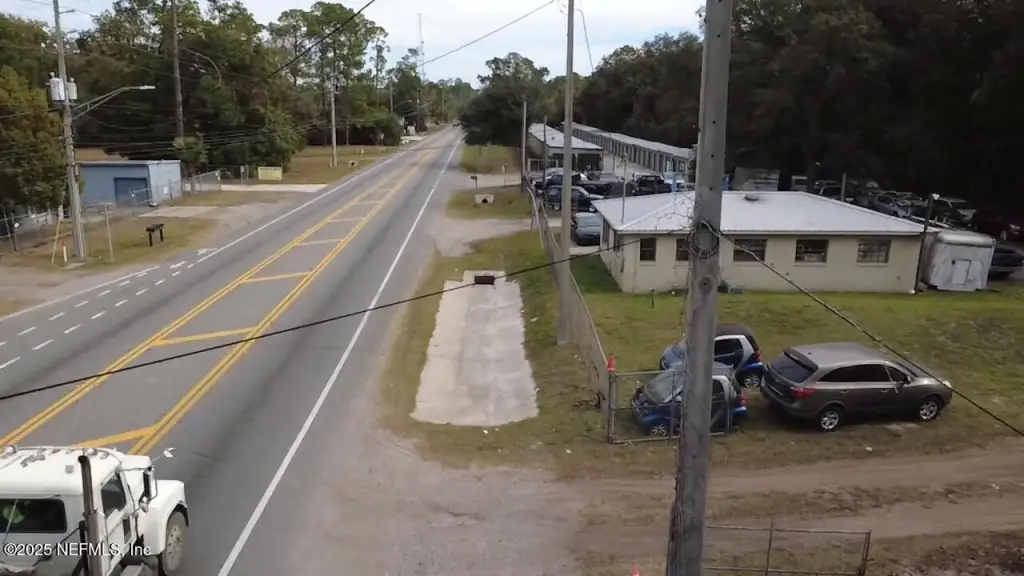
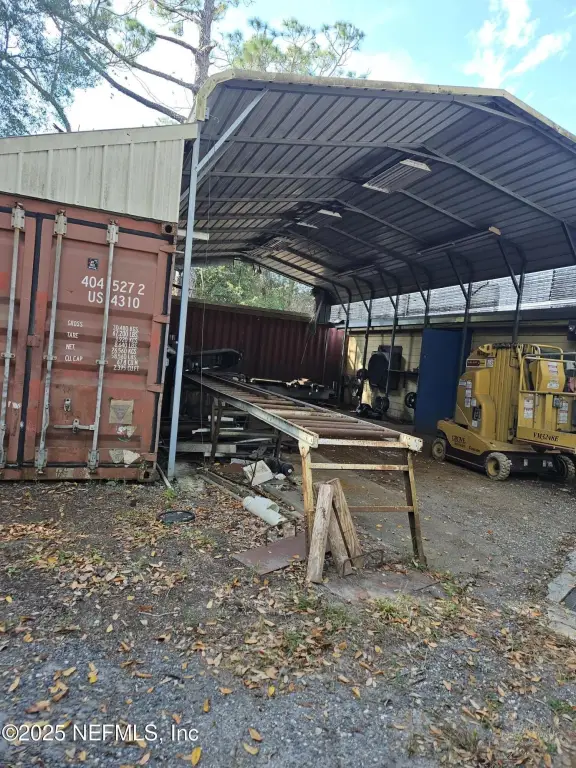
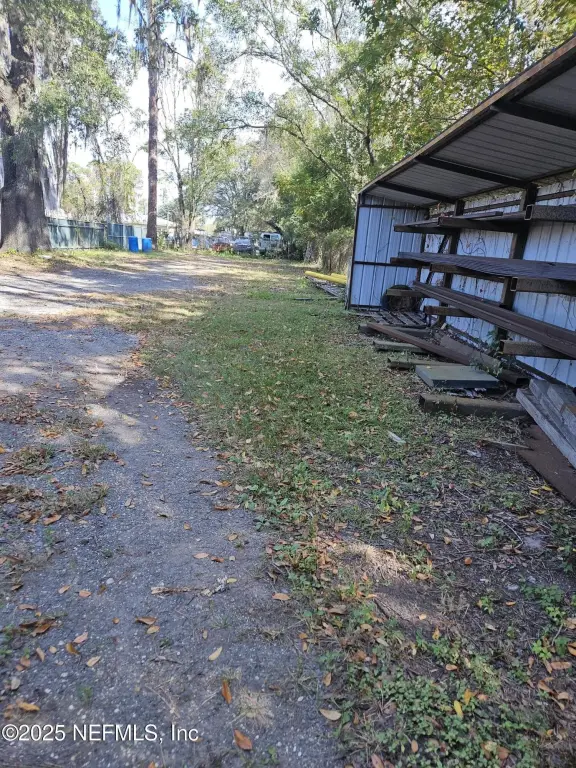
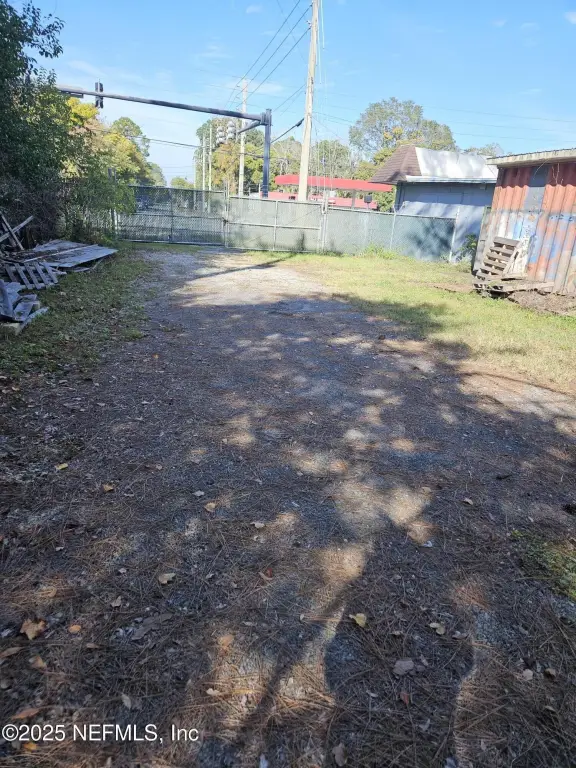
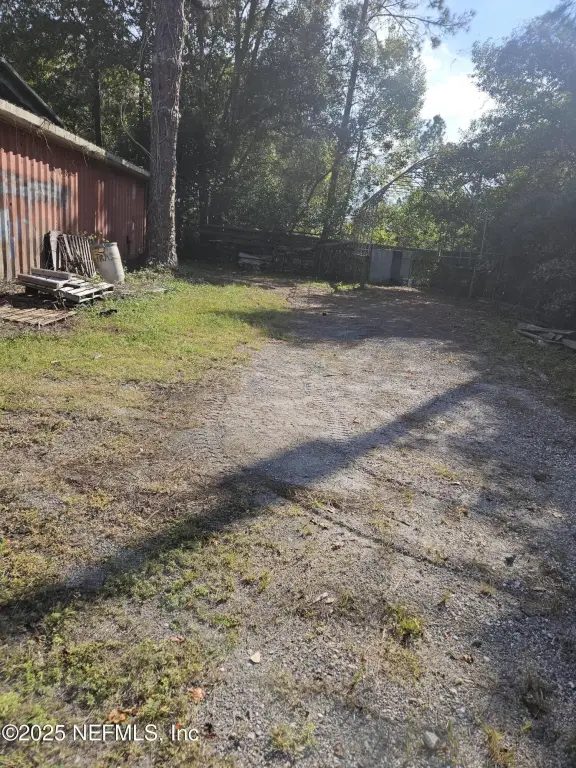
For Sale
$625,000
COMMERCIAL - Jacksonville, FL
Property Size6,500 SF
Price / SF$96.15
Days on Market239
Property Features for 9100 W BEAVER Street
General Information
Property type
Commercial Sale
Property subtype
Other
Bathrooms
3
Rooms
Bathroom 2, Bathroom 3, Bathroom 1
Parking features
Carport, Off Street, On Street, Guest, Parking Lot
Security features
Security
Fencing
Chain Link
Standard status
Active
APN
0068640000
Size
6,500 SF
Taxes and HOA fees
Tax Year
2025
Tax Annual Amount
2797
Utilities
Utilities
Electricity Available
Sewer type
Septic Tank
Water source
Private
Building Details
Year built
1947
Floors in Building
1
Number of units
1
Building materials
Block
Roof type
Mixed, Shingle
Listing Agency:
INI REALTY
(904) 394-7125
Listed By:
CHUN TOUCH · License #3166620
(904) 501-0349
Added: Dec 1, 2025
Changed: Jul 11
Last Checked: Jul 28 at 5:06PM
MLS# 2119843
Copyright © 2026 realMLS. All rights reserved. All information provided by the listing agent/broker is deemed reliable but is not guaranteed and should be independently verified.
Investment Insights
Based on property information with market context.
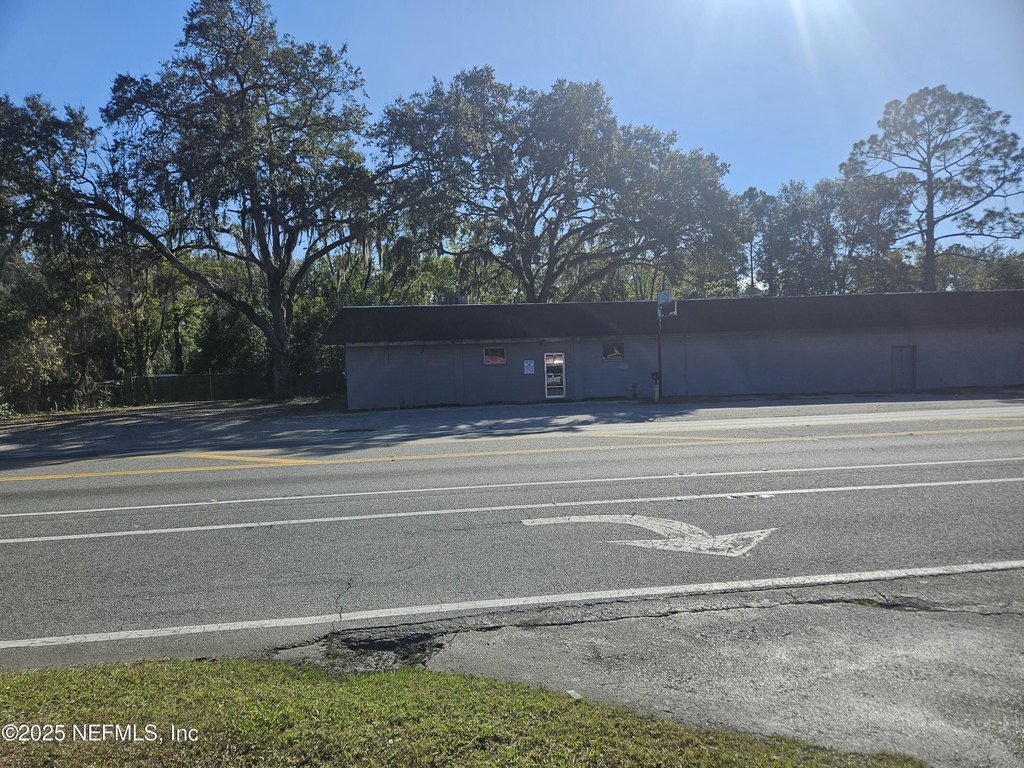
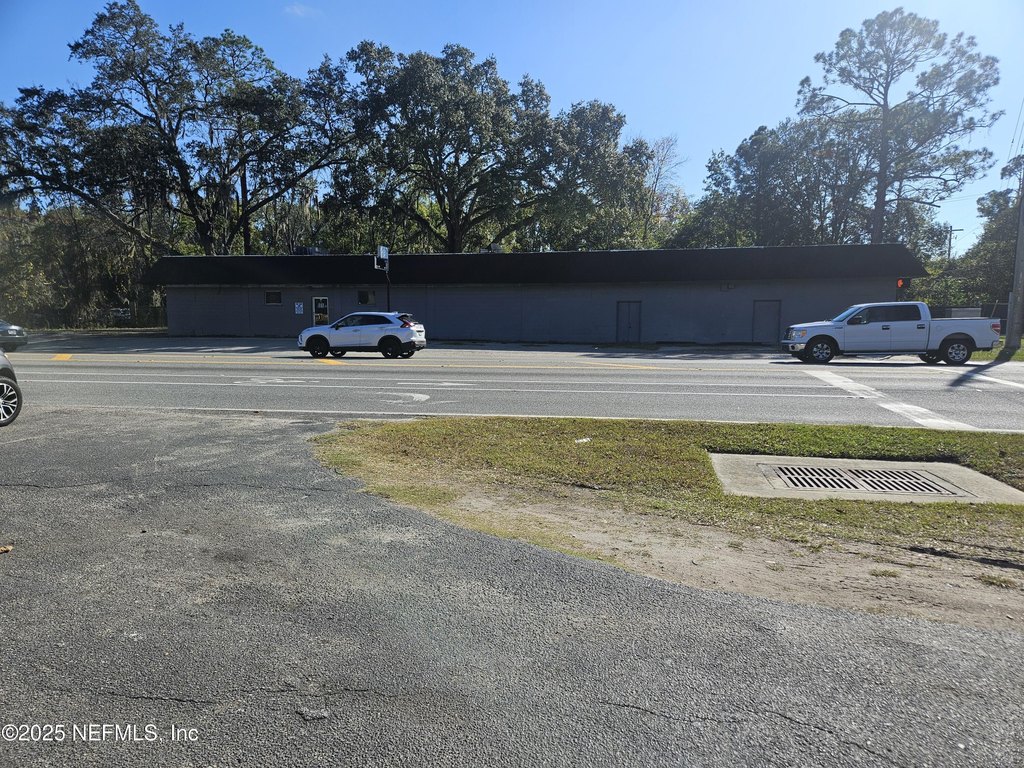
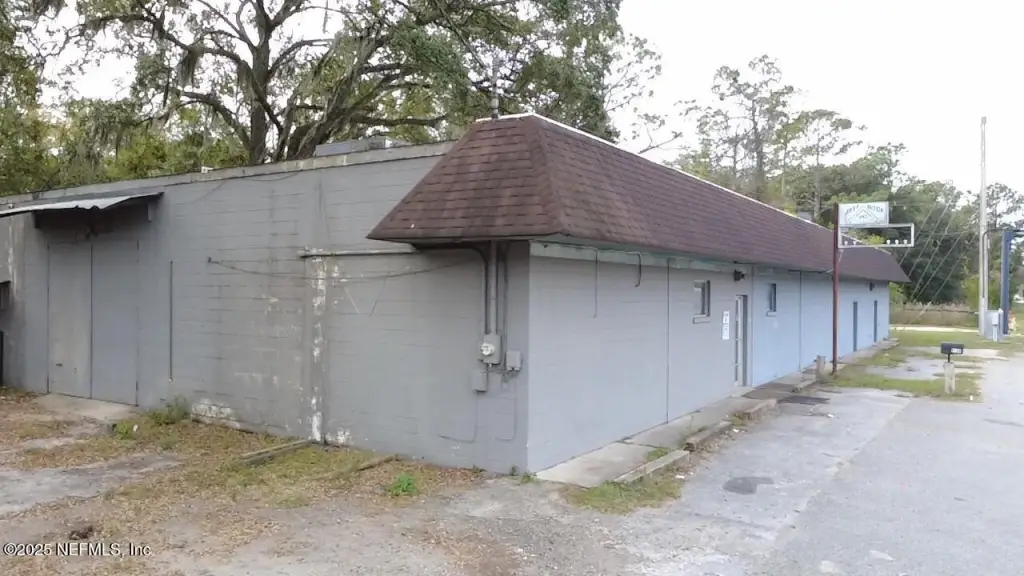
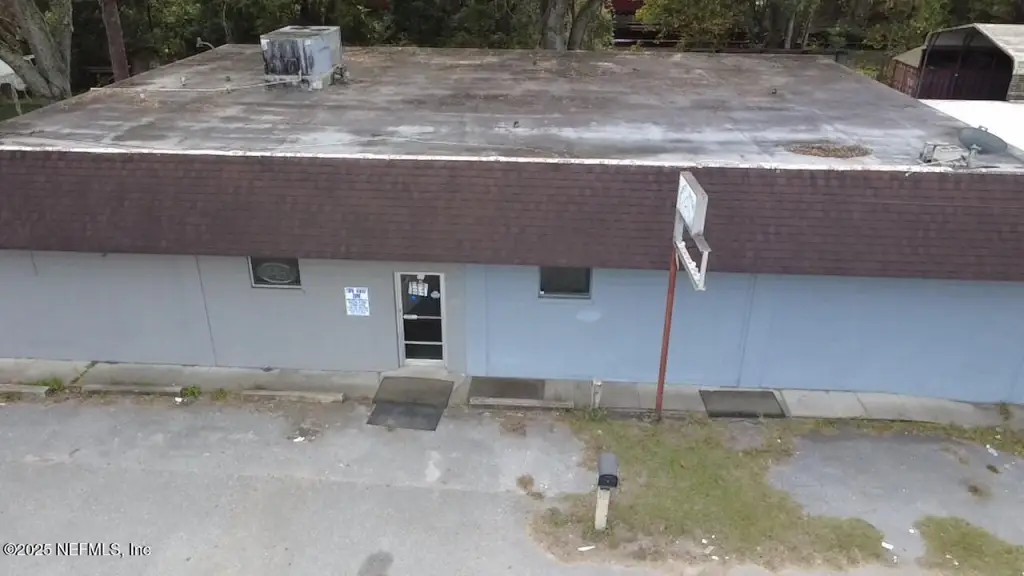
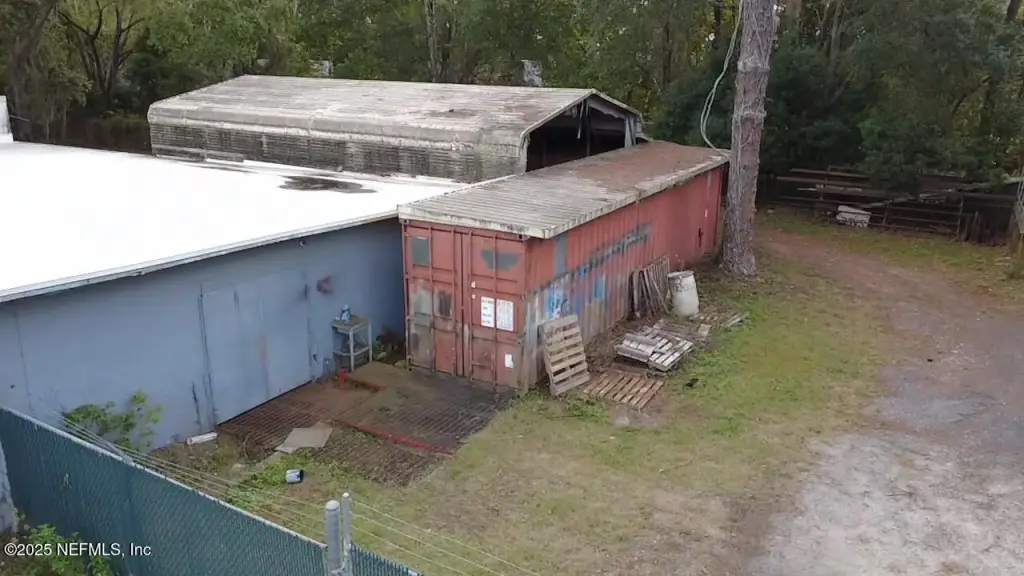
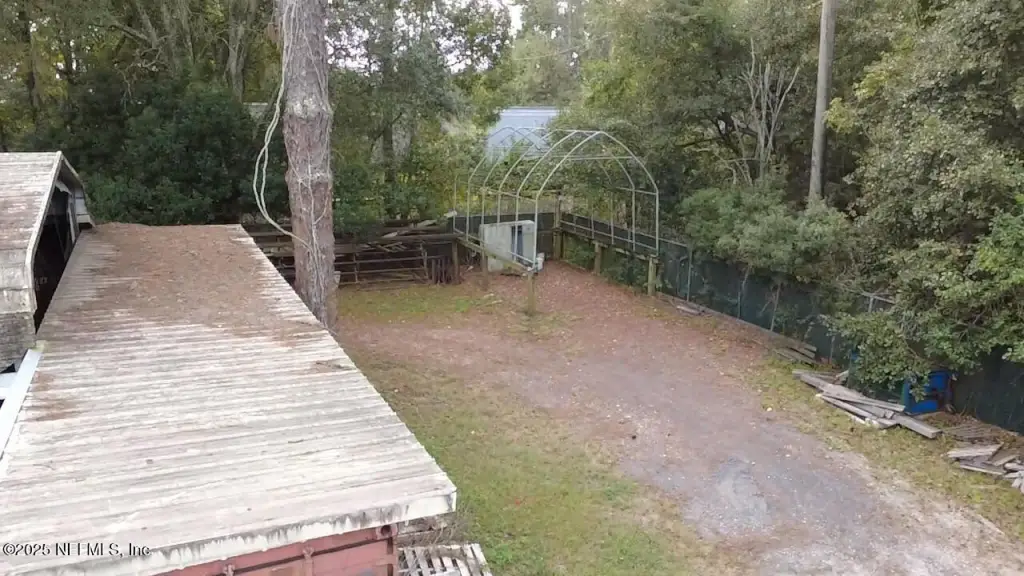
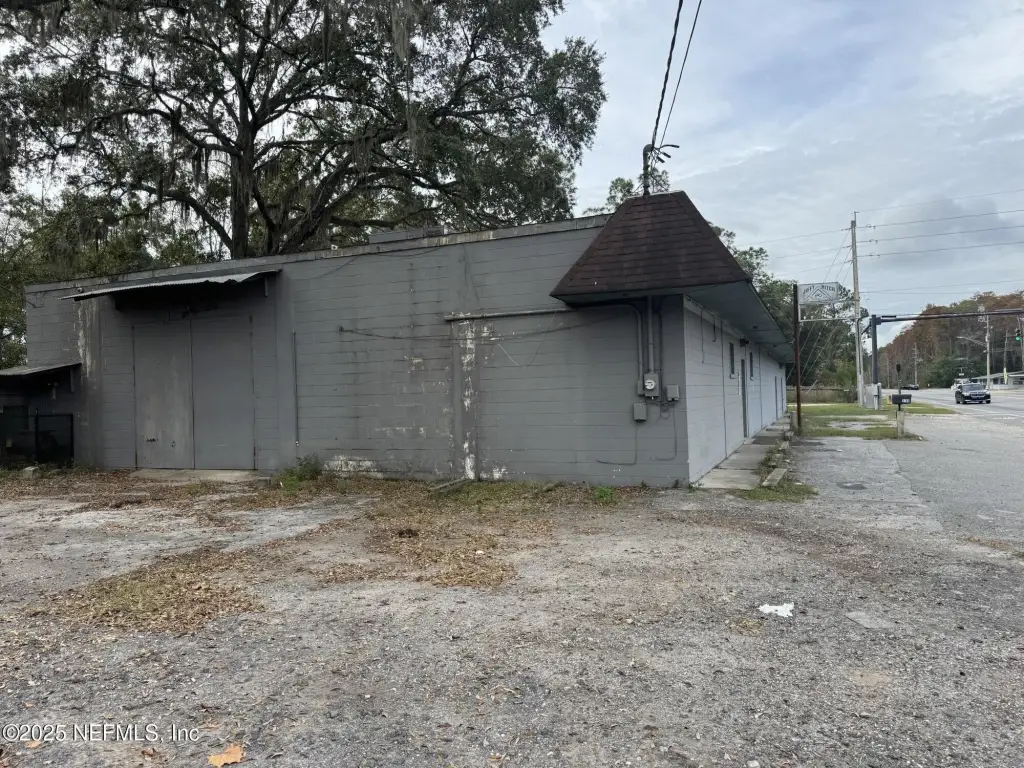
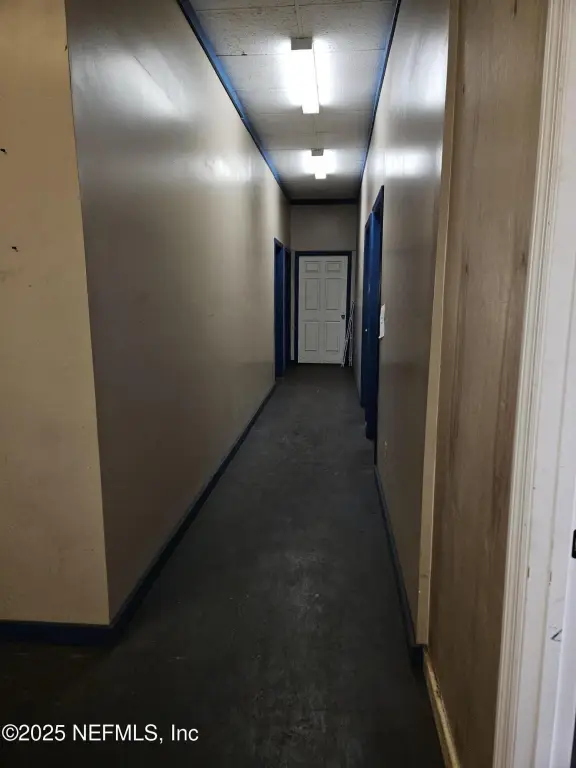
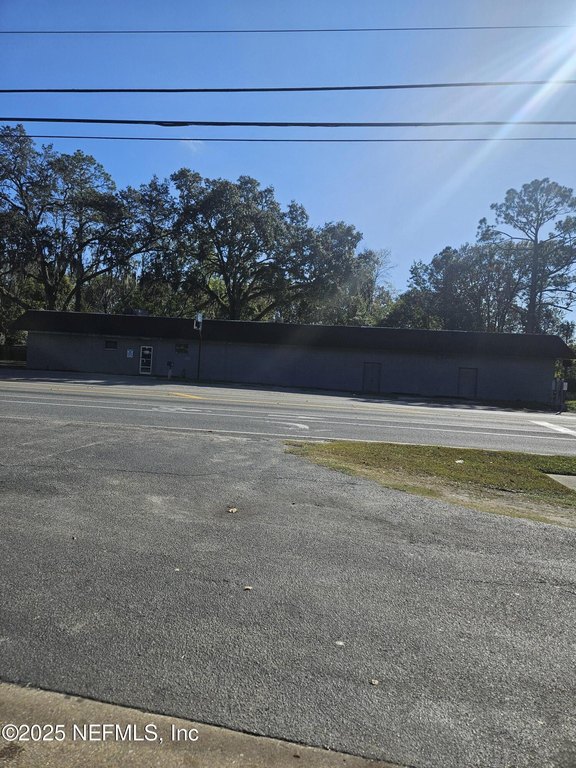
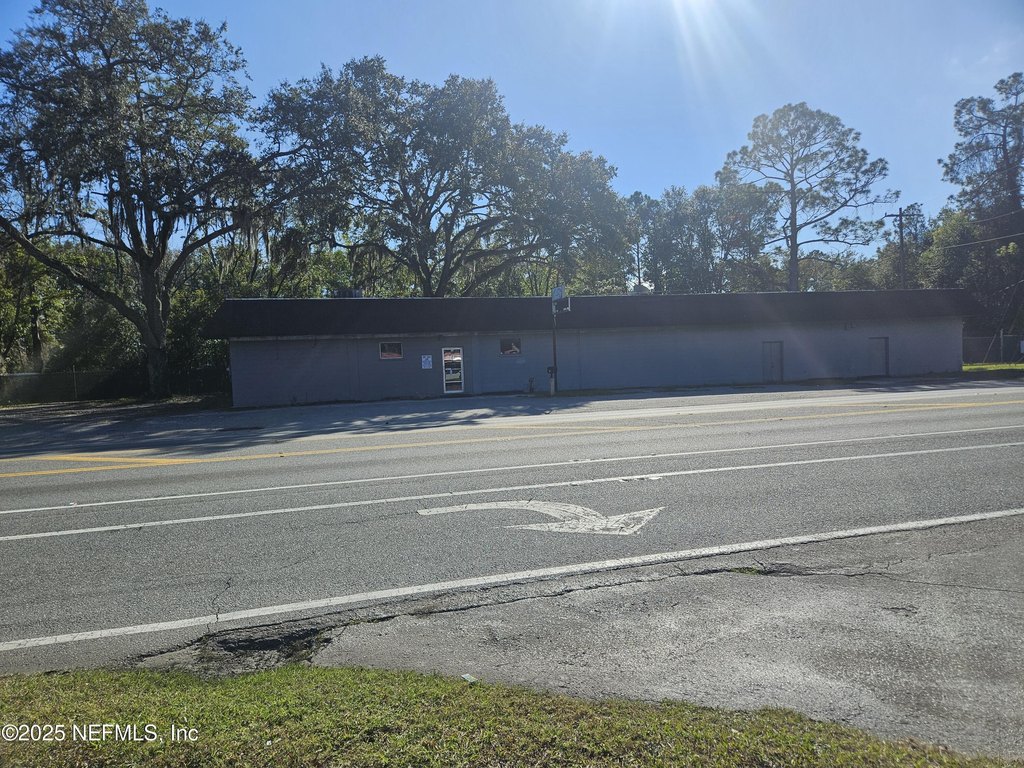
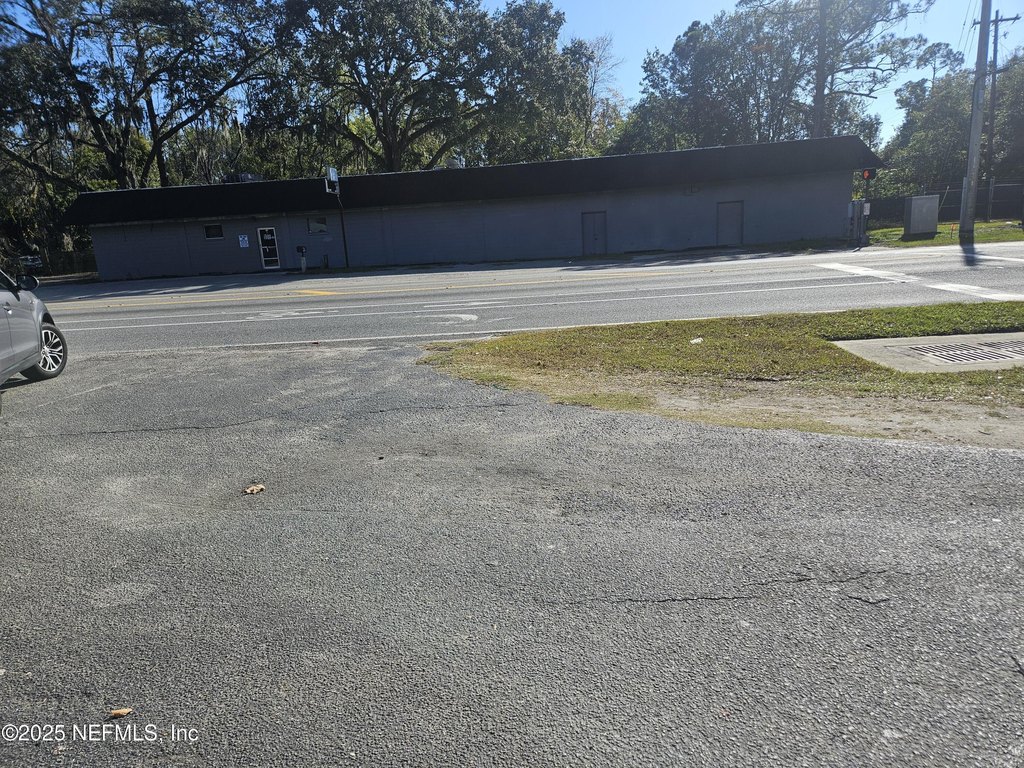
This property is a service garage/vehicle repair facility on an IL-zoned site, set up to support manufacturing or service operations. The fenced yard provides outdoor space for work or storage, and the sale includes all containers and carports that convey with the property. Inside, there are two large manufacturing rooms in the back of the building. A 9x10 drive-in door opens to a main production room measuring 30x70 with a 14-foot ceiling, and a second production room measures 30x50.
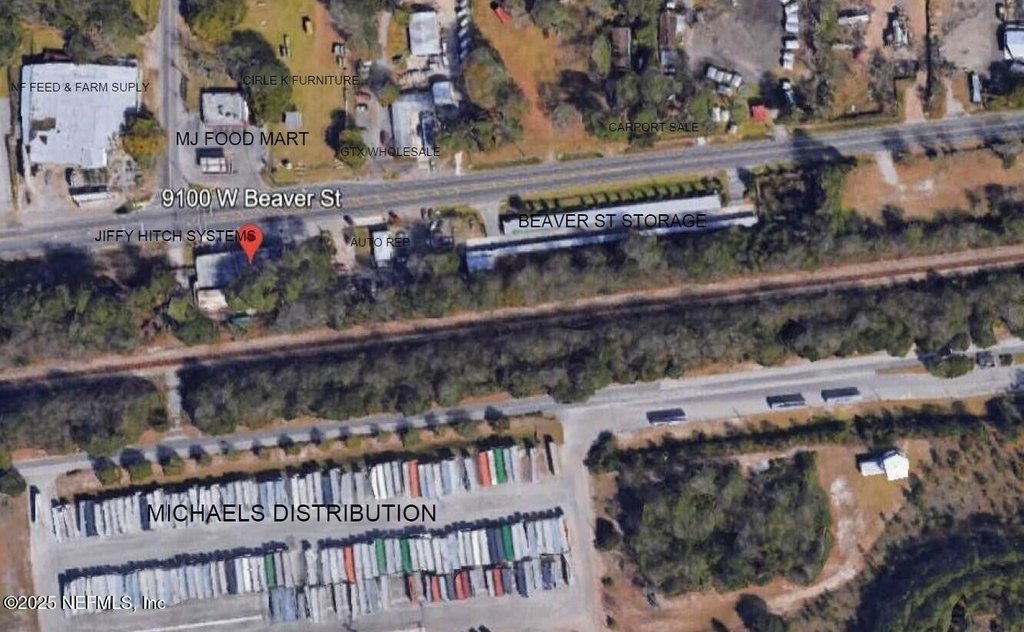
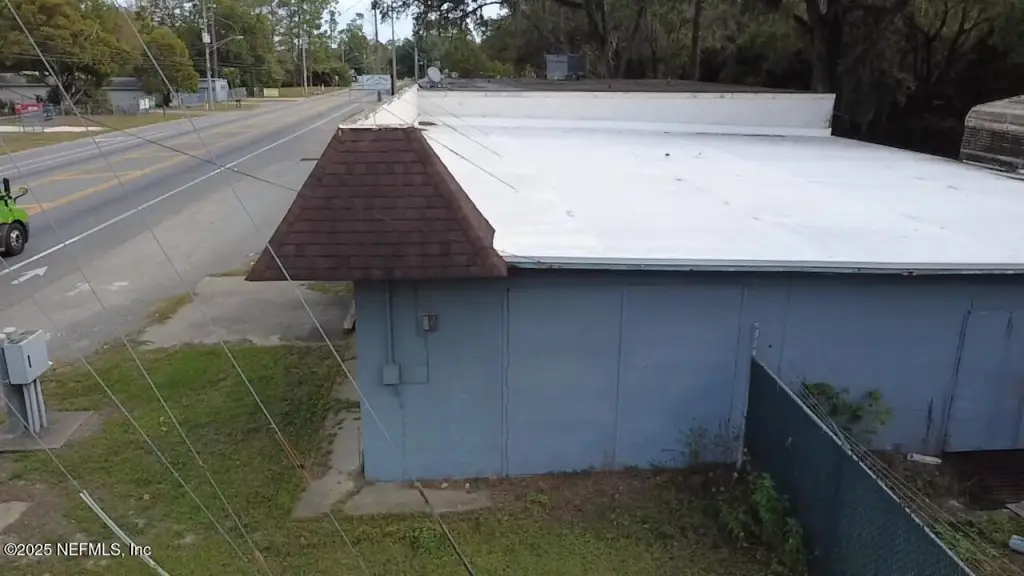
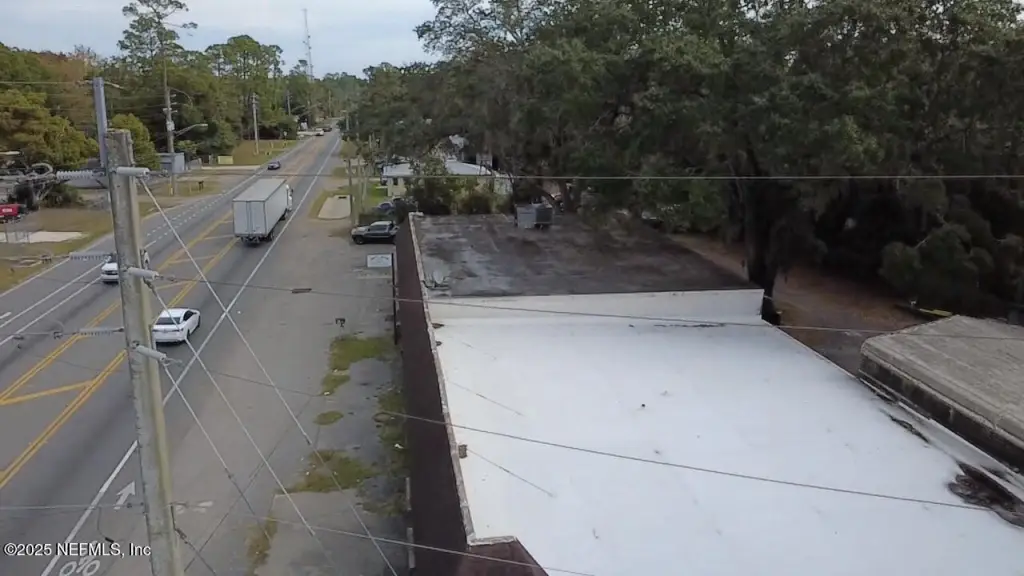
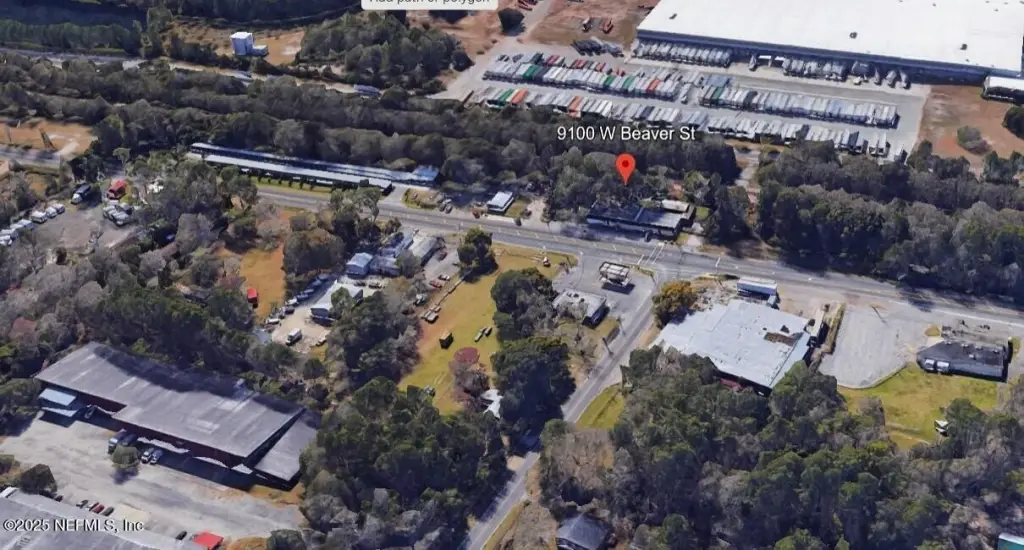
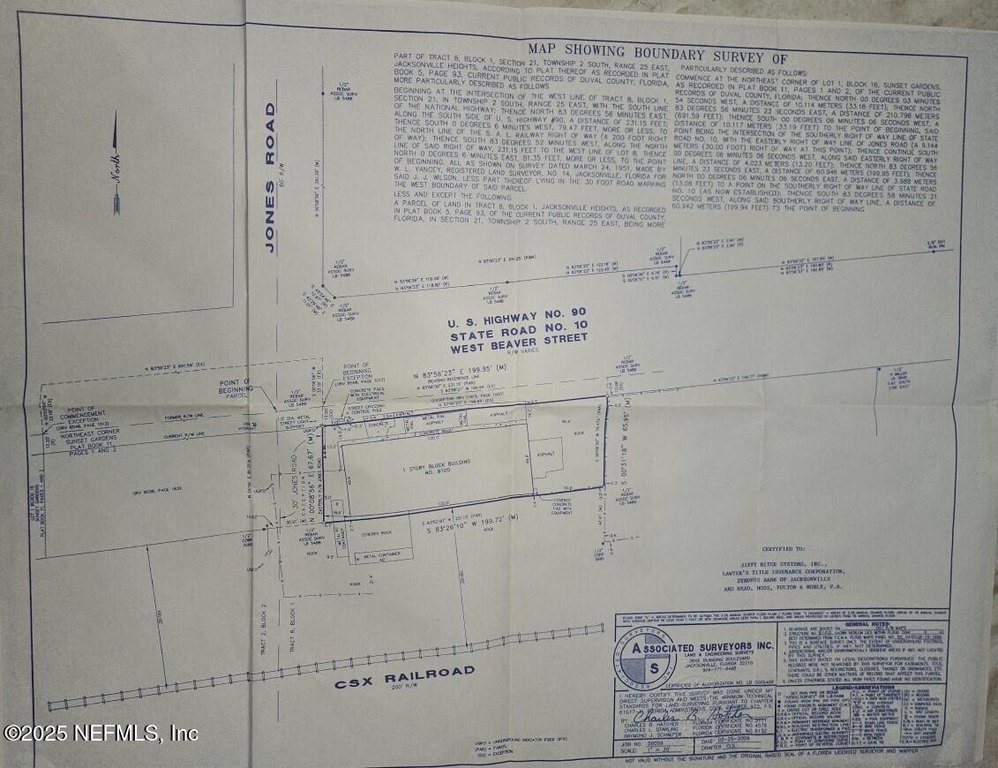
The site is described as highly visible on Highway 90 and sits adjacent to CSX train track. The property is served by well and septic. Electrical service is described as a 240/3 panel, with the main and sub box updated a few years ago. Roofs were updated within the last five years, and the AC is about two years old.
The existing configuration—with drive-in access, substantial interior work areas, and an enclosed yard—can fit tenants or owners seeking an IL-zoned automotive service and repair or light industrial-style workspace. The property is being sold as-is, and the buyer will pay for a new survey and verify items they deem important, including note that some accessory buildings may be outside the property line. Some personal items may be negotiable for sale.
The site is described as highly visible on Highway 90 and sits adjacent to CSX train track. The property is served by well and septic. Electrical service is described as a 240/3 panel, with the main and sub box updated a few years ago. Roofs were updated within the last five years, and the AC is about two years old.
The existing configuration—with drive-in access, substantial interior work areas, and an enclosed yard—can fit tenants or owners seeking an IL-zoned automotive service and repair or light industrial-style workspace. The property is being sold as-is, and the buyer will pay for a new survey and verify items they deem important, including note that some accessory buildings may be outside the property line. Some personal items may be negotiable for sale.
Key Highlights
- 7972 SF property on Hwy 90 with IL zoning; service garage/vehicle repair usage.
- Includes two back manufacturing/production rooms: 30x70 (14 ft ceiling) and 30x50.
- 9x10 drive‑in door opens to the main production room (30x70).
Financial Insights For Industrial
Simulate Cap Rate and NOI
NOI Build-Up
- Vacancy
- income lost from leasable area expected to sit empty during the year — subtracted from gross rent.
- EGI (Effective Gross Income)
- gross rent minus vacancy losses — the realistic income before paying operating costs.
- OpEx (Operating Expenses)
- recurring costs to operate the property (property tax, insurance, utilities, maintenance, management) — excludes financing and capital improvements.
- NOI (Net Operating Income)
- income a property generates after operating costs but before financing and taxes.
| Component | $ | $/SF |
|---|---|---|
| Gross rent | $54.6k | $8.40 |
| − Vacancy | −$3.0k | −$0.46 |
| EGI | $51.6k | $7.94 |
| − OpEx | −$15.5k | −$2.38 |
| NOI | $36.1k | $5.56 |
6,500 SF · lease $8.40/SF/yr · vacancy 5.50% · expense 30.00%
Alternative Uses
Best Use
Retail
$1.05M
$918.3K – $1.22M
NOI $73,464 @ 7.0% cap · market cap 11.75%
Second Best
Industrial
$516.0K
$451.5K – $602.0K
NOI $36,118 @ 7.0% cap · market cap 5.78%
Theoretical Best
Office A
$1.78M
$1.56M – $2.08M
NOI $124,644 @ 7.0% cap · market cap 19.94%
Zoning and permitted uses should be independently verified with authorities.
Property Analytics
Property Profile
Location Intelligence
Current Use





Similar Off Market Nearby
- Made in the Shade Mobile Window Tint — 8570 judy taylor dr, jacksonville, fl 32221
- In & Out Alignments and Truck Services — 8747 W Beaver St #2, Jacksonville, FL 32220
- Positive RV Repair.LLC — 9029 W Beaver St, Jacksonville, FL 32220
- Made in the Shade Window Tint — 8570 Judy Taylor Dr, Jacksonville, FL 32221
- First Floor Sports Car Store — 8538 Mallory Rd, Jacksonville, FL 32220
Frequently Asked Questions
What type of property is this?
Auto shop - Zoned IL service garage with fenced yard, drive-in access, and multiple production rooms for vehicle repair and service use.
Where is this auto shop located?
The property is located at 9100 W BEAVER Street Jacksonville, FL.
What is the asking price?
The asking price for this property is $625,000.
What are key features of this property?
This property features: 7972 SF property on Hwy 90 with IL zoning; service garage/vehicle repair usage.; Includes two back manufacturing/production rooms: 30x70 (14 ft ceiling) and 30x50.; 9x10 drive‑in door opens to the main production room (30x70).


