Bank Building with Established
For Sale
Contact for pricing
907 22nd St, Aliquippa, PA 15001
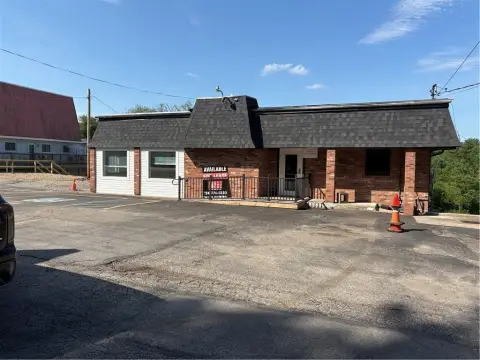
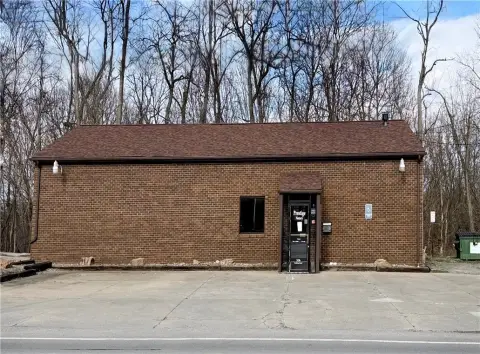
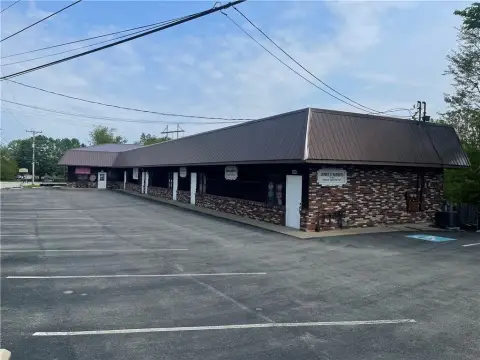
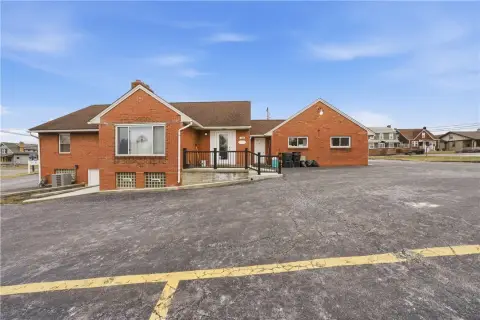
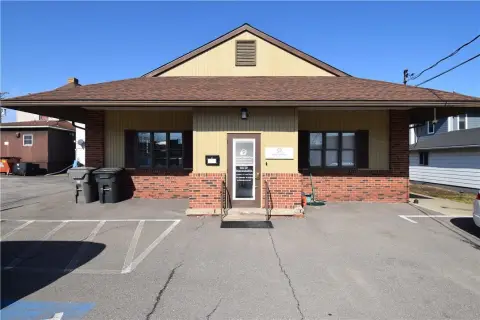
Established banking facility leased to Citizens Bank, N.A., with a sustained operating history at the site.
Property Size4,661 SF
Price / SF$292.31
Days on Market276
Property Features for 907 22nd St
General Information
Standard status
Active
Size
4,661 SF
Property subtype
RETAIL
Building Details
Tenancy
Single
Listing Agency:
Equity CRE
(610) 645-7700
Listed By:
Ken Yanni
(484) 417-2223
Source:
Moodyscre
Added: Jan 13
Changed: Oct 5
Last Checked: Oct 15 at 1:14AM
Displayed information is deemed reliable but is not guaranteed and should be independently verified. All listing content including descriptions, pricing, images are the copyrighted material of Equity CRE

Ask AI about this property
Review the available facts, identify missing information and prepare questions for the agent.
Investment Insights
Based on property information with market context.
The property is a 4,661-square-foot bank facility occupied by Citizens Bank, N.A. The tenant has operated from the location since 2007, and exercised a lease option in July 2025 extending the term by five years. Citizens Bank, N.A. carries an S&P rating of A-.
Located at 907 22nd St in Aliquippa, Pennsylvania, the branch is approximately 18 miles northwest of Pittsburgh. The location recorded $167.65 million in deposits in 2025, while deposits over the preceding six years ranged from $164.96 million to $175.08 million. Among 31 banks in Beaver County, the branch ranks fourth by total deposits.
Located at 907 22nd St in Aliquippa, Pennsylvania, the branch is approximately 18 miles northwest of Pittsburgh. The location recorded $167.65 million in deposits in 2025, while deposits over the preceding six years ranged from $164.96 million to $175.08 million. Among 31 banks in Beaver County, the branch ranks fourth by total deposits.
Key Highlights
- 4,661‑square‑foot bank facility at 907 22nd St, Aliquippa, PA 15001
- Citizens Bank, N.A. has operated at the site since 2007
- Lease option exercised in July 2025 for an additional five years
Financial Insights
Estimated NOI and Cap Rate
NOI / Yr
$50,339
Cap Rate
3.69%
Suggested Prices Based on Cap Rates
Cap Rate 5%
$1,006,780
$1.0M
Cap Rate 7%
$719,129
$719.1K
Cap Rate 9%
$559,322
$559.3K
Market Conditions
NOI Build-Up for 4,661 SF
Gross rent
$69.9K $15.00/SF
− Vacancy
−$2.8K −$0.60/SF
EGI
$67.1K $14.40/SF
− OpEx
−$16.8K −$3.60/SF
NOI
$50.3K $10.80/SF
Area
Beaver County, PA
Vacancy
4.00%
Lease Rate
$15.00 /SF/Yr
Expense Ratio
25.00%
Simulate Cap Rate and NOI
Suggested Prices Based on Cap Rates
Cap Rate 5%
$1,006,780
Cap Rate 7%
$719,129
Cap Rate 9%
$559,322
Alternative Uses
Best Use
Specialty Retail
$719.1K
$629.2K – $839.0K
NOI $50,339 @ 7.0% cap · market cap 3.69%
Second Best
Retail
$671.2K
$587.3K – $783.1K
NOI $46,983 @ 7.0% cap · market cap 3.45%
Theoretical Best
Office A
$1.19M
$1.04M – $1.39M
NOI $83,106 @ 7.0% cap · market cap 6.10%
Zoning and permitted uses should be independently verified with authorities.
How Realmo checks its estimates
Property Analytics
Current Use
Lease Details
Single-tenant
Tenancy
Location Intelligence
Trade Area within ½ mile
9
Businesses Nearby
Explore this area
Business Placement
Demographics for 15001, PA
32,299
Population
16,043
Households
2
Avg Household Size
45
Median Age
30%
College-Educated
96%
High-School Grad
60.3 sq mi
ZIP Area
536
Density / Sq Mi
$71,301
Median Household Income
$45,122
Median Earnings
$1,014
Median Rent
$178,300
Median Home Value
Market
Vacancy Rate% for Retail in Northeast region





Frequently Asked Questions
What type of property is this?
Bank - Established banking facility leased to Citizens Bank, N.A., with a sustained operating history at the site.
Where is this bank located?
The property is located at 907 22nd St Aliquippa, PA.
What is the asking price?
The asking price for this property is $1,362,446.
What are key features of this property?
This property features: 4,661‑square‑foot bank facility at 907 22nd St, Aliquippa, PA 15001; Citizens Bank, N.A. has operated at the site since 2007; Lease option exercised in July 2025 for an additional five years