Automotive Garage with Rental
For Sale
Contact for pricing
905 South Market Street, Elizabethtown, PA 17022
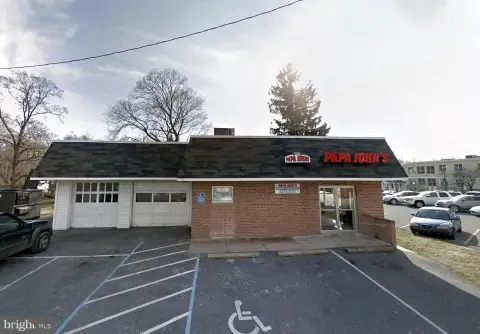
Commercial property with automotive garage and leased salon space.
Property Size5,900 SF
Lot Size0.64 Acres
Price / SF$165.25
Days on Market228
Property Features for 905 South Market Street
General Information
Standard status
Active
Size
5,900 SF
Lot size
0.64 Acres
Property subtype
Retail
Zoning
GC - General Commercial
Investment Type
Owner/User
Listing Agency:
U.S. Commercial Realty
Listed By:
Daniel Berger Jr. · License #PA AB068331
(717) 735-6000
Source:
Crexi
Added: Feb 23
Changed: Oct 6
Last Checked: Oct 7 at 12:44PM
Displayed information is deemed reliable but is not guaranteed and should be independently verified. All listing content including descriptions, pricing, images are the copyrighted material of U.S. Commercial Realty
Investment Insights
Based on property information with market context.
The commercial property at 903-905 South Market Street in Elizabethtown, PA, presents an investment opportunity with an automotive garage and rental income. The property includes approximately 5,900 square feet of automotive service station space with an attached office, which will be vacant at settlement. Additionally, there is approximately 1,700 square feet of leased hair and nail salon space. The automotive garage includes all furniture, fixtures, and equipment (FF&E), making it ready for operation. The hair salon has been a stable tenant since 2021, generating $19,200 annually in rental income. Situated on 0.64 acres in a General Commercial zoning district with public water and sewer, this property is suitable for an owner-operator looking to run an automotive business while benefiting from tenant income. The property is well-positioned in a growing market with visibility and accessibility.
Key Highlights
- Automotive garage space (5,900 sq ft) with all furniture, fixtures, and equipment (FF&E) included, ready for immediate operation.
- Existing hair and nail salon tenant (1,700 sq ft) generating $19,200 annual rental income.
- Prime location on South Market Street in Elizabethtown, PA, offering excellent visibility and accessibility.
Financial Insights
Estimated NOI and Cap Rate
NOI / Yr
$69,434
Cap Rate
7.12%
Suggested Prices Based on Cap Rates
Cap Rate 5%
$1,388,680
$1.4M
Cap Rate 7%
$991,914
$991.9K
Cap Rate 9%
$771,489
$771.5K
Market Conditions
NOI Build-Up for 5,900 SF
Gross rent
$106.2K $18.00/SF
− Vacancy
−$7.0K −$1.19/SF
EGI
$99.2K $16.81/SF
− OpEx
−$29.8K −$5.04/SF
NOI
$69.4K $11.77/SF
Area
Lancaster County, PA
Vacancy
6.60%
Lease Rate
$18.00 /SF/Yr
Expense Ratio
30.00%
Simulate Cap Rate and NOI
Suggested Prices Based on Cap Rates
Cap Rate 5%
$1,388,680
Cap Rate 7%
$991,914
Cap Rate 9%
$771,489
Alternative Uses
Best Use
Retail
$991.9K
$867.9K – $1.16M
NOI $69,434 @ 7.0% cap · market cap 7.12%
Second Best
Industrial
$469.4K
$410.7K – $547.7K
NOI $32,859 @ 7.0% cap · market cap 3.37%
Theoretical Best
Office A
$1.98M
$1.73M – $2.31M
NOI $138,399 @ 7.0% cap · market cap 14.19%
Zoning and permitted uses should be independently verified with authorities.
Property Analytics
Unlock full access to Insights
Subscribe to Realmo Intelligence
Open Analytics
Current Use
Location Intelligence
Trade Area within ½ mile
589
Businesses Nearby
142k
Monthly Visits Nearby
Well-served
Demand for This Use
Explore this area
Business Placement
Foot Traffic Nearby
Dining 40%
Groceries 32%
Shops & Services 28%
Giant Food Store
Groceries
45,979 visits/mo
0.4 miles
McDonald's
Dining
30,076 visits/mo
0.5 miles
Giant Gasoline
Shops & Services
16,611 visits/mo
0.4 miles
Dunkin' Donuts
Dining
12,765 visits/mo
0.1 miles
Taco Bell
Dining
12,162 visits/mo
0.1 miles
Demographics for 17022, PA
31,163
Population
12,950
Households
2.4
Avg Household Size
42
Median Age
33%
College-Educated
93%
High-School Grad
55.0 sq mi
ZIP Area
567
Density / Sq Mi
$79,075
Median Household Income
$42,844
Median Earnings
$1,381
Median Rent
$272,700
Median Home Value
Check the figures for this property
Cap Rate, Value Estimation, Potential NOI and more
View Realmo Analytics
Market
Vacancy Rate% for Retail in Northeast region

Questions? Ask Rey
Realmo’s AI knows this listing — price, zoning, demand, history. Ask anything.



Similar Off Market Nearby
- Monro Auto Service And Tire Centers — 10 Anchor Rd, Elizabethtown, PA 17022
- Barnes Motors — 1212 S Market St, Elizabethtown, PA 17022
- Reiders Service Station — 903 S Market St, Elizabethtown, PA 17022
- Wicked Dreamz — 565 Hampden Rd, Elizabethtown, PA 17022
- KG Performance — 38 Peach Alley, Elizabethtown, PA 17022
Frequently Asked Questions
What type of property is this?
Auto shop - Commercial property with automotive garage and leased salon space.
Where is this auto shop located?
The property is located at 905 South Market Street Elizabethtown, PA.
What is the asking price?
The asking price for this property is $975,000.
What are key features of this property?
This property features: Automotive garage space (5,900 sq ft) with all furniture, fixtures, and equipment (FF&E) included, ready for immediate operation.; Existing hair and nail salon tenant (1,700 sq ft) generating $19,200 annual rental income.; Prime location on South Market Street in Elizabethtown, PA, offering excellent visibility and accessibility.



