Retail Property Near Interstate
For Sale
Contact for pricing
Pending
900 N Border Ave, Weslaco, TX
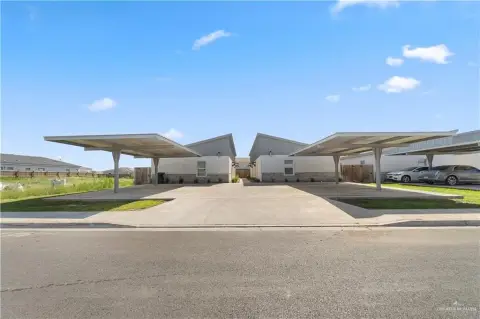
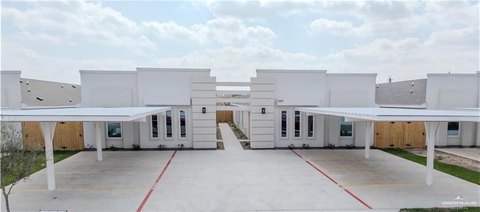
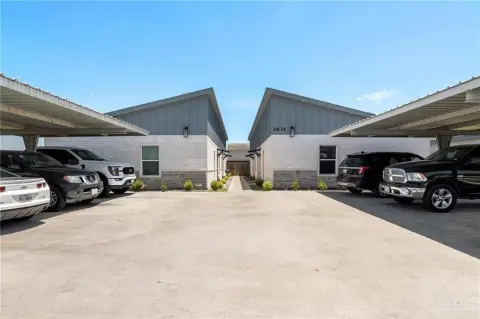
4,470 SF retail property with development potential near expressway.
Property Size4,470 SF
Lot Size1.59 Acres
Days on Market352
Property Features for 900 N Border Ave
General Information
Standard status
Pending
Size
4,470 SF
Lot size
1.59 Acres
Property subtype
RETAIL
Listing Agency:
SVN | Hanna Solutions CRE
(956) 322-4001
Listed By:
Mario Mendiola
(956) 246-8812
Source:
Moodyscre
Added: Nov 4, 2025
Changed: Oct 9
Last Checked: Oct 20 at 5:26PM
Displayed information is deemed reliable but is not guaranteed and should be independently verified. All listing content including descriptions, pricing, images are the copyrighted material of SVN | Hanna Solutions CRE

Ask AI about this property
Review the available facts, identify missing information and prepare questions for the agent.
Investment Insights
Based on property information with market context.
This 4,470 square foot retail property is situated on a 1.59-acre lot and is currently 100% leased. Zoned B-1 Neighborhood Business District, the property offers an added-value opportunity with space for additional retail development. Its corner location at Pike Blvd & N. Border Ave provides strong visibility and traffic counts. The property is located just 0.17 miles south of Interstate 2, offering quick access to the expressway. Caddy-corner from Weslaco High School and surrounded by dense residential neighborhoods, it is ideally suited for neighborhood retail, medical, or service-oriented users. This income-producing asset is situated in a high-demand trade area experiencing continued growth.
Key Highlights
- 100% Leased: Stable, income‑producing asset.
- Added‑Value Opportunity: Space for additional retail development.
- High Visibility & Traffic: Corner location at Pike Blvd & N. Border Ave.
Financial Insights
Estimated NOI and Cap Rate
NOI / Yr
$60,355
Cap Rate
7.55%
Suggested Prices Based on Cap Rates
Cap Rate 5%
$1,207,100
$1.2M
Cap Rate 7%
$862,214
$862.2K
Cap Rate 9%
$670,611
$670.6K
Market Conditions
NOI Build-Up for 4,470 SF
Gross rent
$91.7K $20.52/SF
− Vacancy
−$5.5K −$1.23/SF
EGI
$86.2K $19.29/SF
− OpEx
−$25.9K −$5.79/SF
NOI
$60.4K $13.50/SF
Area
Hidalgo County, TX
Vacancy
6.00%
Lease Rate
$20.52 /SF/Yr
Expense Ratio
30.00%
Simulate Cap Rate and NOI
Suggested Prices Based on Cap Rates
Cap Rate 5%
$1,207,100
Cap Rate 7%
$862,214
Cap Rate 9%
$670,611
Alternative Uses
Best Use
Retail
$862.2K
$754.4K – $1.01M
NOI $60,355 @ 7.0% cap · market cap 7.55%
Second Best
—
—
no second resolved use
Theoretical Best
Hotel Hospitality
$3.37M
$2.95M – $3.93M
NOI $235,681 @ 7.0% cap · market cap 29.50%
Zoning and permitted uses should be independently verified with authorities.
How Realmo checks its estimates
Property Analytics
Who owns this building?
See the owner, sales and loan history
Open Analytics
Current Use
Location Intelligence
Trade Area within ½ mile
900
Businesses Nearby
268k
Monthly Visits Nearby
Explore this area
Business Placement
Foot Traffic Nearby
Dining 54%
Shops & Services 25%
Home Improvements & Furnishings 9%
Superstores 8%
McDonald's
Dining
41,717 visits/mo
0.4 miles
Whataburger
Dining
33,945 visits/mo
0.5 miles
H-E-B Fuel
Shops & Services
26,903 visits/mo
0.4 miles
Panda Express
Dining
20,877 visits/mo
0.4 miles
Big Lots
Superstores
20,784 visits/mo
0.2 miles
Check the figures for this property
Cap Rate, Value Estimation, Potential NOI and more
View Realmo Analytics
Market
Vacancy Rate% for Retail in South region



Frequently Asked Questions
What type of property is this?
Retail space - 4,470 SF retail property with development potential near expressway.
Where is this retail space located?
The property is located at 900 N Border Ave Weslaco, TX.
What is the asking price?
The asking price for this property is $799,000.
What are key features of this property?
This property features: 100% Leased: Stable, income‑producing asset.; Added‑Value Opportunity: Space for additional retail development.; High Visibility & Traffic: **Corner location at Pike Blvd & N. Border Ave.**


