Insulated Manufacturing
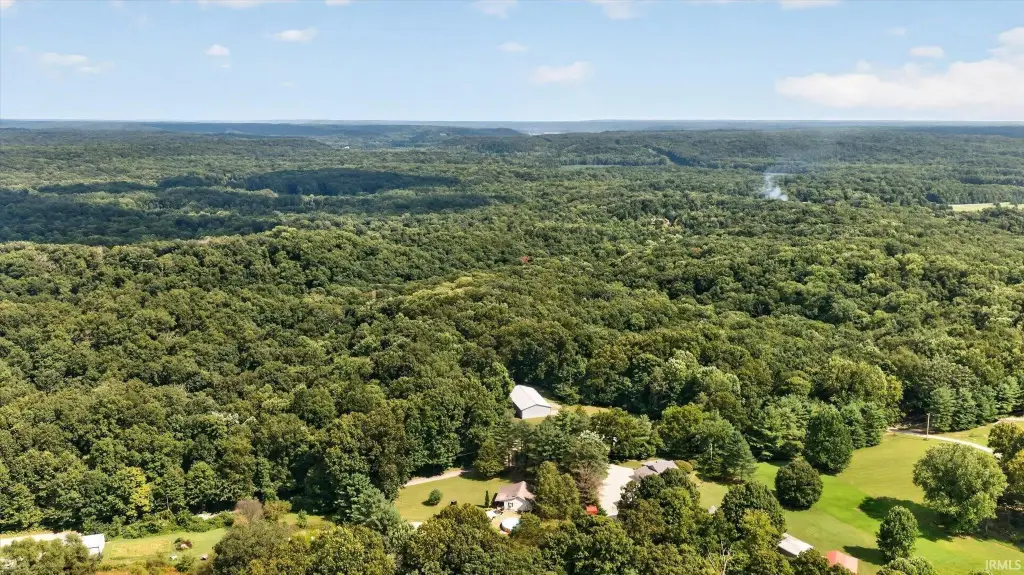
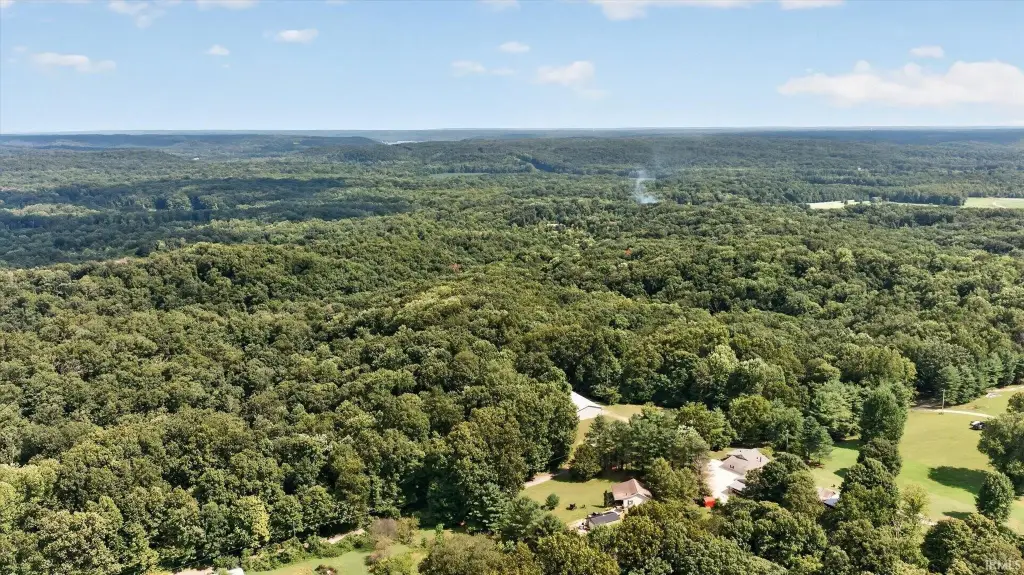
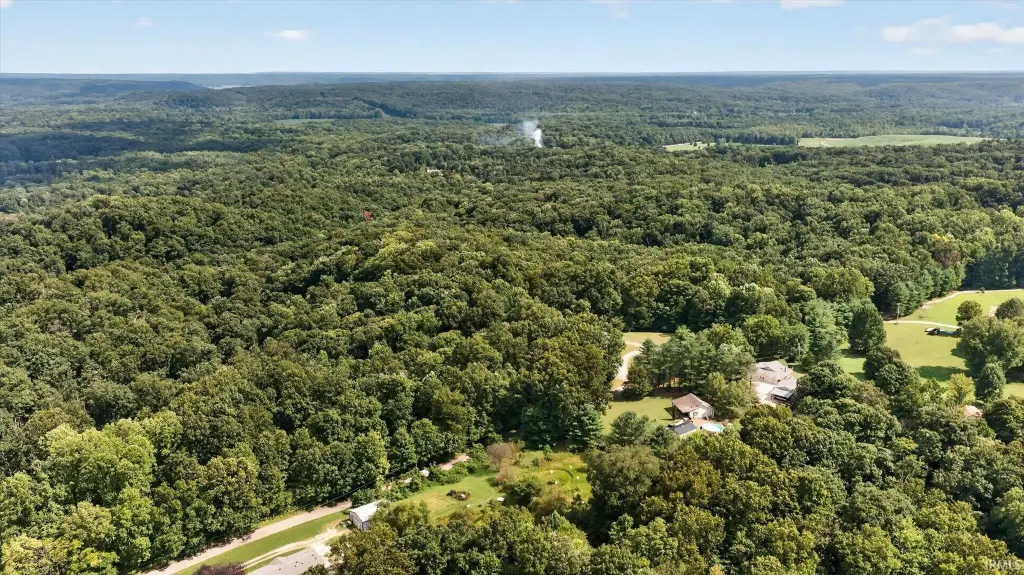
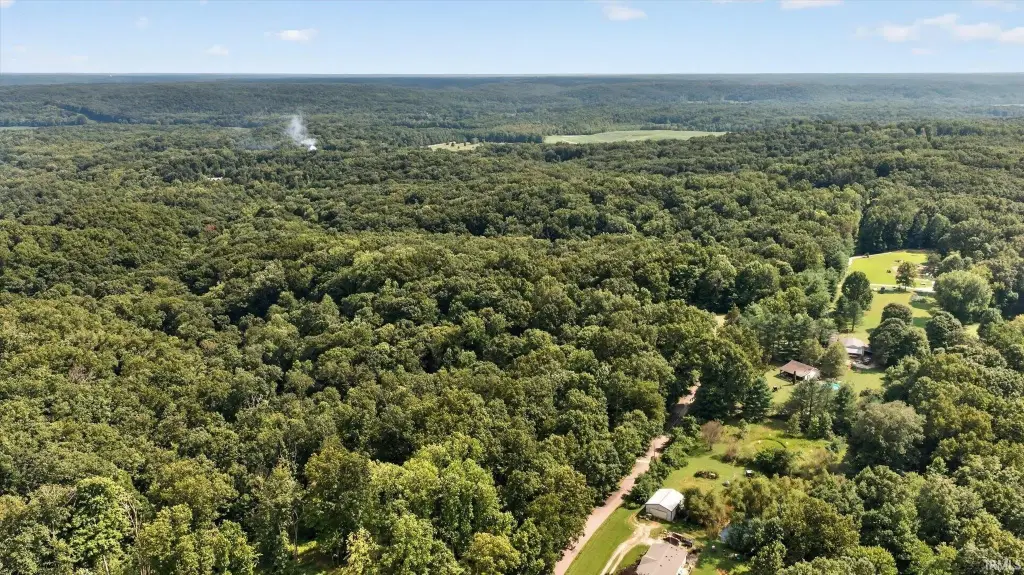
For Sale
$469,900
8550 N Fish Road, Bloomington, IN 47408
LOTS AND LAND, Bloomington, IN
Property Size3,200 SF
Lot Size15.75 Acres
Price / SF$146.84
Days on Market51
Property Features for 8550 N Fish Road
General Information
Property type
Land
Property subtype
Other
Lot features
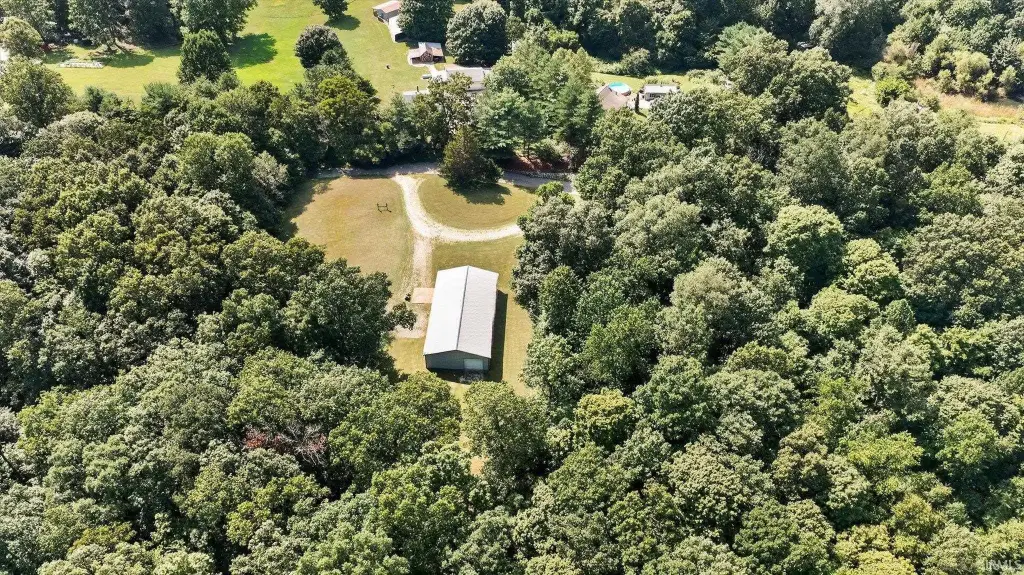
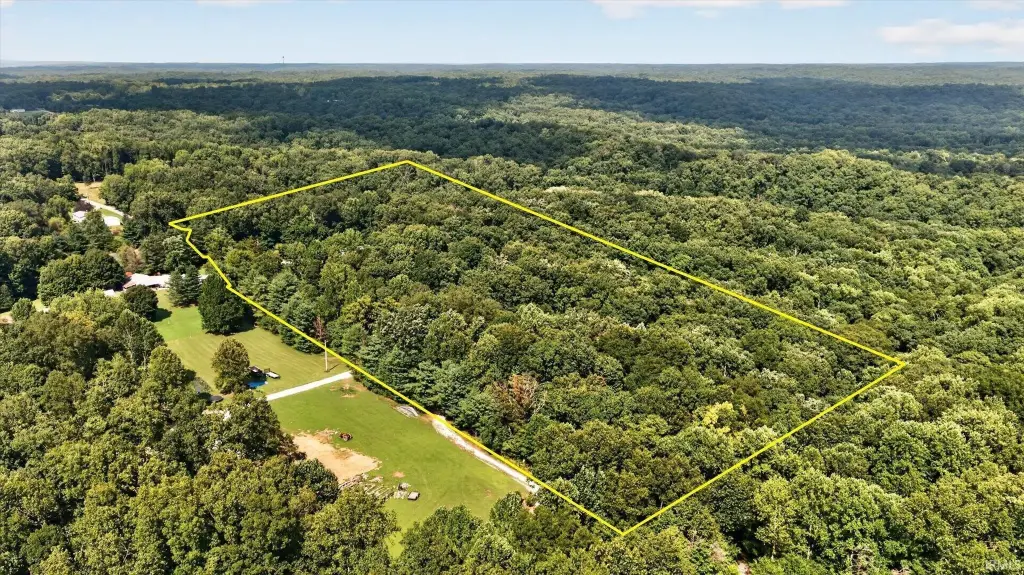
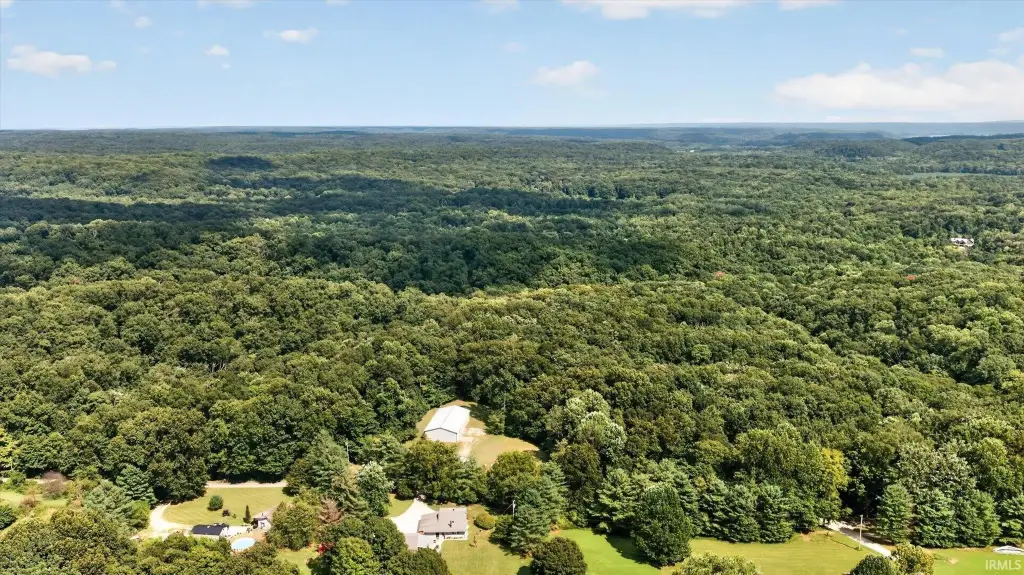
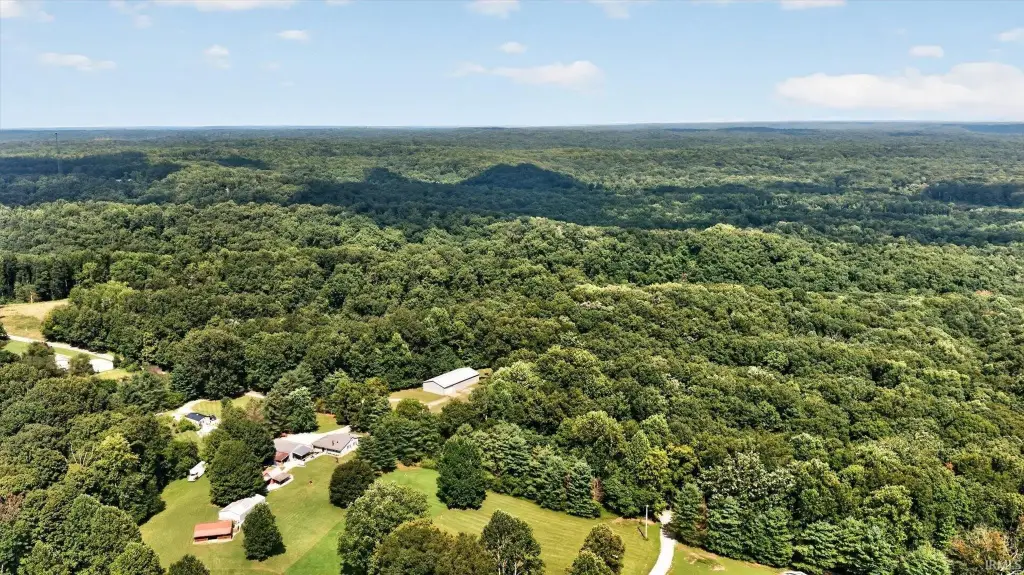
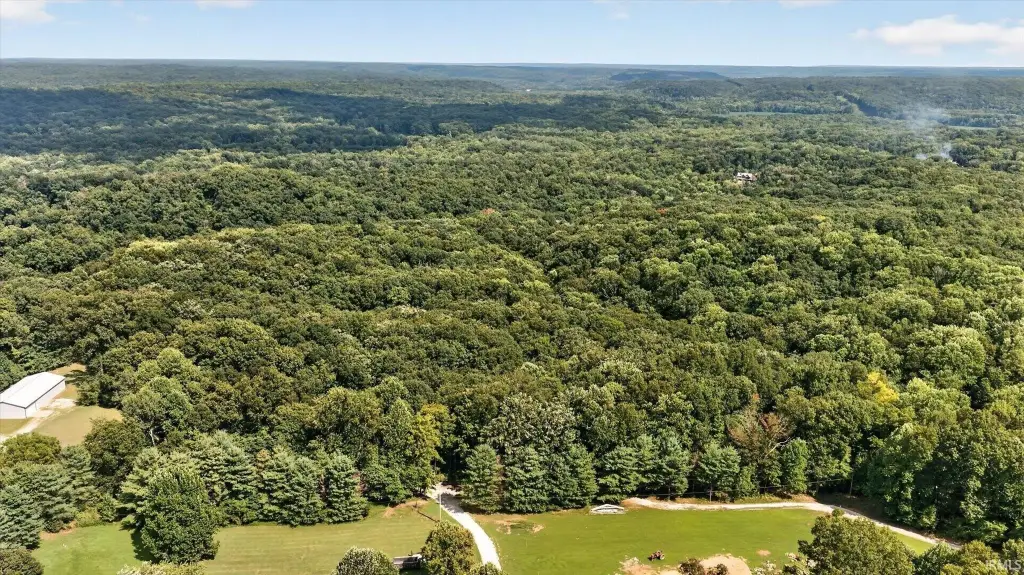
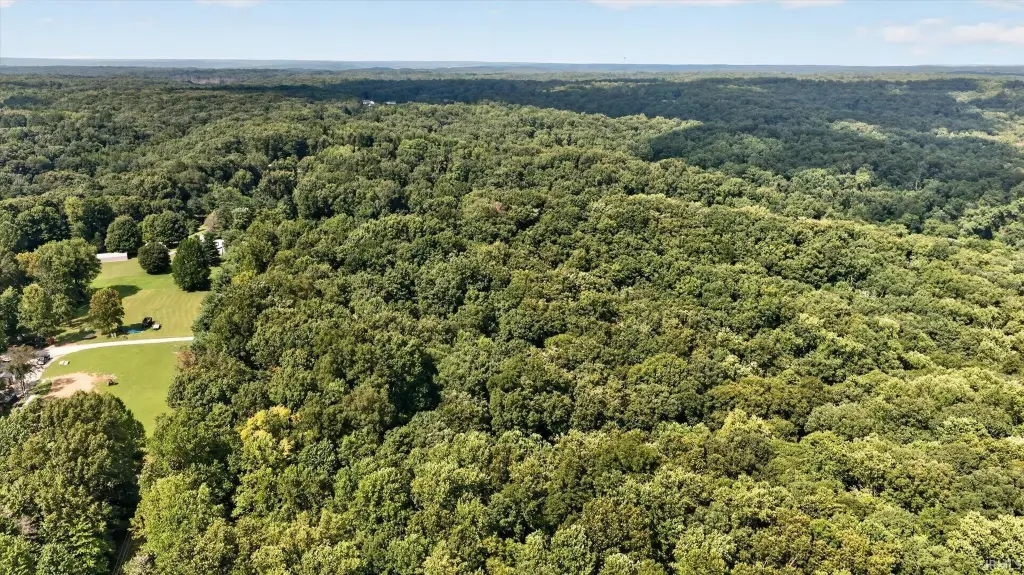
Heavily Wooded, Rolling, Ravine, 15+, Rural, Pole Barn
Elementary school
Marlin
Middle school
Tri-North
High school
Bloomington North
Elementary school district
Monroe County Community School C
Middle school district
Monroe County Community School C
High school district
Monroe County Community School C
Directions
Take Old State Rd 37 to E Anderson Rd. Turn Right onto E Anderson Rd. Turn Left onto N Lydy Rd. N Lydy Rd turns slightly left and becomes N Fish Rd. Property is on the right.
Subdivision
Monroe County
Standard status
Active
APN
53-02-24-200-011.000-017
Lot size
15.75 Acres
Taxes and HOA fees
Tax Year
2026
Tax Description
PT NW NW 24-10-1W 11.23A PLAT 1 (10.85A CFLW) Pt Sw Sw 13-10-1W 4.52A Plat 54 (4.1 A Classified Forest)
Tax Annual Amount
1053
Legal Description
PT NW NW 24-10-1W 11.23A PLAT 1 (10.85A CFLW) Pt Sw Sw 13-10-1W 4.52A Plat 54 (4.1 A Classified Forest)
Listing Agency:
Keller Williams - Indy Metro South LLC
(317) 882-5900
Listed By:
Micah Heath · License #RB23001214
(812) 760-0083
Added: Aug 18
Changed: Aug 20
Last Checked: Oct 7 at 6:06AM
MLS# 202633799
Copyright © 2026 Indiana Uplands Realtor® Association. All rights reserved. All information provided by the listing agent/broker is deemed reliable but is not guaranteed and should be independently verified.
Investment Insights
Based on property information with market context.
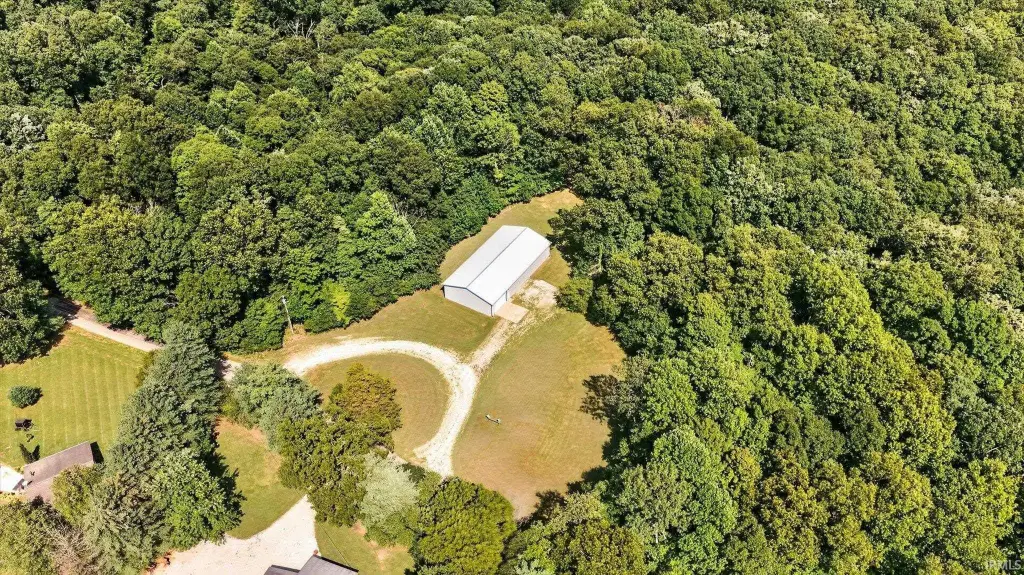
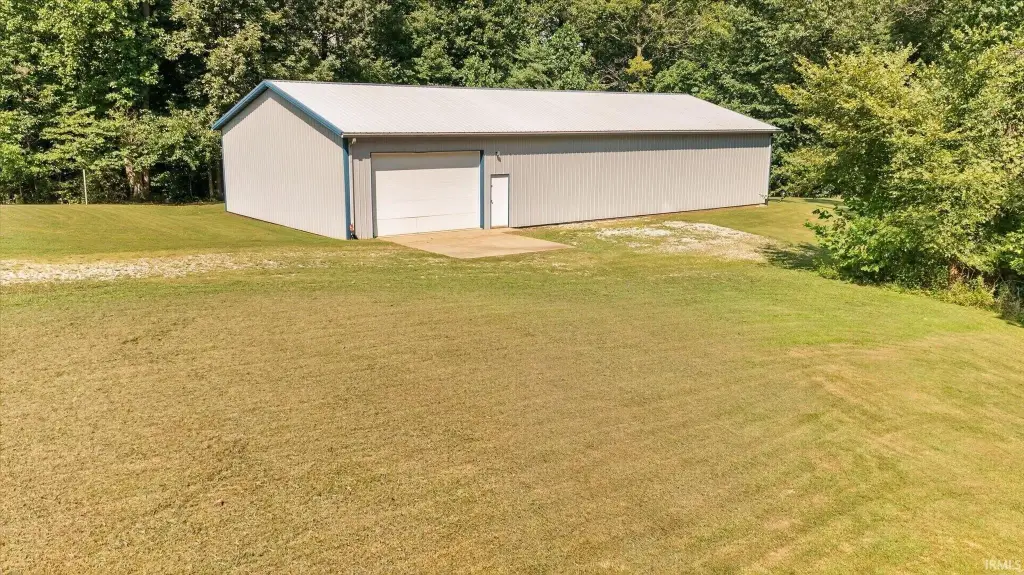
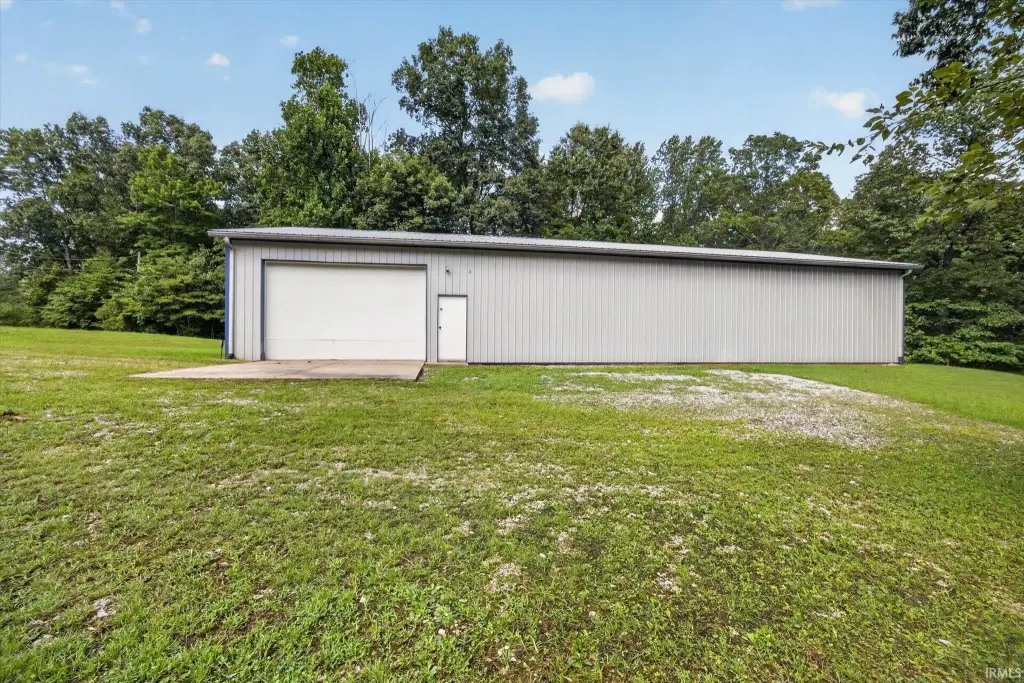
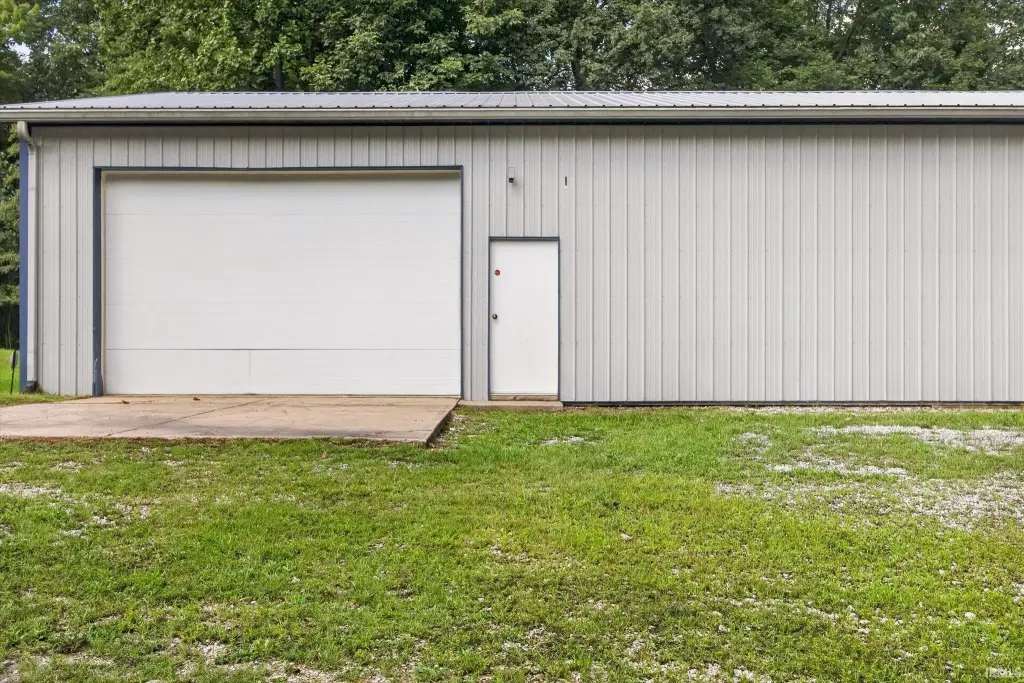
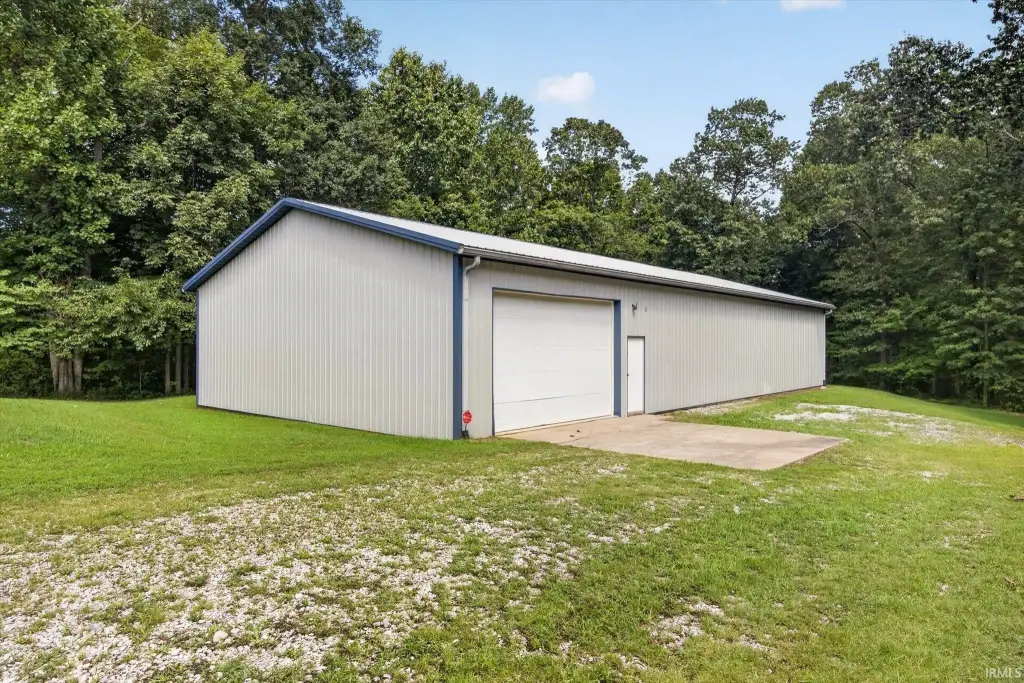
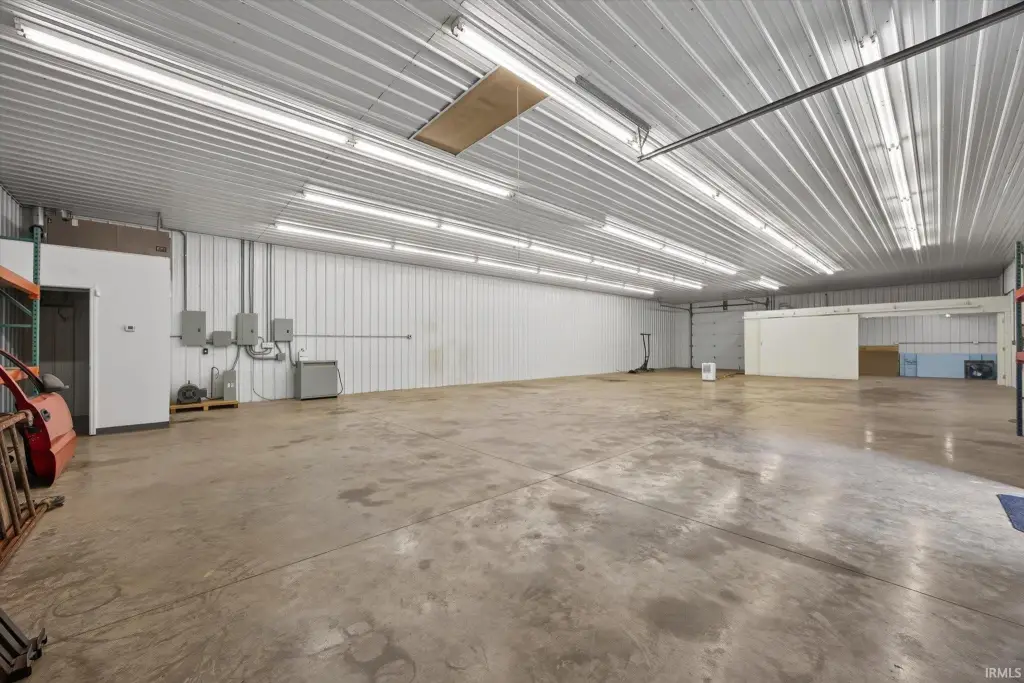
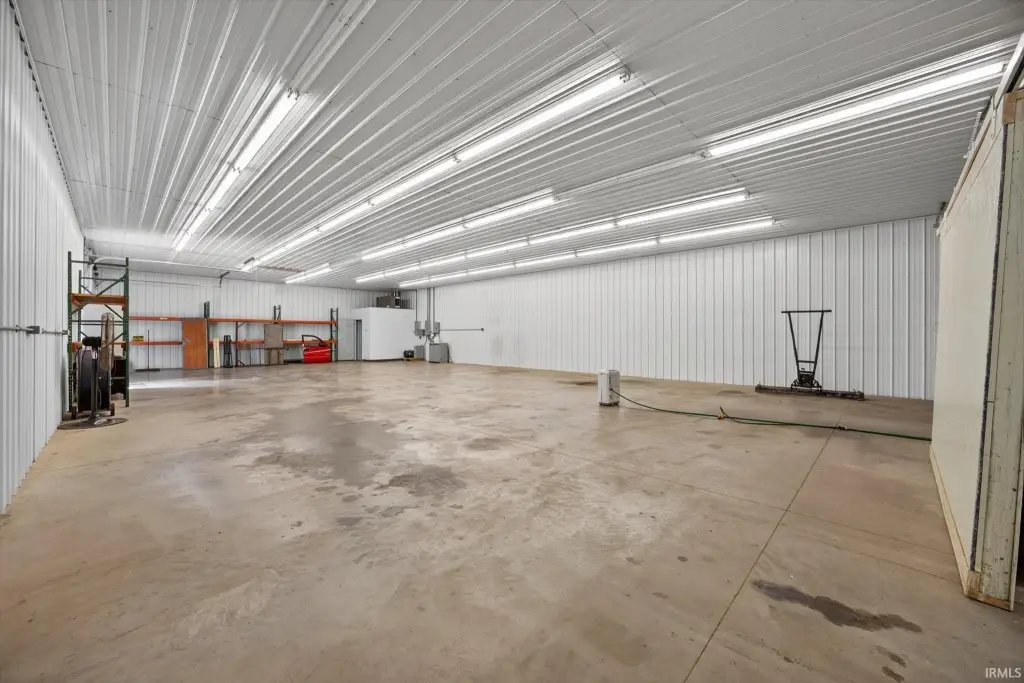
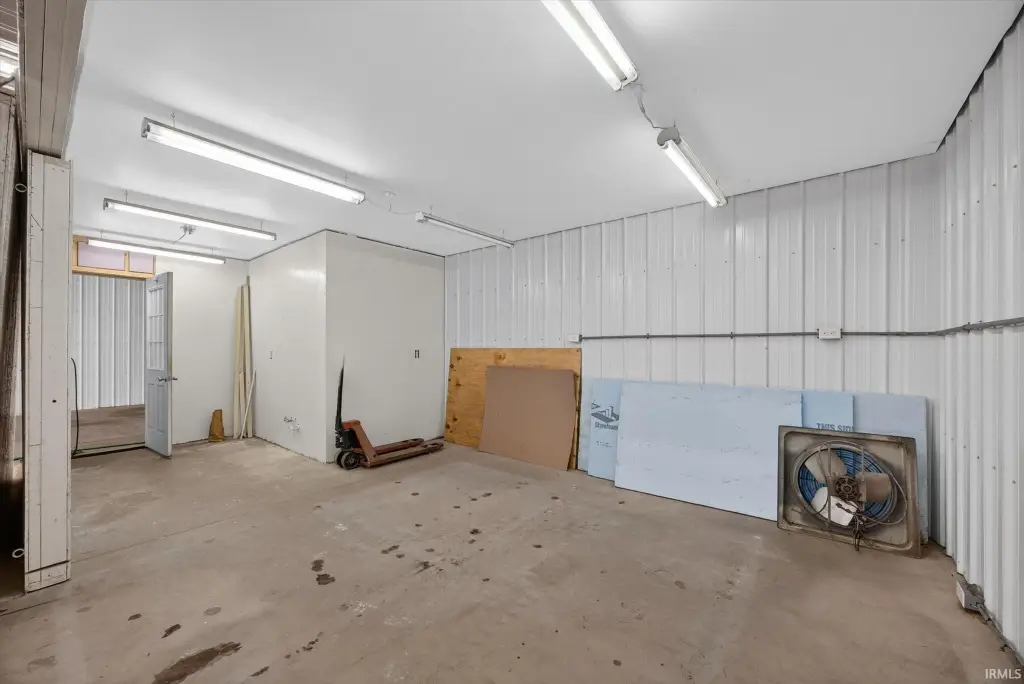
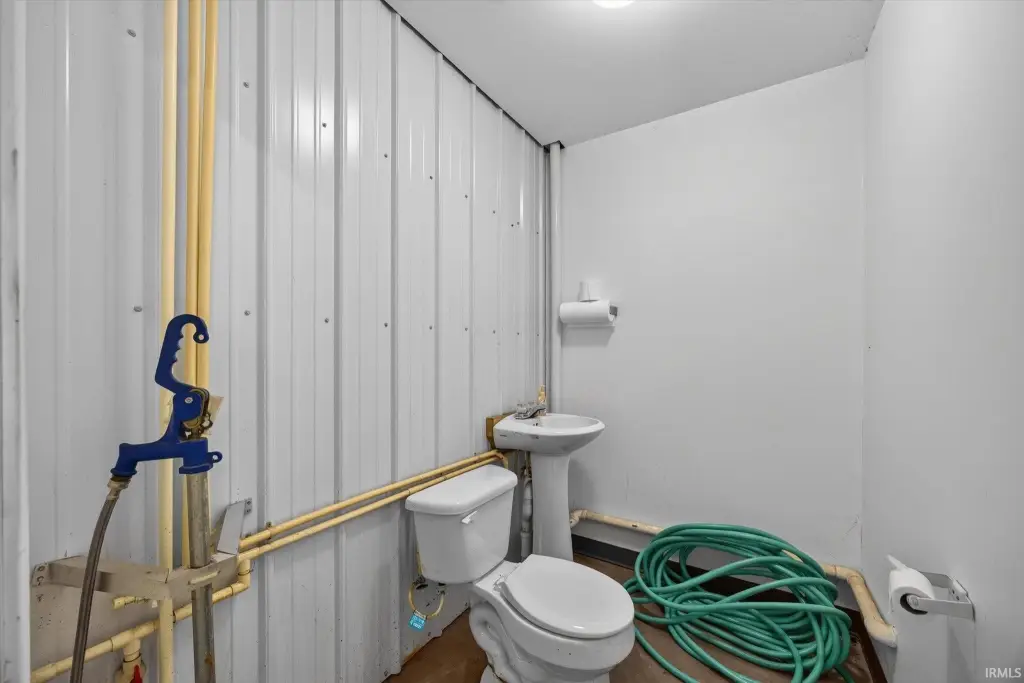
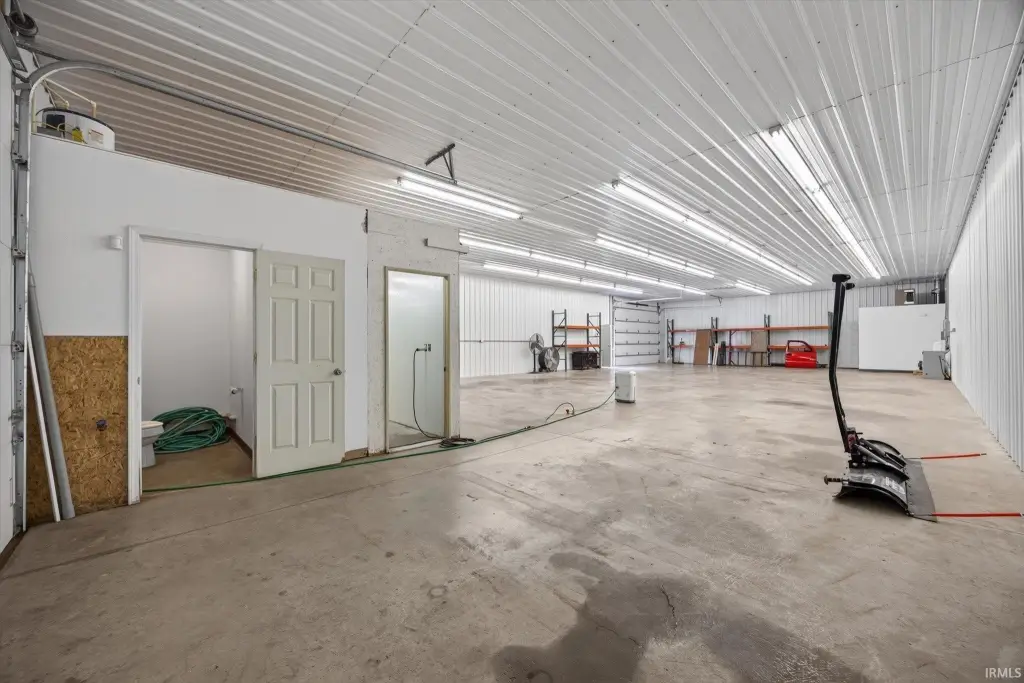
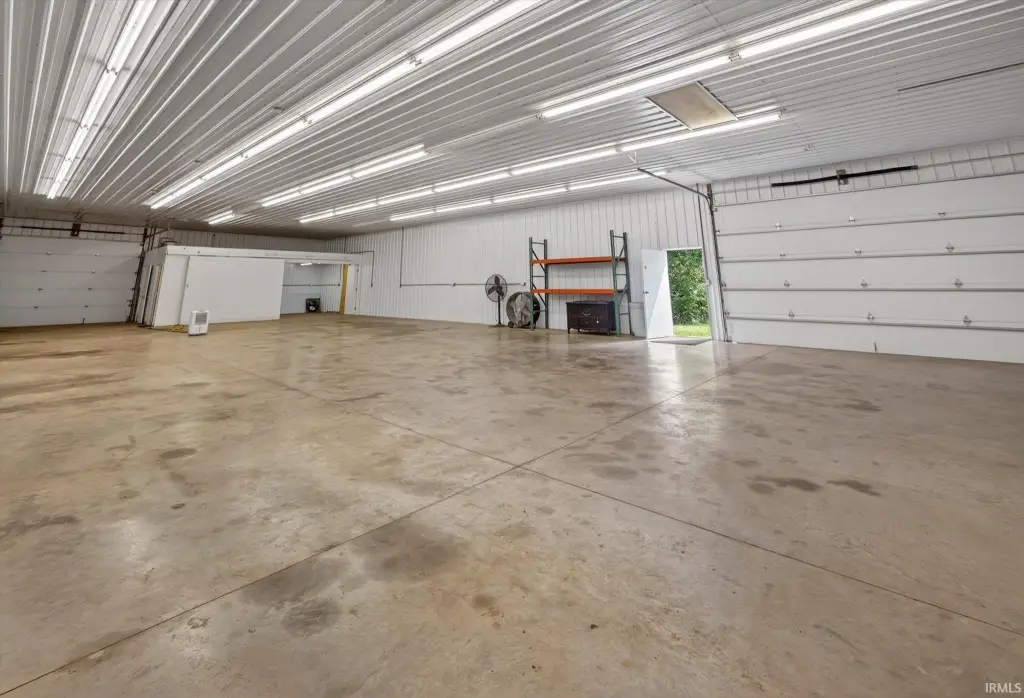
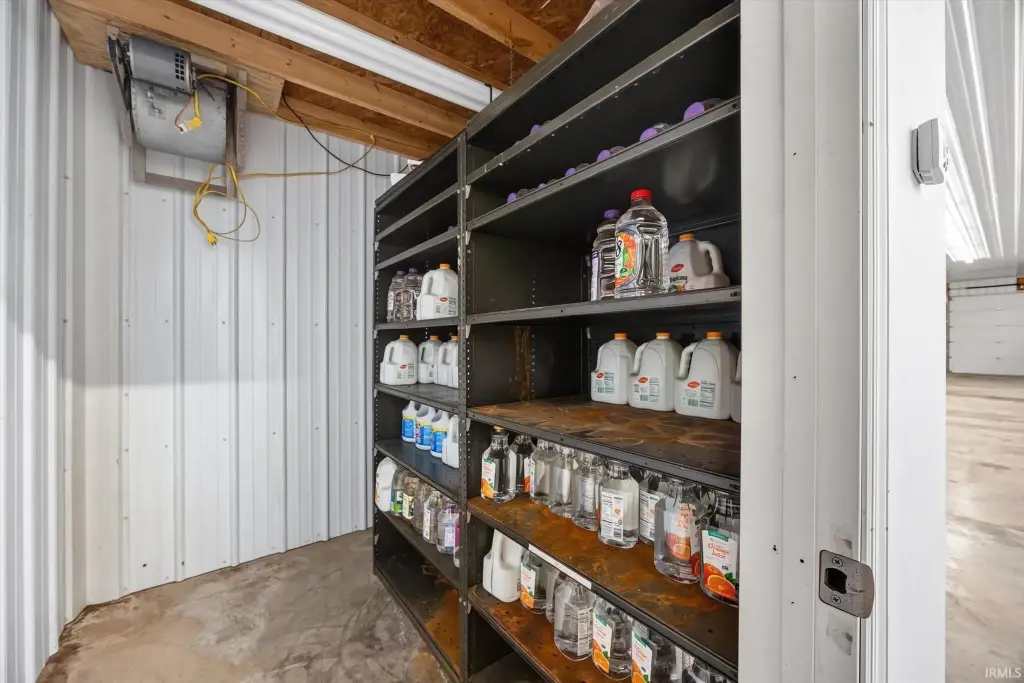
The property includes a 40' x 80' insulated and finished shop with 12' ceilings, sheet-metal interior walls, fluorescent lighting, and 400-amp electrical service. Power options include 220V single-phase, 220V three-phase, and 440V three-phase capabilities, supported by a 40 HP rotary motor, phase converter, and step-up transformer. The building also contains an electric furnace, half bath, city water, a Presby septic system, and two sets of industrial storage racking. Equipment documentation is available.
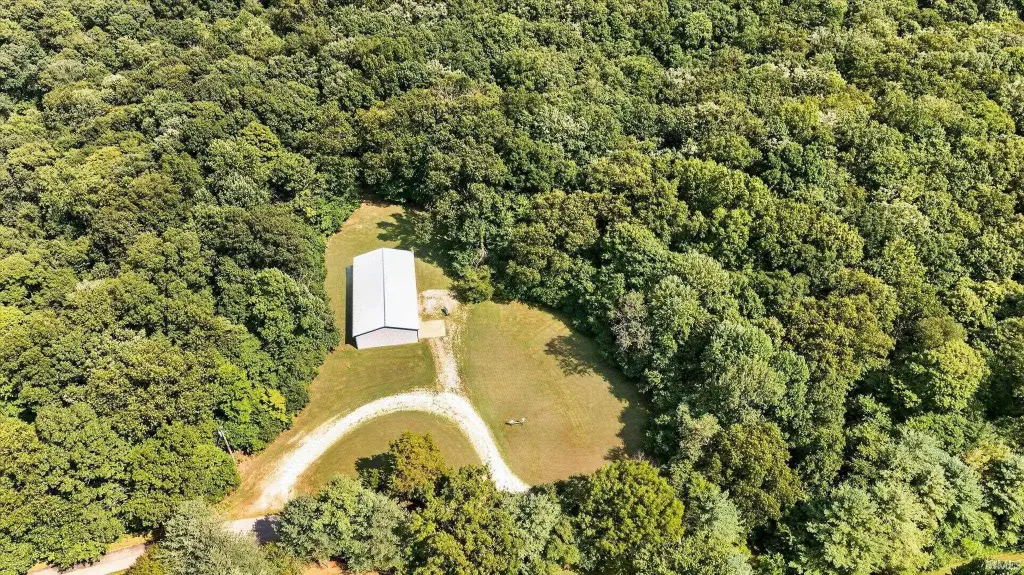
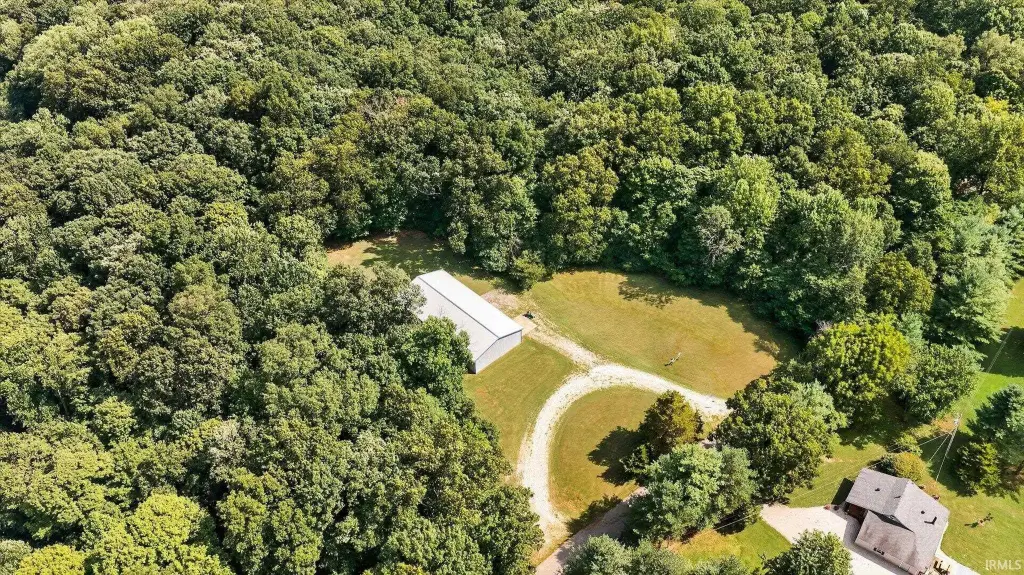
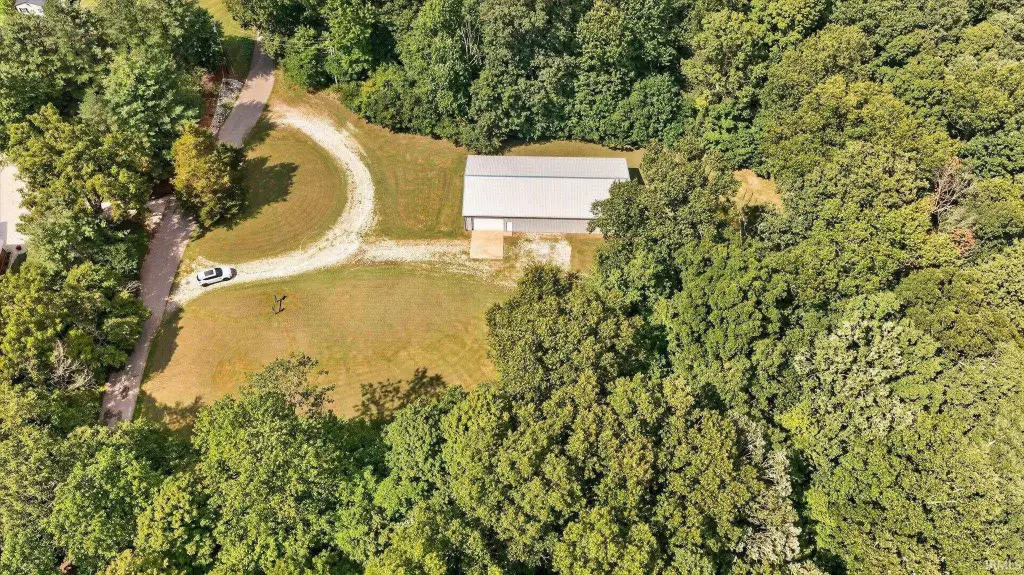
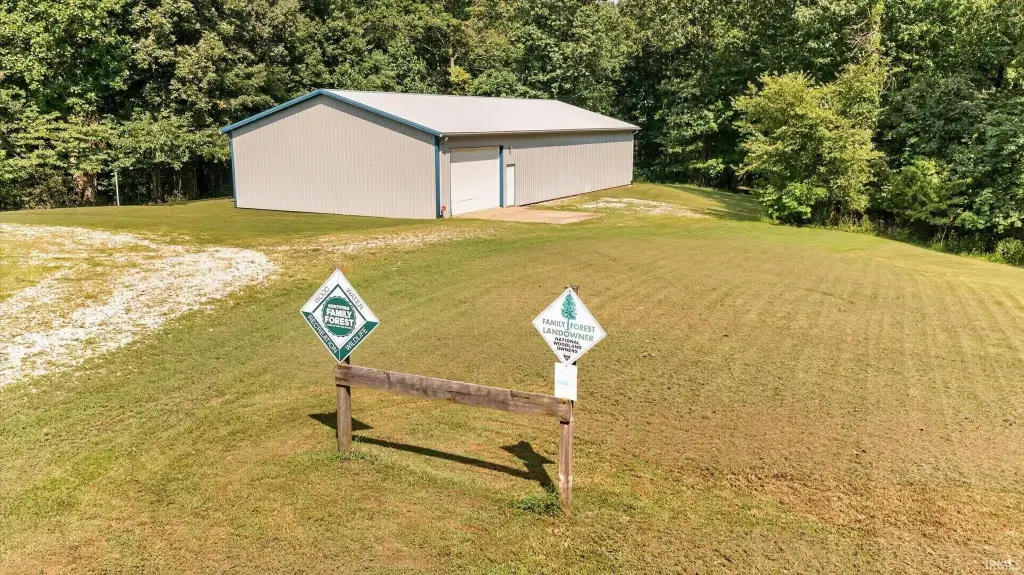
The 15.75-acre tract combines wooded acreage with approximately four acres of certified forest. Two potential homesites have utilities readily accessible. Additional property features include a Smithville security system with door monitoring and two motion sensors, a LeafFilter gutter system installed in 2025 with a transferable lifetime warranty, and professional termite treatment completed in April 2024 with a five-year warranty.
The 15.75-acre tract combines wooded acreage with approximately four acres of certified forest. Two potential homesites have utilities readily accessible. Additional property features include a Smithville security system with door monitoring and two motion sensors, a LeafFilter gutter system installed in 2025 with a transferable lifetime warranty, and professional termite treatment completed in April 2024 with a five-year warranty.
Key Highlights
- 40' x 80' insulated and finished shop with 12' ceilings
- 400‑amp service with 220V and 440V three‑phase capabilities
- 15.75 acres, including approximately four acres of certified forest
Financial Insights
Estimated NOI and Cap Rate
NOI / Yr
$22,975
Cap Rate
4.89%
Suggested Prices Based on Cap Rates
Cap Rate 5%
$459,500
$459.5K
Cap Rate 7%
$328,214
$328.2K
Cap Rate 9%
$255,278
$255.3K
Market Conditions
NOI Build-Up for 3,200 SF
Gross rent
$30.3K $9.48/SF
− Vacancy
−$3.3K −$1.03/SF
EGI
$27.0K $8.45/SF
− OpEx
−$4.1K −$1.27/SF
NOI
$23.0K $7.18/SF
Area
Monroe County, IN
Vacancy
10.90%
Lease Rate
$9.48 /SF/Yr
Expense Ratio
15.00%
Simulate Cap Rate and NOI
Suggested Prices Based on Cap Rates
Cap Rate 5%
$459,500
Cap Rate 7%
$328,214
Cap Rate 9%
$255,278
Alternative Uses
Best Use
Warehouse
$328.2K
$287.2K – $382.9K
NOI $22,975 @ 7.0% cap · market cap 4.89%
Second Best
Industrial
$270.3K
$236.5K – $315.4K
NOI $18,921 @ 7.0% cap · market cap 4.03%
Theoretical Best
Office A
$625.4K
$547.2K – $729.6K
NOI $43,778 @ 7.0% cap · market cap 9.32%
Zoning and permitted uses should be independently verified with authorities.
Property Analytics
Unlock full access to Insights
Subscribe to Realmo Intelligence
Open Analytics
Current Use
Lease Details
12 ft
Clear height
Yes
Heavy power
Yes
Utilities to site
Location Intelligence
Trade Area within ½ mile
1
Businesses Nearby
Explore this area
Business Placement
Demographics for 47408, IN
22,917
Population
10,456
Households
2.2
Avg Household Size
28
Median Age
59%
College-Educated
98%
High-School Grad
64.4 sq mi
ZIP Area
356
Density / Sq Mi
$45,584
Median Household Income
$15,819
Median Earnings
$1,177
Median Rent
$304,600
Median Home Value
Check the figures for this property
Cap Rate, Value Estimation, Potential NOI and more
View Realmo Analytics
Market
Vacancy Rate% for Industrial in Midwest region

Questions? Ask Rey
Realmo’s AI knows this listing — price, zoning, demand, history. Ask anything.







Frequently Asked Questions
What type of property is this?
Manufacturing property - Finished industrial building with three-phase power, storage racking, and essential support facilities on a wooded acreage tract.
Where is this manufacturing property located?
The property is located at 8550 N Fish Road Bloomington, IN.
What is the asking price?
The asking price for this property is $469,900.
What are key features of this property?
This property features: 40' x 80' insulated and finished shop with 12' ceilings; 400‑amp service with 220V and 440V three‑phase capabilities; 15.75 acres, including approximately four acres of certified forest