Renovated 3-Unit Brick
For Sale
Contact for pricing
8511 Flower Avenue, Takoma Park, MD 20912
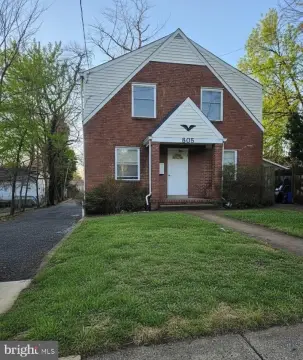
Newly renovated three-unit residential income property with separate entrances, utilities, and attached three-bay garage parking.
Property Size2,712 SF
Price / SF$351.03
Days on Market127
Property Features for 8511 Flower Avenue
General Information
Standard status
Active
Size
2,712 SF
Property subtype
Multifamily
Additional Details
Multifamily Units
3
Building Details
Year Built
1939
Year Renovated
2025
Buildings
1
Units
3
Tenancy
Multi
Listing Agency:
Perennial DMV
Listed By:
Marci Wasserman · License #SP98377021
Source:
Crexi
Added: Jun 2
Changed: Sep 8
Last Checked: Oct 5 at 6:10PM
Displayed information is deemed reliable but is not guaranteed and should be independently verified. All listing content including descriptions, pricing, images are the copyrighted material of Perennial DMV
Investment Insights
Based on property information with market context.
This solid brick colonial has been newly renovated and is configured as three independent apartments. The main and upper-level units each feature two bedrooms and one full bath, with freshly painted interiors, new luxury vinyl plank flooring, recessed lighting with updated fixtures, and quartz kitchens. Each of these units also includes stainless steel appliances, combo washer/dryer units, fireplaces, and updated bathrooms, along with a bright living room and a separate dining room.
The lower level offers a one-bedroom, one-bath apartment with a private entrance. It includes new flooring, a granite eat-in kitchen, a spacious storage room with a separate washer and dryer, and access to a private patio. All three units are separately metered for gas and electricity, supporting independent living and leasing arrangements. A detached three-bay garage provides parking and storage, with one bay designated for each unit.
For owners seeking on-site living with rental income, this layout provides practical flexibility: occupy one unit while leasing the others. For investors, the separate metering and independent apartment configuration can simplify tenant management and reduce utility commingling. The property’s multi-family zoning supports its use as a residential income asset, with updated finishes throughout designed to support strong day-to-day livability for tenants.
The lower level offers a one-bedroom, one-bath apartment with a private entrance. It includes new flooring, a granite eat-in kitchen, a spacious storage room with a separate washer and dryer, and access to a private patio. All three units are separately metered for gas and electricity, supporting independent living and leasing arrangements. A detached three-bay garage provides parking and storage, with one bay designated for each unit.
For owners seeking on-site living with rental income, this layout provides practical flexibility: occupy one unit while leasing the others. For investors, the separate metering and independent apartment configuration can simplify tenant management and reduce utility commingling. The property’s multi-family zoning supports its use as a residential income asset, with updated finishes throughout designed to support strong day-to-day livability for tenants.
Key Highlights
- Newly renovated 3‑unit multi‑family property in Takoma Park with flexible live‑in or lease‑each setup.
- Three independent apartments: two units with 2 bedrooms and 1 full bath, plus a lower‑level 1‑bedroom, 1‑bath unit.
- Updated finishes in each unit including new flooring, recessed lighting with updated fixtures, quartz kitchens, and stainless steel appliances.
Financial Insights
Estimated NOI and Cap Rate
NOI / Yr
$51,463
Cap Rate
5.41%
Suggested Prices Based on Cap Rates
Cap Rate 5%
$1,029,260
$1.0M
Cap Rate 7%
$735,186
$735.2K
Cap Rate 9%
$571,811
$571.8K
Market Conditions
NOI Build-Up for 2,712 SF
Gross rent
$78.8K $29.04/SF
− Vacancy
−$5.2K −$1.93/SF
EGI
$73.5K $27.11/SF
− OpEx
−$22.1K −$8.13/SF
NOI
$51.5K $18.98/SF
Area
Montgomery County, MD
Vacancy
6.65%
Lease Rate
$29.04 /SF/Yr
Expense Ratio
30.00%
Simulate Cap Rate and NOI
Suggested Prices Based on Cap Rates
Cap Rate 5%
$1,029,260
Cap Rate 7%
$735,186
Cap Rate 9%
$571,811
Alternative Uses
Best Use
Multifamily LT 5
$735.2K
$643.3K – $857.7K
NOI $51,463 @ 7.0% cap · market cap 5.41%
Second Best
Apartment 5plus
$639.7K
$559.7K – $746.3K
NOI $44,778 @ 7.0% cap · market cap 4.70%
Theoretical Best
Specialty Retail
$954.0K
$834.8K – $1.11M
NOI $66,781 @ 7.0% cap · market cap 7.01%
Zoning and permitted uses should be independently verified with authorities.
Property Analytics
Unlock full access to Insights
Subscribe to Realmo Intelligence
Open Analytics
Current Use
Lease Details
3
Residential units
Multi-tenant
Tenancy
Location Intelligence
Trade Area within ½ mile
874
Businesses Nearby
Explore this area
Business Placement
Demographics for 20912, MD
25,463
Population
10,140
Households
2.5
Avg Household Size
38
Median Age
51%
College-Educated
86%
High-School Grad
2.7 sq mi
ZIP Area
9,431
Density / Sq Mi
$82,097
Median Household Income
$48,447
Median Earnings
$1,452
Median Rent
$671,400
Median Home Value
Check the figures for this property
Cap Rate, Value Estimation, Potential NOI and more
View Realmo Analytics
Market
Vacancy Rate% for Multifamily in South region

Questions? Ask Rey
Realmo’s AI knows this listing — price, zoning, demand, history. Ask anything.



Frequently Asked Questions
What type of property is this?
Triplex - Newly renovated three-unit residential income property with separate entrances, utilities, and attached three-bay garage parking.
Where is this triplex located?
The property is located at 8511 Flower Avenue Takoma Park, MD.
What is the asking price?
The asking price for this property is $952,000.
What are key features of this property?
This property features: Newly renovated 3‑unit multi‑family property in Takoma Park with flexible live‑in or lease‑each setup.; Three independent apartments: two units with 2 bedrooms and 1 full bath, plus a lower‑level 1‑bedroom, 1‑bath unit.; Updated finishes in each unit including new flooring, recessed lighting with updated fixtures, quartz kitchens, and stainless steel appliances.



