Updated Duplex with Long-Term
For Sale
$335,000
8430-32 Jeannette Street, New Orleans, LA 70118
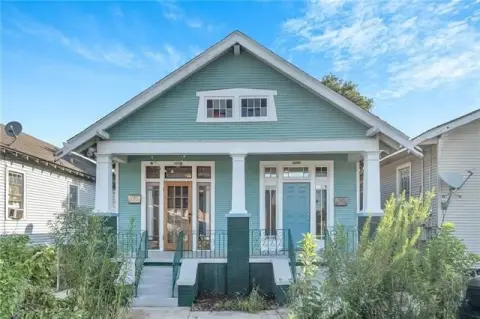
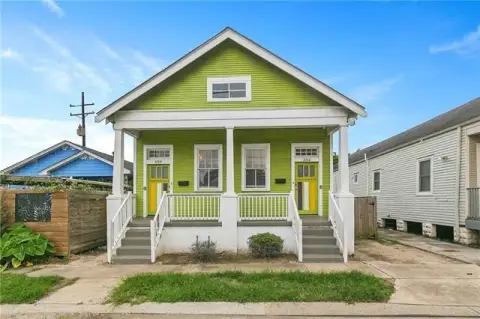
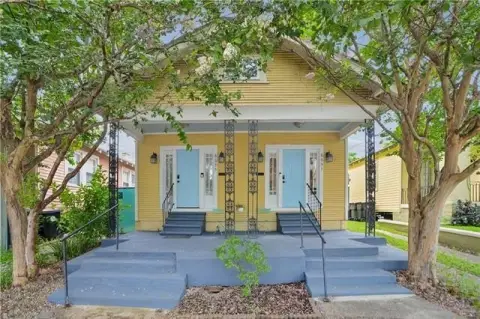
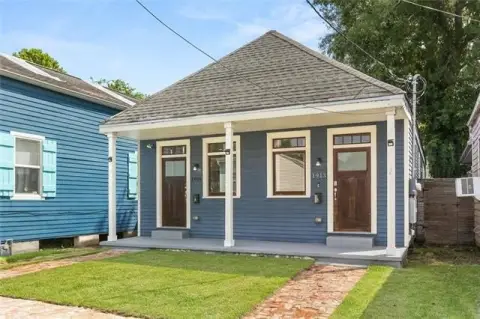
Occupied duplex with central air, recent updates, and access to public transportation, restaurants, and neighborhood shops.
Property Size1,561 SF
Price / SF$214.61
Days on Market232
Property Features for 8430-32 Jeannette Street
General Information
Standard status
Active
Size
1,561 SF
Property subtype
MULTI FAMILY FOR SALE / Townhouse
Additional Details
Public Transit
Yes
Multifamily Units
2
Amenities
Central Air
Central
1
2
4
in unit
Asphalt
Other
Pillar/Post/Pier
Vinyl Siding
Building Details
Year Built
1963
Listing Agency:
eXp Realty, LLC
Listed By:
Lauren Lawson · License #995704895
(504) 452-8439
Source:
Compass
Added: Mar 2
Changed: Oct 18
Last Checked: Oct 19 at 9:13AM
Displayed information is deemed reliable but is not guaranteed and should be independently verified. All listing content including descriptions, pricing, images are the copyrighted material of eXp Realty, LLC

Ask AI about this property
Review the available facts, identify missing information and prepare questions for the agent.
Investment Insights
Based on property information with market context.
This two-unit residential property offers 1,561 square feet with long-term tenants in place. Recent updates, central air, vinyl siding, and a pier-and-post foundation support practical ongoing use, while asphalt surfaces contribute to straightforward exterior maintenance. Constructed in 1963, the property is located in the X Flood Zone.
The address is near S. Carrollton and Oak Street in New Orleans, with walkable access to public transportation, restaurants, and local shops. Its existing occupancy and two-unit configuration provide a clearly defined residential income property profile.
The address is near S. Carrollton and Oak Street in New Orleans, with walkable access to public transportation, restaurants, and local shops. Its existing occupancy and two-unit configuration provide a clearly defined residential income property profile.
Key Highlights
- Two‑unit property with 1,561 square feet
- Long‑term tenants currently in place
- Recently updated with central air
Financial Insights
Estimated NOI and Cap Rate
NOI / Yr
$19,766
Cap Rate
5.90%
Suggested Prices Based on Cap Rates
Cap Rate 5%
$395,320
$395.3K
Cap Rate 7%
$282,371
$282.4K
Cap Rate 9%
$219,622
$219.6K
Market Conditions
NOI Build-Up for 1,561 SF
Gross rent
$30.9K $19.80/SF
− Vacancy
−$2.7K −$1.71/SF
EGI
$28.2K $18.09/SF
− OpEx
−$8.5K −$5.43/SF
NOI
$19.8K $12.66/SF
Area
New Orleans, LA
Vacancy
8.64%
Lease Rate
$19.80 /SF/Yr
Expense Ratio
30.00%
Simulate Cap Rate and NOI
Suggested Prices Based on Cap Rates
Cap Rate 5%
$395,320
Cap Rate 7%
$282,371
Cap Rate 9%
$219,622
Alternative Uses
Best Use
Multifamily LT 5
$282.4K
$247.1K – $329.4K
NOI $19,766 @ 7.0% cap · market cap 5.90%
Second Best
Apartment 5plus
$259.5K
$227.1K – $302.8K
NOI $18,168 @ 7.0% cap · market cap 5.42%
Theoretical Best
Office A
$396.8K
$347.2K – $462.9K
NOI $27,773 @ 7.0% cap · market cap 8.29%
Zoning and permitted uses should be independently verified with authorities.
How Realmo checks its estimates
Property Analytics
Lease Details
2
Residential units
Location Intelligence
Trade Area within ½ mile
1,185
Businesses Nearby
Explore this area
Business Placement
Demographics for 70118, LA
35,635
Population
15,464
Households
2.3
Avg Household Size
31
Median Age
54%
College-Educated
92%
High-School Grad
4.6 sq mi
ZIP Area
7,747
Density / Sq Mi
$62,665
Median Household Income
$28,199
Median Earnings
$1,257
Median Rent
$451,600
Median Home Value
Market
Vacancy Rate% for Multifamily in South region

Frequently Asked Questions
What type of property is this?
Duplex - Occupied duplex with central air, recent updates, and access to public transportation, restaurants, and neighborhood shops.
Where is this duplex located?
The property is located at 8430-32 Jeannette Street New Orleans, LA.
What is the asking price?
The asking price for this property is $335,000.
What are key features of this property?
This property features: Two‑unit property with 1,561 square feet; Long‑term tenants currently in place; Recently updated with central air