Updated Historic Triplex with
For Sale
$500,000
835 Tremont St, Chattanooga, TN 37405
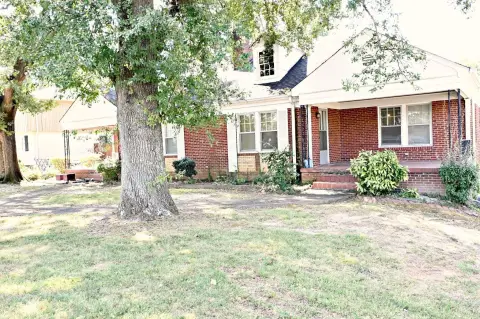
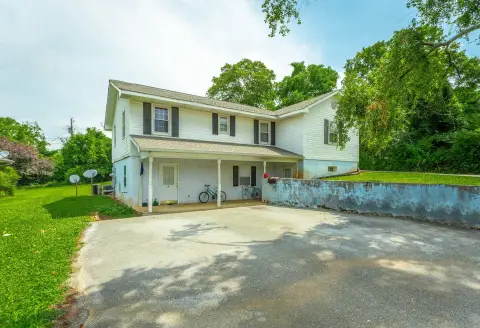
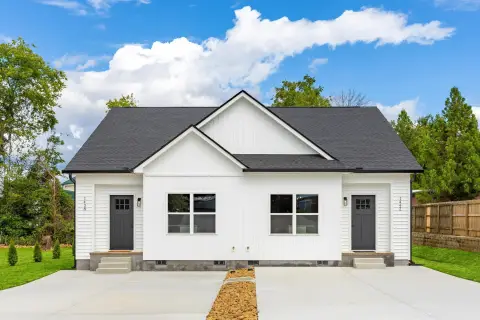
Three distinctive rental units with private parking, basement storage, and a walkable North Chattanooga setting.
Property Size2,953 SF
Price / SF$169.32
Days on Market52
Property Features for 835 Tremont St
General Information
Standard status
Active
Size
2,953 SF
Property subtype
Residential Income
Units
Unit Mix
2 x 1BR/1BA, 1 x 2BR/2BA
Multifamily Units
3
Additional Details
Road Access
Yes
Amenities
stackable washer/dryer
covered front porch
loft storage
private rear deck
firepit area
basement storage
Building Details
Year Built
1920
Buildings
1
Listing Agency:
Real Broker
Listed By:
Corey Ballew 4235290696 · License #332263
(423) 326-6488
Source:
Searchtnhomesforsale
Added: Sep 3
Changed: Oct 1
Last Checked: Oct 23 at 7:03AM
Displayed information is deemed reliable but is not guaranteed and should be independently verified. All listing content including descriptions, pricing, images are the copyrighted material of Real Broker

Ask AI about this property
Review the available facts, identify missing information and prepare questions for the agent.
Investment Insights
Based on property information with market context.
Built in 1920, this historic triplex contains three updated residential units created from a former neighborhood general store. Unit A offers 1BR/1BA, a stackable W/D, and a covered front porch. Unit B provides 2BR/2BA, 14' ceilings, two loft storage areas, and a stackable W/D. Unit C includes 1BR/1BA, W/D hookups, a private rear deck, and a firepit area. Major systems have been updated, and the property has a TPO roof.
The property is located at the corner of Tremont Street and Mississippi Avenue in Chattanooga, with private rear parking accessed from Boylston Street, curbside parking, a detached garage, and dry basement storage. Normal Park Elementary and Aretha Frankenstein are one block away, while Coolidge Park, the Tennessee River, restaurants, shops, bars, and Downtown Chattanooga are within walking distance. Two units are currently occupied, and Unit A is vacant. Showings are limited to the vacant unit; tenant-occupied units may be inspected after an accepted contract.
The property is located at the corner of Tremont Street and Mississippi Avenue in Chattanooga, with private rear parking accessed from Boylston Street, curbside parking, a detached garage, and dry basement storage. Normal Park Elementary and Aretha Frankenstein are one block away, while Coolidge Park, the Tennessee River, restaurants, shops, bars, and Downtown Chattanooga are within walking distance. Two units are currently occupied, and Unit A is vacant. Showings are limited to the vacant unit; tenant-occupied units may be inspected after an accepted contract.
Key Highlights
- Three‑unit layout with 1BR/1BA, 2BR/2BA, and 1BR/1BA residences
- 1920 construction with updated major systems and a TPO roof
- Unit B features 14' ceilings and two loft storage areas
Financial Insights
Estimated NOI and Cap Rate
NOI / Yr
$28,991
Cap Rate
5.80%
Suggested Prices Based on Cap Rates
Cap Rate 5%
$579,820
$579.8K
Cap Rate 7%
$414,157
$414.2K
Cap Rate 9%
$322,122
$322.1K
Market Conditions
NOI Build-Up for 2,953 SF
Gross rent
$44.3K $15.00/SF
− Vacancy
−$2.9K −$0.98/SF
EGI
$41.4K $14.03/SF
− OpEx
−$12.4K −$4.21/SF
NOI
$29.0K $9.82/SF
Area
Chattanooga, TN
Vacancy
6.50%
Lease Rate
$15.00 /SF/Yr
Expense Ratio
30.00%
Simulate Cap Rate and NOI
Suggested Prices Based on Cap Rates
Cap Rate 5%
$579,820
Cap Rate 7%
$414,157
Cap Rate 9%
$322,122
Alternative Uses
Best Use
Multifamily LT 5
$414.2K
$362.4K – $483.2K
NOI $28,991 @ 7.0% cap · market cap 5.80%
Second Best
Apartment 5plus
$371.6K
$325.2K – $433.6K
NOI $26,015 @ 7.0% cap · market cap 5.20%
Theoretical Best
Office A
$652.2K
$570.7K – $760.9K
NOI $45,653 @ 7.0% cap · market cap 9.13%
Zoning and permitted uses should be independently verified with authorities.
How Realmo checks its estimates
Property Analytics
Contact the owner directly
Get the owner's phone numbers and email
Open Analytics
Lease Details
3
Residential units
Yes
Paved road access
Location Intelligence
Trade Area within ½ mile
544
Businesses Nearby
Explore this area
Business Placement
Demographics for 37405, TN
18,231
Population
9,959
Households
1.8
Avg Household Size
36
Median Age
53%
College-Educated
92%
High-School Grad
54.3 sq mi
ZIP Area
336
Density / Sq Mi
$77,850
Median Household Income
$51,748
Median Earnings
$1,276
Median Rent
$416,900
Median Home Value
Check the figures for this property
Cap Rate, Value Estimation, Potential NOI and more
View Realmo Analytics
Market
Vacancy Rate% for Multifamily in South region



Frequently Asked Questions
What type of property is this?
Triplex - Three distinctive rental units with private parking, basement storage, and a walkable North Chattanooga setting.
Where is this triplex located?
The property is located at 835 Tremont St Chattanooga, TN.
What is the asking price?
The asking price for this property is $500,000.
What are key features of this property?
This property features: Three‑unit layout with 1BR/1BA, 2BR/2BA, and 1BR/1BA residences; 1920 construction with updated major systems and a TPO roof; Unit B features 14' ceilings and two loft storage areas


