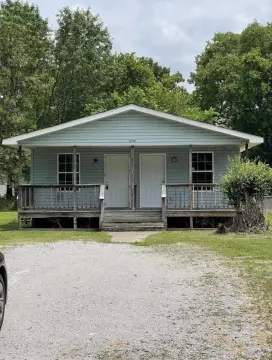
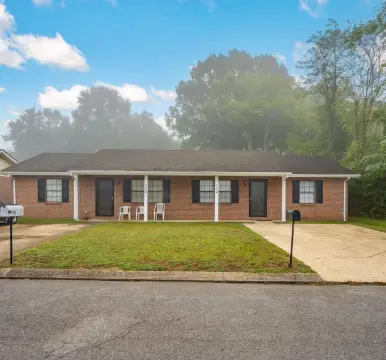
Brick Duplex with Occupied
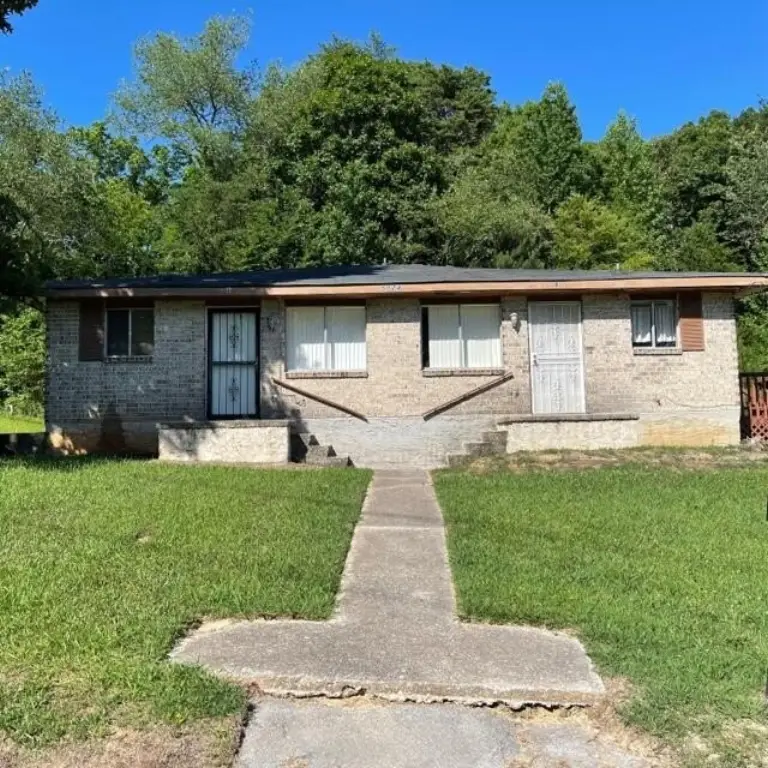
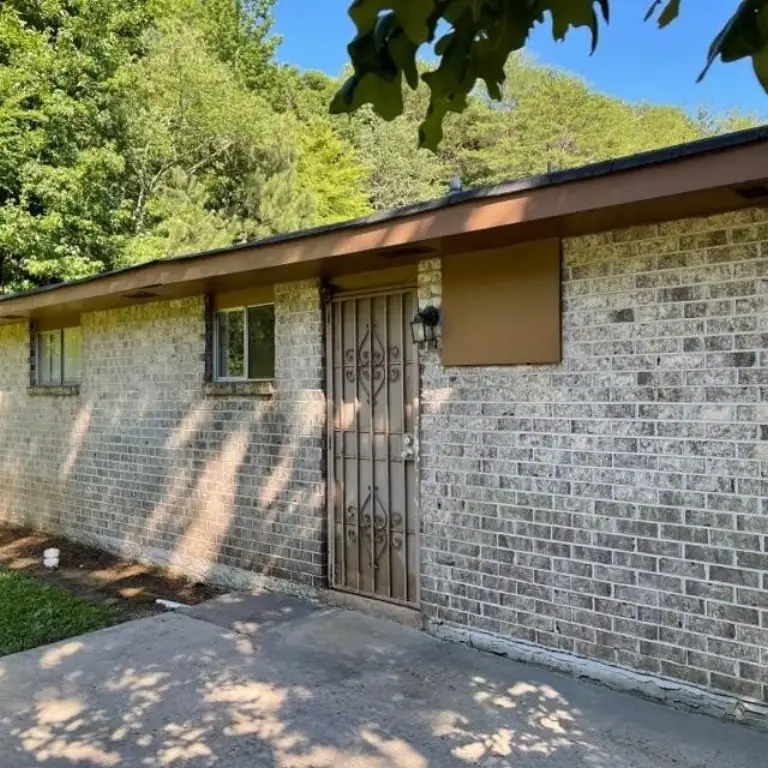
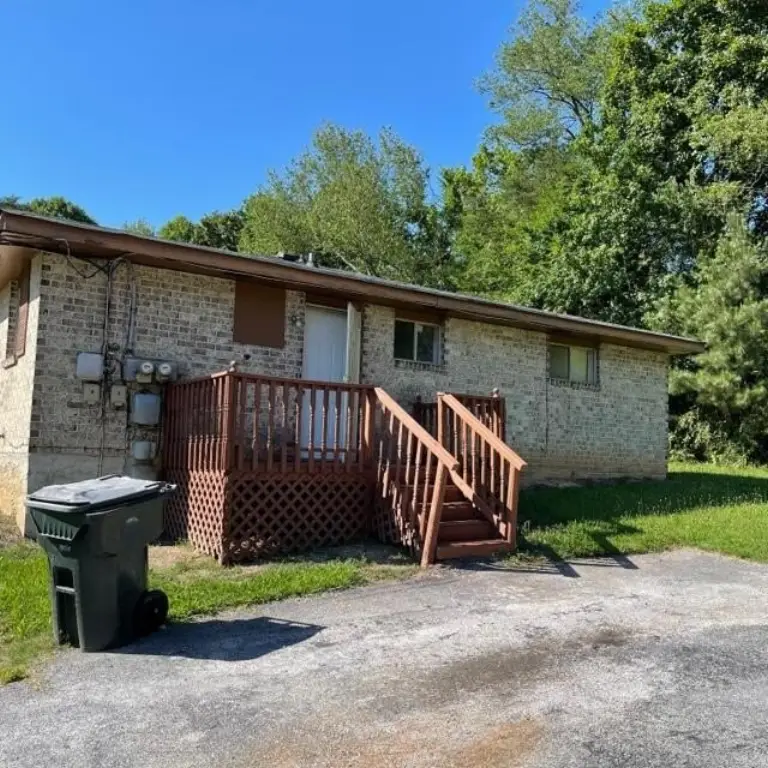
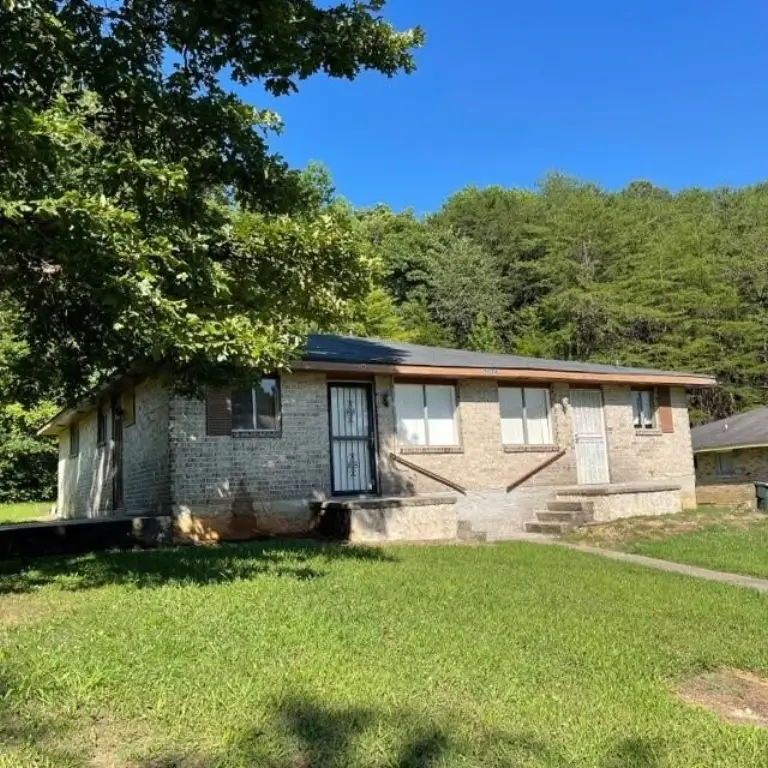
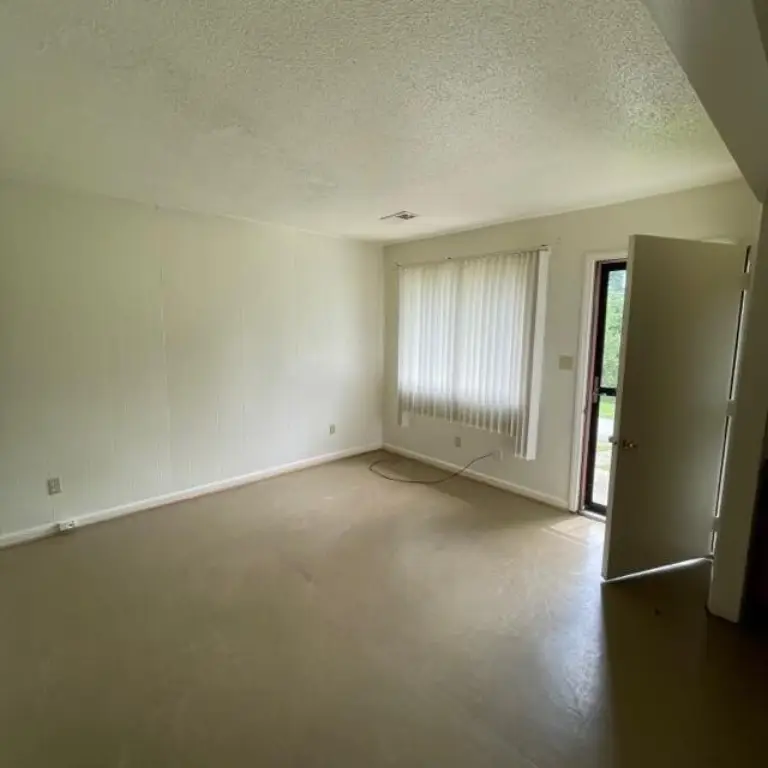
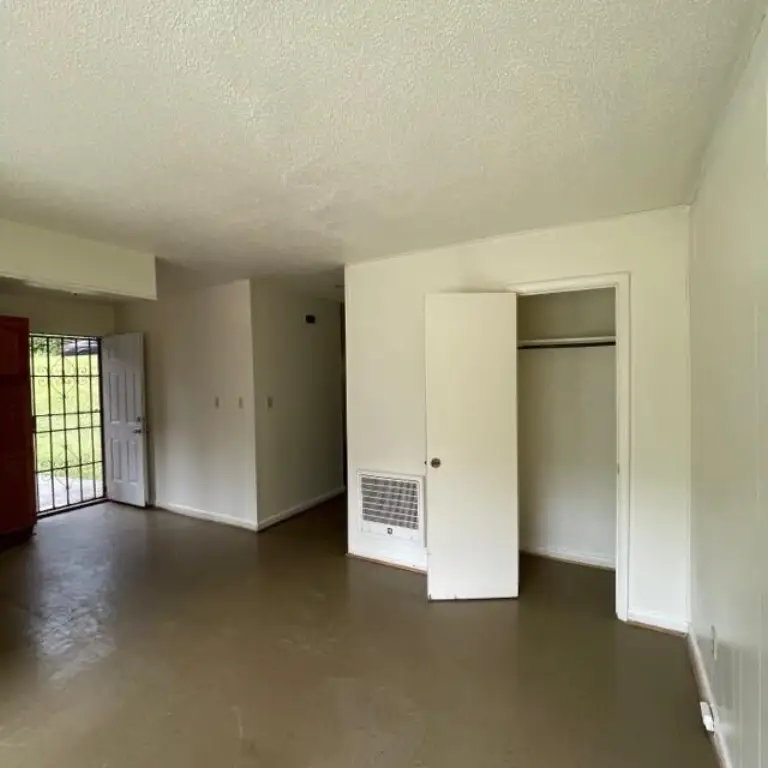
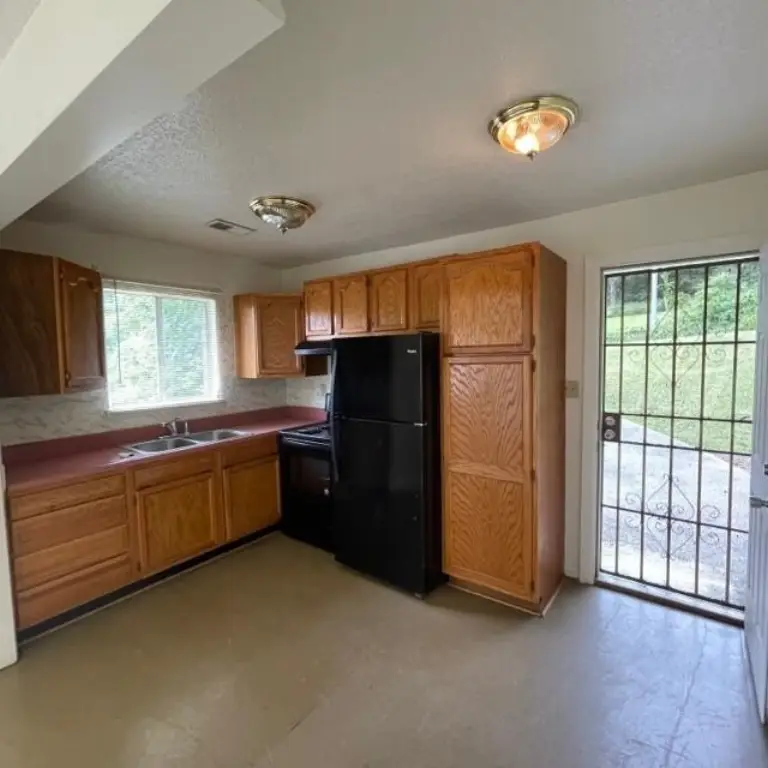
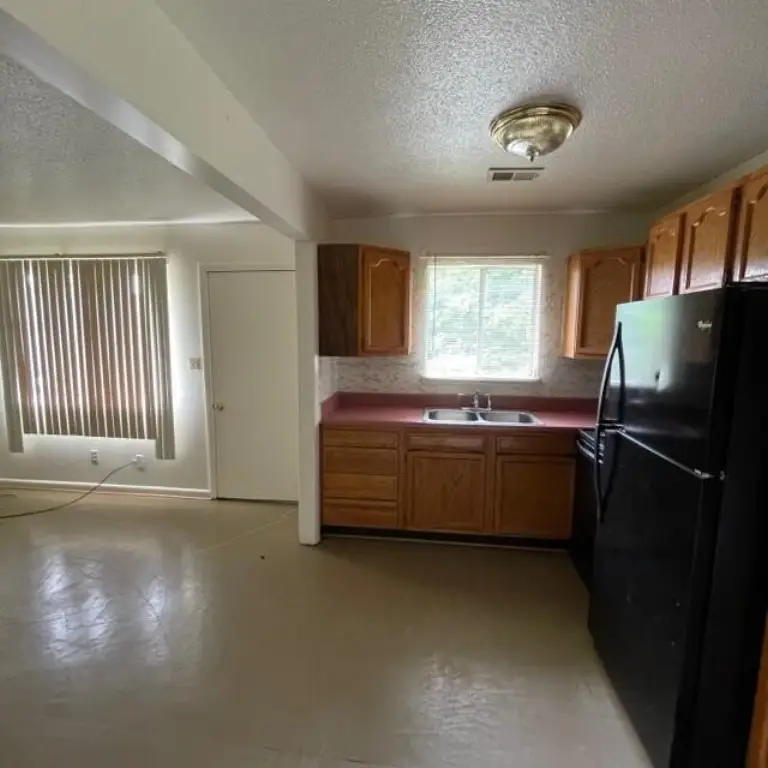
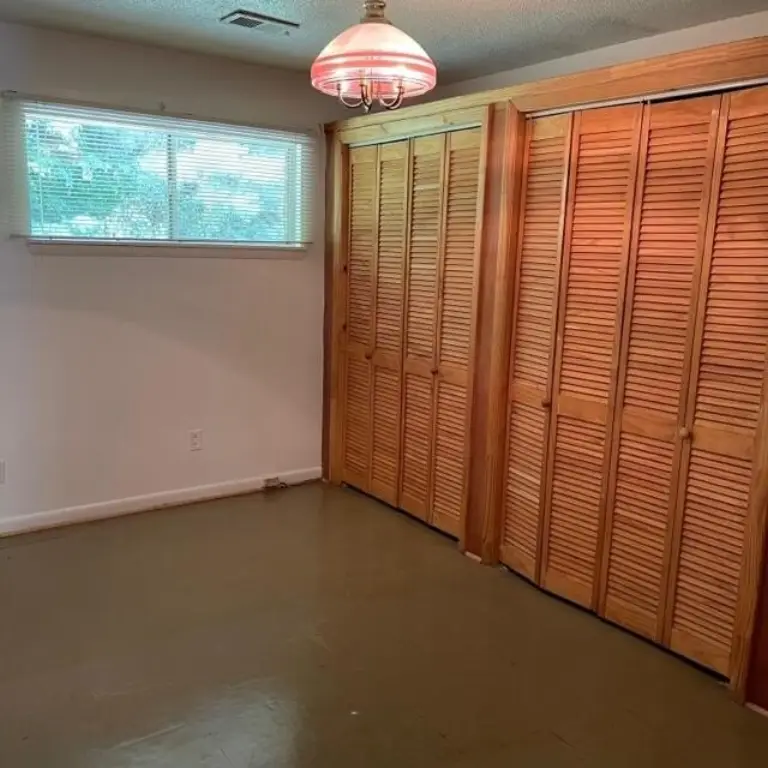
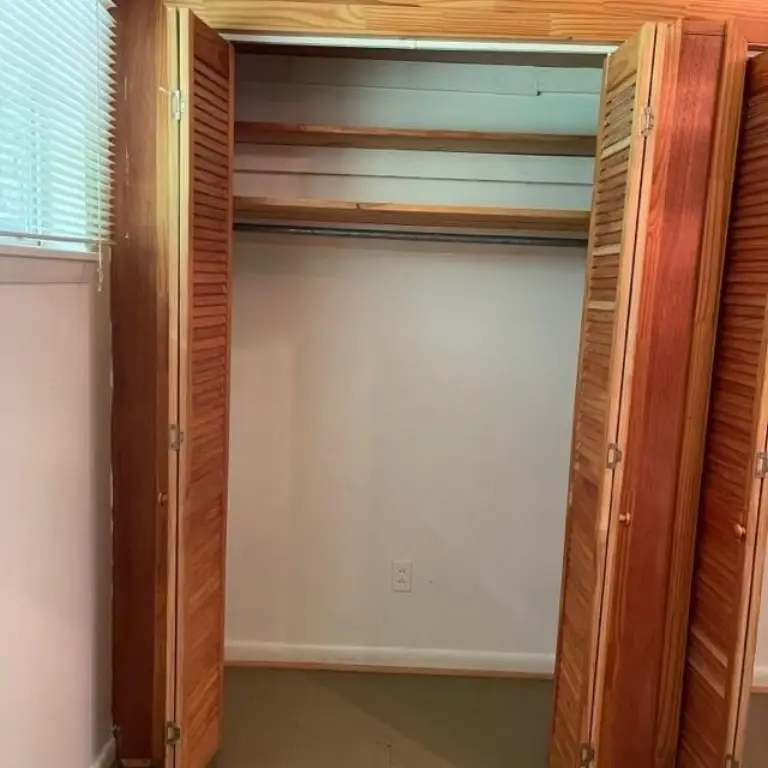
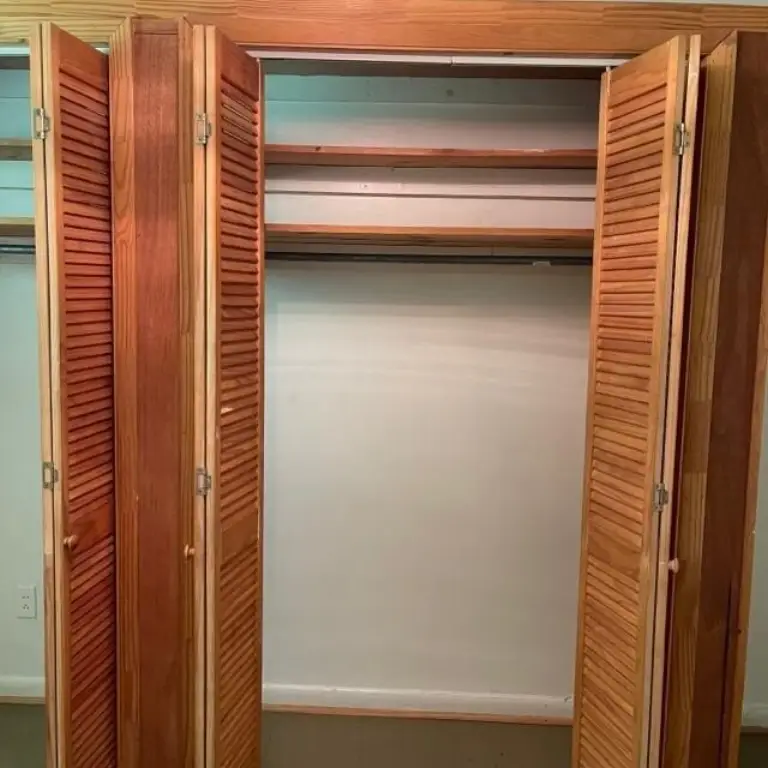
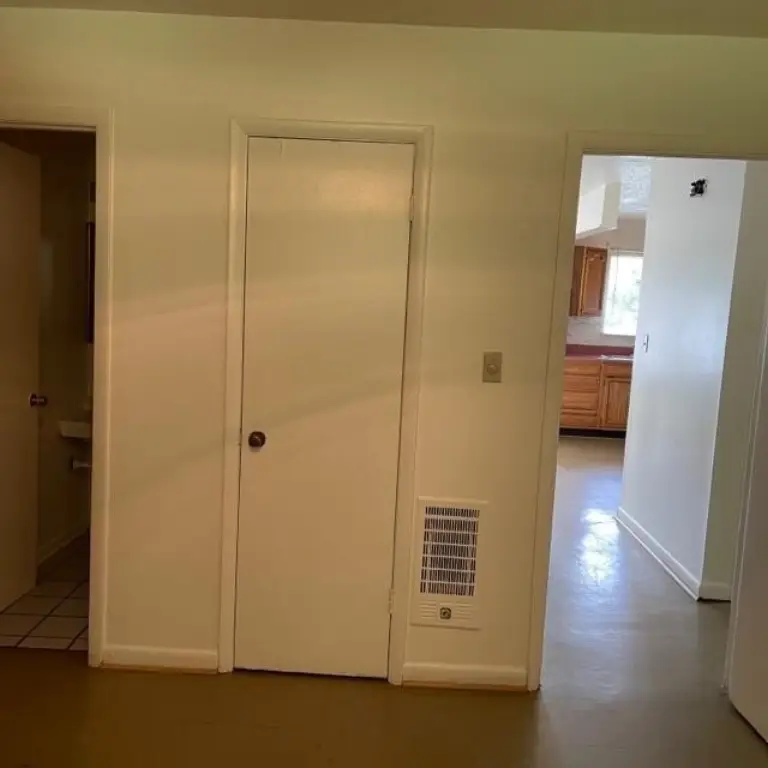
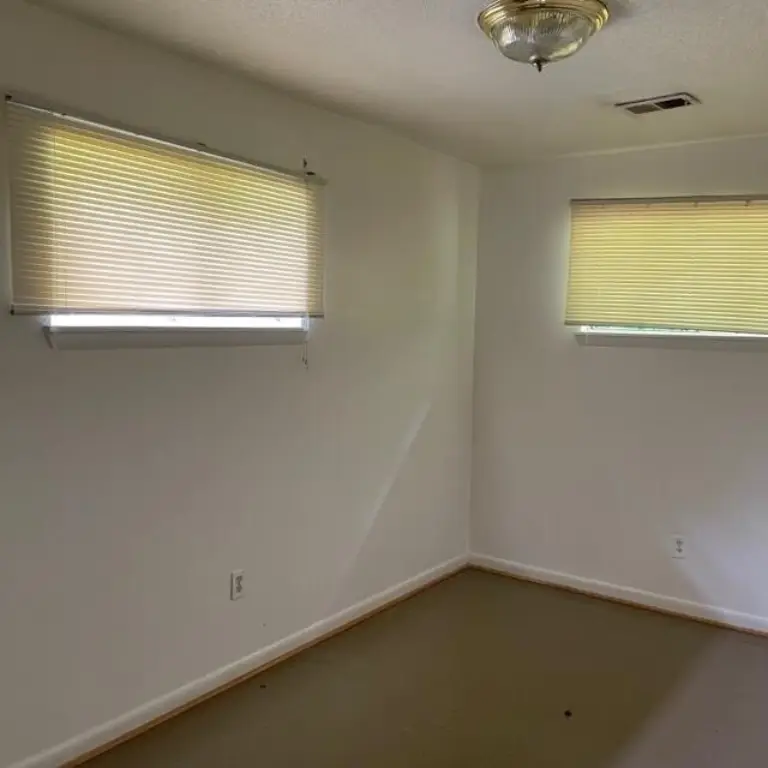
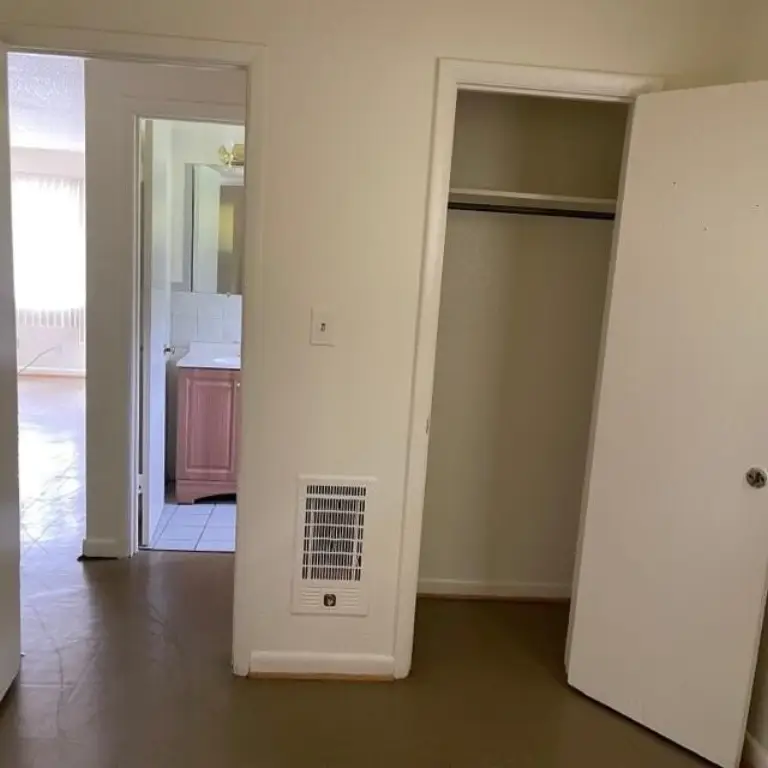
For Sale
$295,000
5024 Brogden Trail, Chattanooga, TN 37416
Residential Income, Chattanooga, TN
Property Size1,435 SF
Lot Size0.26 Acres
Price / SF$205.57
Days on Market47
Property Features for 5024 Brogden Trail
General Information
Property type
Residential Multi Family
Property subtype
Duplex
Bedrooms
4
Bathrooms
4
Full bathrooms
4
Rooms
Bathroom 3, Bedroom 4, Bathroom 4, Bathroom 1, Bedroom 2, Bedroom 1, Bathroom 2, Bedroom 3
Appliances
Water Heater, Refrigerator, Free-Standing Electric Range, ENERGY STAR Qualified Water Heater
Subdivision
Washington Hills
Elementary school
Harrison Elementary
Middle school
Brown Middle
High school
Central High School
Directions
Off State Hwy 153, take the Jersey Pike exit, turn right, take the 1st roundabout exit onto Oakwood, turn left on Hancock, turn right on Upshaw, left on Renezet, right on Delaine Ln, right on Brogden Trail, it's the first duplex on the left side.
Standard status
Active
APN
129e C 034.01
Size
1,435 SF
Lot size
0.26 Acres
Taxes and HOA fees
Tax Description
Lt 3A First Baptist Church Of Washi Ngton Hills Sub Pb 123 Pg 7
Tax Annual Amount
3705
Legal Description
Lt 3A First Baptist Church Of Washi Ngton Hills Sub Pb 123 Pg 7
Utilities
Sewer type
Public Sewer
Heating system
Central
Cooling system
Central Air
Water source
Public
Building Details
Year built
1972
Floors in Building
1
Number of units
2
Flooring type
Vinyl, Tile - Ceramic
Building materials
Brick
Roof type
Shingle
Listing Agency:
Keller Williams Realty
(423) 664-1600
Listed By:
Anita Askew Brogden · License #TN369320
(404) 429-7340
Added: Sep 4
Changed: Oct 16
Last Checked: Oct 20 at 10:06AM
MLS# 1542206
Copyright © 2026 Greater Chattanooga Association of REALTORS. All rights reserved. All information provided by the listing agent/broker is deemed reliable but is not guaranteed and should be independently verified.

Ask AI about this property
Review the available facts, identify missing information and prepare questions for the agent.
Investment Insights
Based on property information with market context.
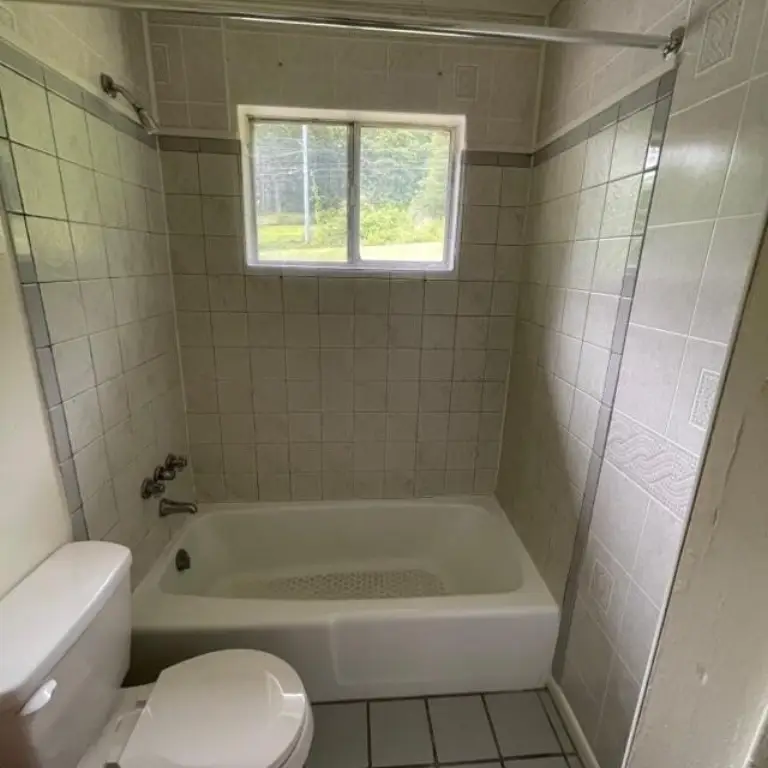
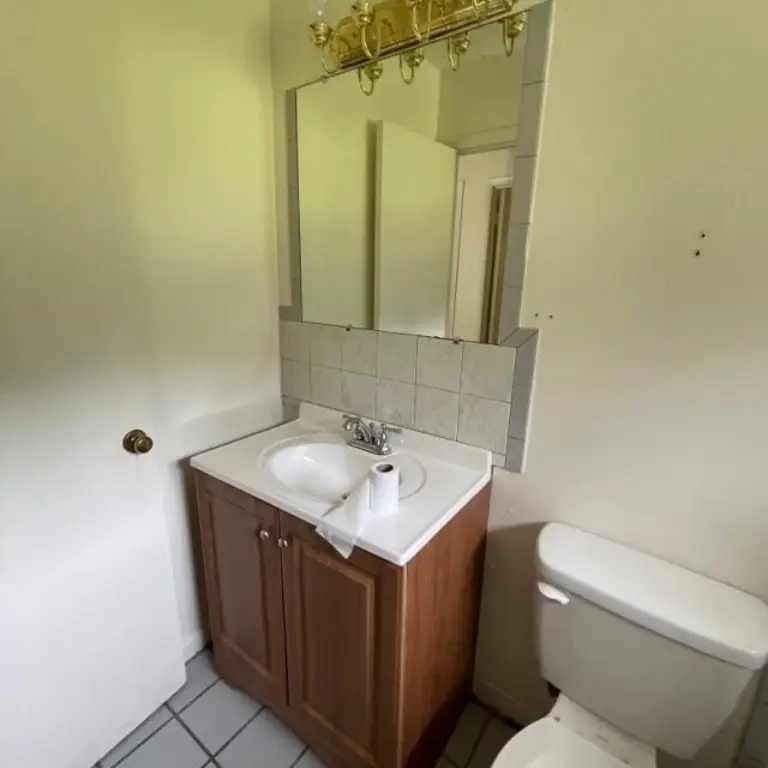
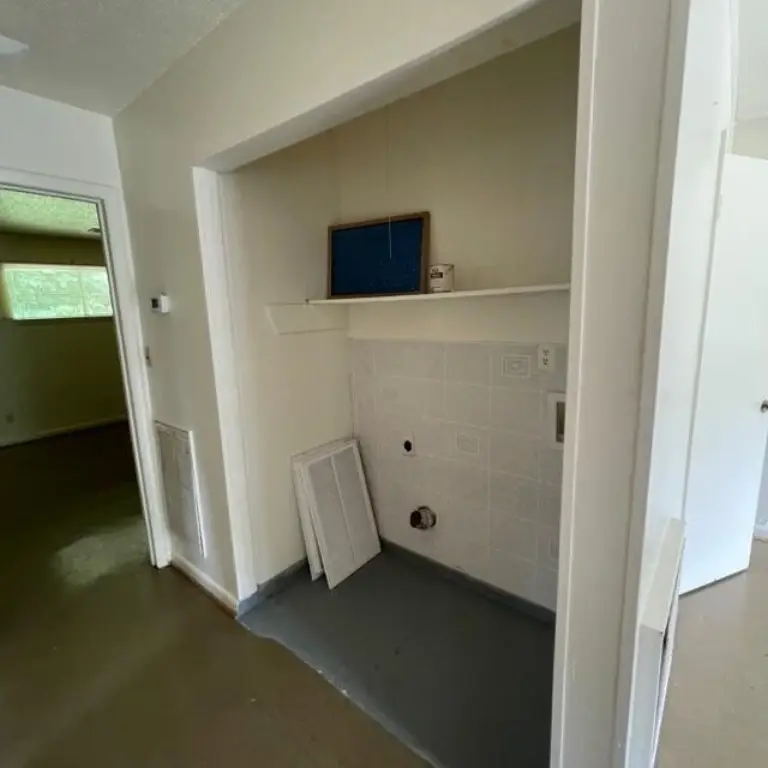
This 1,435-square-foot duplex includes two residential units, each arranged with 2 bedrooms and 1.5 baths. Four-sides-brick construction, ceramic tile and vinyl flooring, central heating and central air provide durable, practical finishes. Both units are occupied under leases extending through July 2027, and the property has a documented rental history. HVAC systems for both sides were replaced in October 2024, followed by new water heaters in July 2025.
The 0.26-acre property is served by public water and public sewer. Its Chattanooga setting provides approximately 10-15 minute access to Volkswagen Chattanooga, Amazon Fulfillment Center, and McKee Foods, with connections to Hwy 153, Hixson, Northgate, Hamilton Place/Gunbarrel, and downtown Chattanooga. Chickamauga Dam and the Tennessee Riverwalk are also nearby.
The 0.26-acre property is served by public water and public sewer. Its Chattanooga setting provides approximately 10-15 minute access to Volkswagen Chattanooga, Amazon Fulfillment Center, and McKee Foods, with connections to Hwy 153, Hixson, Northgate, Hamilton Place/Gunbarrel, and downtown Chattanooga. Chickamauga Dam and the Tennessee Riverwalk are also nearby.
Key Highlights
- Two‑unit duplex with 1,435 square feet of property size
- Both units occupied with leases extending through July 2027
- Each side includes 2 bedrooms and 1.5 baths
Financial Insights
Estimated NOI and Cap Rate
NOI / Yr
$14,088
Cap Rate
4.78%
Suggested Prices Based on Cap Rates
Cap Rate 5%
$281,760
$281.8K
Cap Rate 7%
$201,257
$201.3K
Cap Rate 9%
$156,533
$156.5K
Market Conditions
NOI Build-Up for 1,435 SF
Gross rent
$21.5K $15.00/SF
− Vacancy
−$1.4K −$0.98/SF
EGI
$20.1K $14.03/SF
− OpEx
−$6.0K −$4.21/SF
NOI
$14.1K $9.82/SF
Area
Chattanooga, TN
Vacancy
6.50%
Lease Rate
$15.00 /SF/Yr
Expense Ratio
30.00%
Simulate Cap Rate and NOI
Suggested Prices Based on Cap Rates
Cap Rate 5%
$281,760
Cap Rate 7%
$201,257
Cap Rate 9%
$156,533
Alternative Uses
Best Use
Multifamily LT 5
$201.3K
$176.1K – $234.8K
NOI $14,088 @ 7.0% cap · market cap 4.78%
Second Best
Apartment 5plus
$180.6K
$158.0K – $210.7K
NOI $12,642 @ 7.0% cap · market cap 4.29%
Theoretical Best
Office A
$316.9K
$277.3K – $369.8K
NOI $22,185 @ 7.0% cap · market cap 7.52%
Zoning and permitted uses should be independently verified with authorities.
How Realmo checks its estimates
Property Analytics
Unlock full access to Insights
Subscribe to Realmo Intelligence
Open Analytics
Lease Details
2
Residential units
100%
Occupancy
Multi-tenant
Tenancy
Yes
Highway access
Location Intelligence
Trade Area within ½ mile
126
Businesses Nearby
Explore this area
Business Placement
Demographics for 37416, TN
14,844
Population
6,598
Households
2.2
Avg Household Size
42
Median Age
34%
College-Educated
94%
High-School Grad
20.5 sq mi
ZIP Area
724
Density / Sq Mi
$65,083
Median Household Income
$37,379
Median Earnings
$1,086
Median Rent
$229,600
Median Home Value
Check the figures for this property
Cap Rate, Value Estimation, Potential NOI and more
View Realmo Analytics
Market
Vacancy Rate% for Multifamily in South region

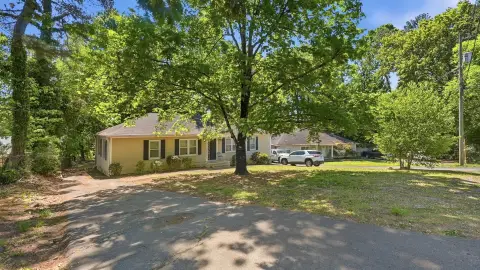


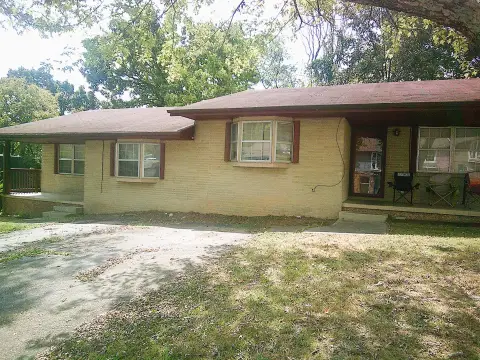



Frequently Asked Questions
What type of property is this?
Duplex - Both residences are leased through July 2027 and include two-bedroom layouts with one-and-a-half baths.
Where is this duplex located?
The property is located at 5024 Brogden Trail Chattanooga, TN.
What is the asking price?
The asking price for this property is $295,000.
What are key features of this property?
This property features: Two‑unit duplex with 1,435 square feet of property size; Both units occupied with leases extending through July 2027; Each side includes 2 bedrooms and 1.5 baths


