Contiguous Multifamily Portfolio for
For Sale
$1,870,000
8201 Schrider St, Silver Spring, MD 20910
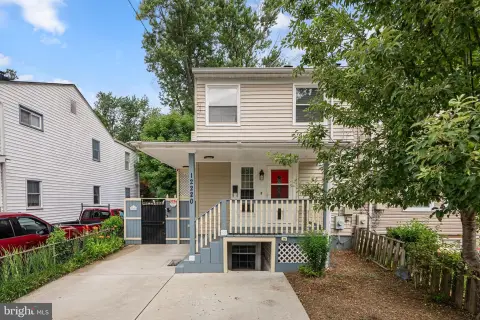
Three well-maintained multifamily properties offer a favorable unit mix and strong resident convenience features.
Property Size12,356 SF
Price / SF$151.34
Days on Market97
Property Features for 8201 Schrider St
General Information
Standard status
Active
Size
12,356 SF
Additional Details
Multifamily Units
19
Building Details
Year Built
1935
Listing Agency:
Feldman Ruel Urban Property Advisors
Listed By:
Ian Ruel · License #DC BR200201389
(202) 318-6800
Source:
Riverfoxrealty
Added: Jun 22
Changed: Sep 25
Last Checked: Sep 24 at 1:31PM
Displayed information is deemed reliable but is not guaranteed and should be independently verified. All listing content including descriptions, pricing, images are the copyrighted material of Feldman Ruel Urban Property Advisors
Investment Insights
Based on property information with market context.
This offering presents three contiguous, well-maintained multifamily properties on a quiet cul-de-sac: 8201 Schrider Street and 8207–8209 Schrider Street. 8201 Schrider Street is an 11-unit building with one- and two-bedroom apartments, along with on-site laundry, tenant storage, and workshop space for maintenance personnel. 8207 and 8209 Schrider Street are each four-unit properties, featuring one-bedroom units with private screened-in porches.
The properties are located within walking distance of Downtown Silver Spring and its surrounding amenities, including restaurants, entertainment venues, grocery stores, the Silver Spring Library, and Veterans Plaza. Area connectivity includes access to the Sligo Creek Trail and transit options such as the Washington Metrorail Red Line via the Silver Spring Metrorail station and the Silver Spring MARC station. The future Purple Line station is also scheduled to open in 2027.
The assemblage can be acquired as a whole or as individual properties, providing flexibility for buyers seeking either a concentrated portfolio approach or separate ownership. With unit variety across the buildings and practical in-building resident and maintenance features, the configuration is well suited for operators and investors focused on straightforward, well-kept multifamily housing.
The properties are located within walking distance of Downtown Silver Spring and its surrounding amenities, including restaurants, entertainment venues, grocery stores, the Silver Spring Library, and Veterans Plaza. Area connectivity includes access to the Sligo Creek Trail and transit options such as the Washington Metrorail Red Line via the Silver Spring Metrorail station and the Silver Spring MARC station. The future Purple Line station is also scheduled to open in 2027.
The assemblage can be acquired as a whole or as individual properties, providing flexibility for buyers seeking either a concentrated portfolio approach or separate ownership. With unit variety across the buildings and practical in-building resident and maintenance features, the configuration is well suited for operators and investors focused on straightforward, well-kept multifamily housing.
Key Highlights
- Three contiguous multifamily properties on a quiet cul‑de‑sac in downtown Silver Spring, MD, offered individually or as an assemblage
- 8201 Schrider Street: 11 units with 1- and 2‑bedroom layouts, plus on‑site laundry, tenant storage, and workshop space
- 8207 Schrider Street: 4 one‑bedroom units with private screened‑in porches
Property Analytics
Unlock full access to Insights
Subscribe to Realmo Intelligence
Open Analytics
Current Use
Lease Details
19
Residential units
Location Intelligence
Trade Area within ½ mile
2,319
Businesses Nearby
Explore this area
Business Placement
Demographics for 20910, MD
45,610
Population
23,209
Households
2
Avg Household Size
36
Median Age
74%
College-Educated
95%
High-School Grad
4.6 sq mi
ZIP Area
9,915
Density / Sq Mi
$107,994
Median Household Income
$70,022
Median Earnings
$1,992
Median Rent
$690,900
Median Home Value
Check the figures for this property
Cap Rate, Value Estimation, Potential NOI and more
View Realmo Analytics
Market
Vacancy Rate% for Multifamily in South region

Questions? Ask Rey
Realmo’s AI knows this listing — price, zoning, demand, history. Ask anything.




Frequently Asked Questions
What type of property is this?
Apartment building - Three well-maintained multifamily properties offer a favorable unit mix and strong resident convenience features.
Where is this apartment building located?
The property is located at 8201 Schrider St Silver Spring, MD.
What is the asking price?
The asking price for this property is $1,870,000.
What are key features of this property?
This property features: Three contiguous multifamily properties on a quiet cul‑de‑sac in downtown Silver Spring, MD, offered individually or as an assemblage; 8201 Schrider Street: 11 units with 1- and 2‑bedroom layouts, plus on‑site laundry, tenant storage, and workshop space; 8207 Schrider Street: 4 one‑bedroom units with private screened‑in porches


