Iconic Restaurant Property For
For Sale
$2,200,000
81901 Overseas Hwy, Islamorada, FL 33036
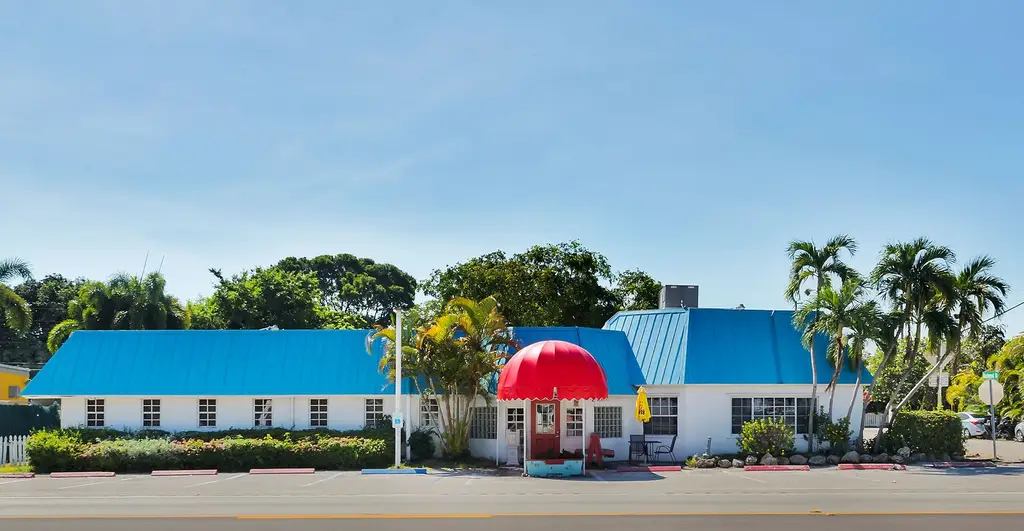
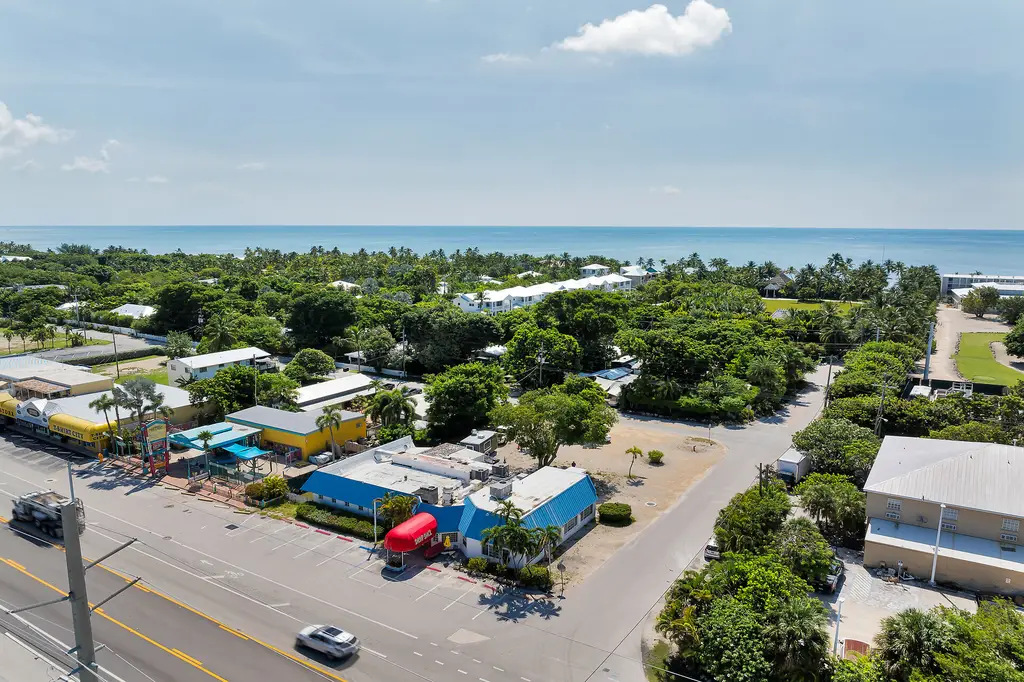
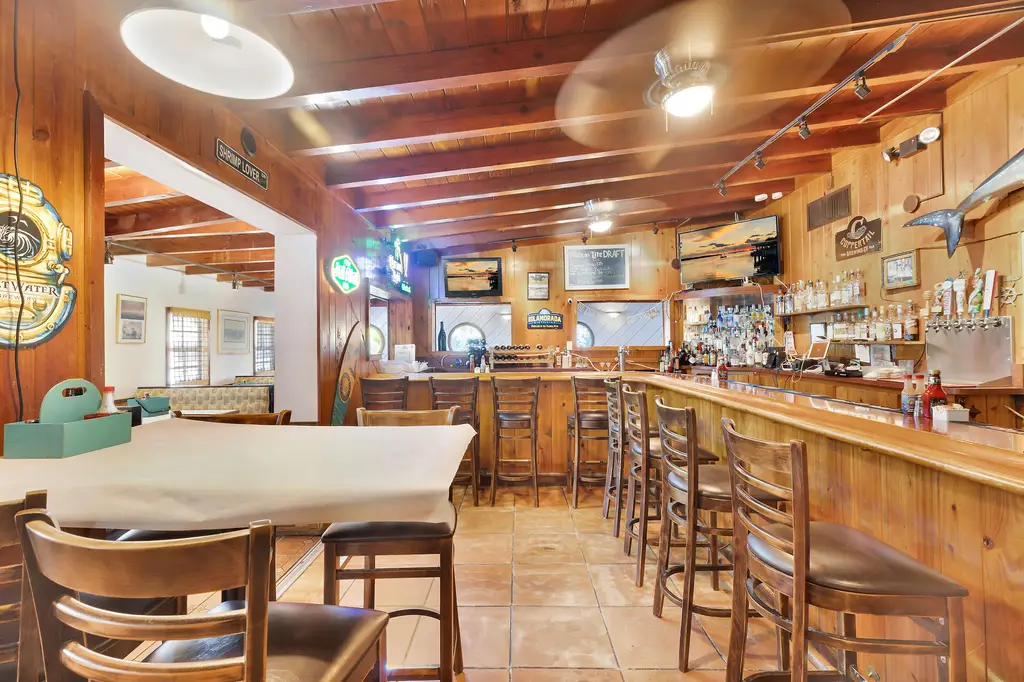
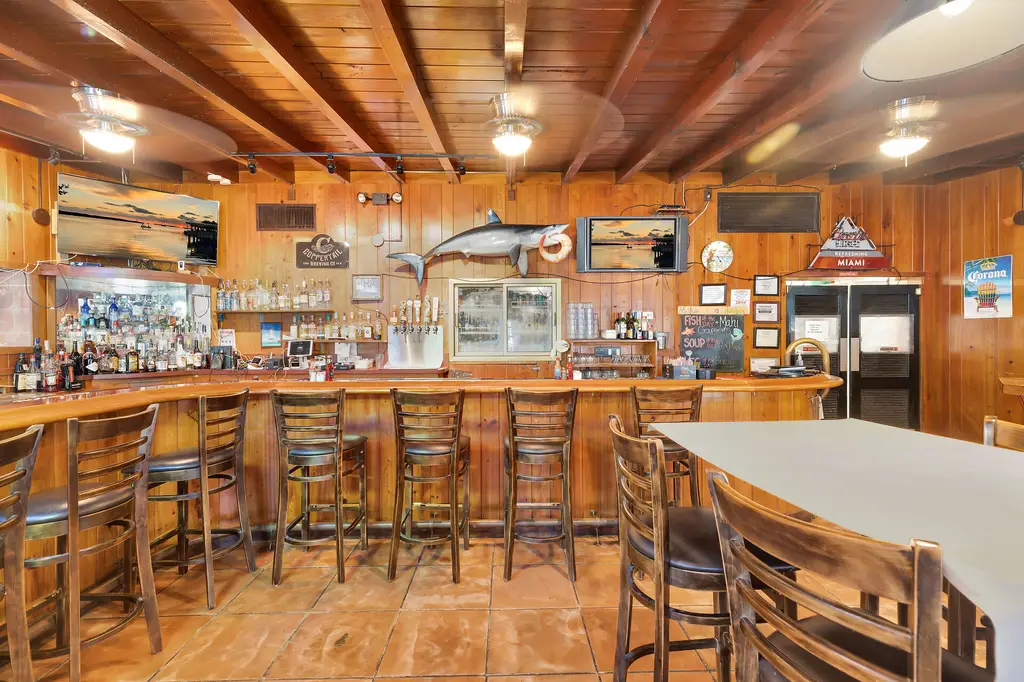
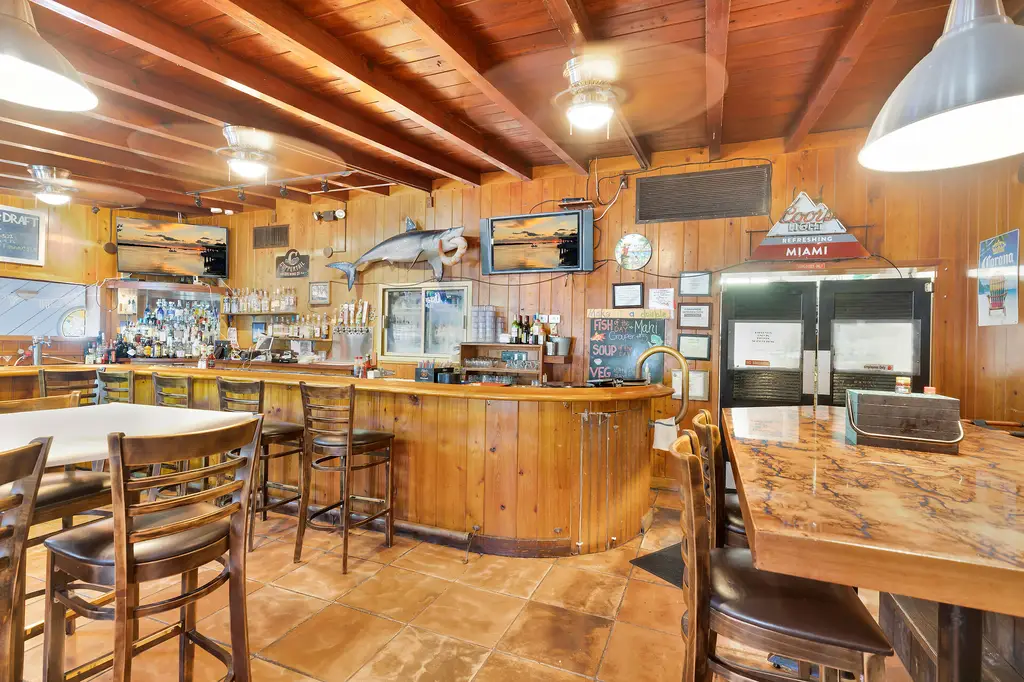
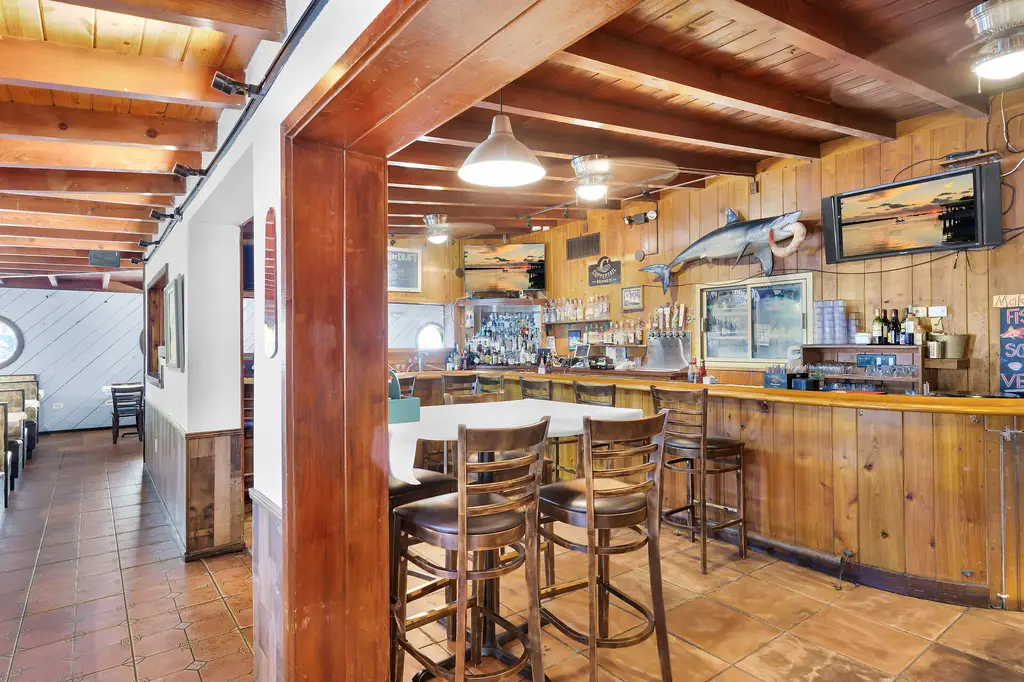
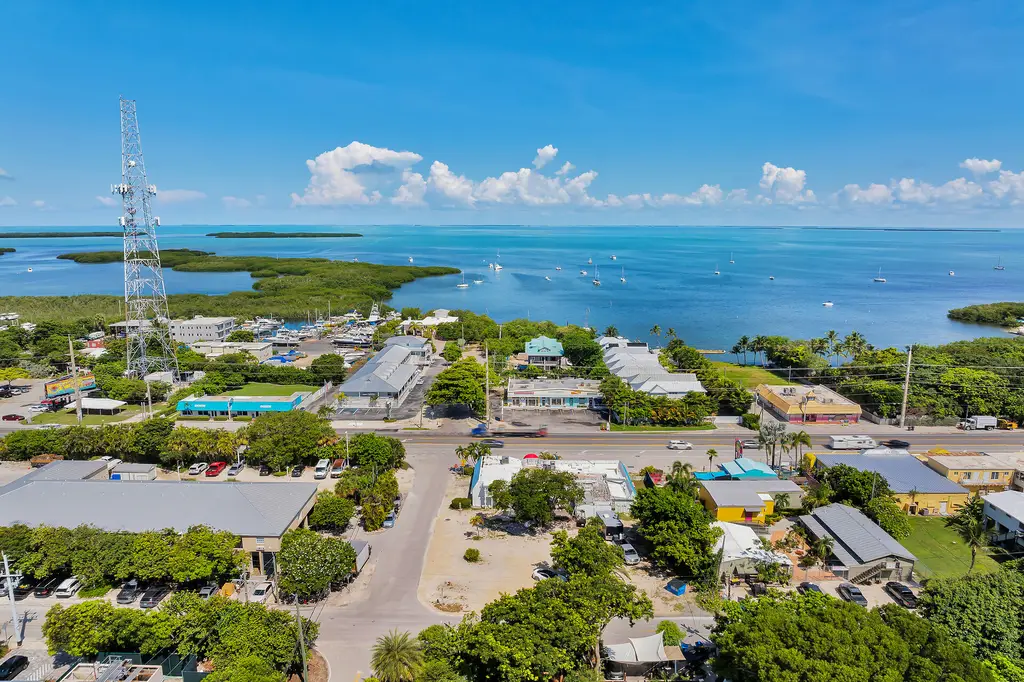
Iconic restaurant property with high visibility and flexible commercial zoning.
Property Size4,942 SF
Lot Size0.38 Acres
Price / SF$445.16
Days on Market239
Property Features for 81901 Overseas Hwy
General Information
Standard status
Active
Property type
Conventional restaurants, Restaurants
Size
4,942 SF
Class
A
Elevators
No
Lot size
0.38 Acres
Building Details
Year Built
1947
Buildings
1
Stories
1
Listing Agency:
All Keys Commercial | TCN Worldwide
Listed By:
Greg Dully · License #SL3420625
(305) 900-4232
Added: Feb 17
Changed: Apr 8
Investment Insights
Based on property information with market context.
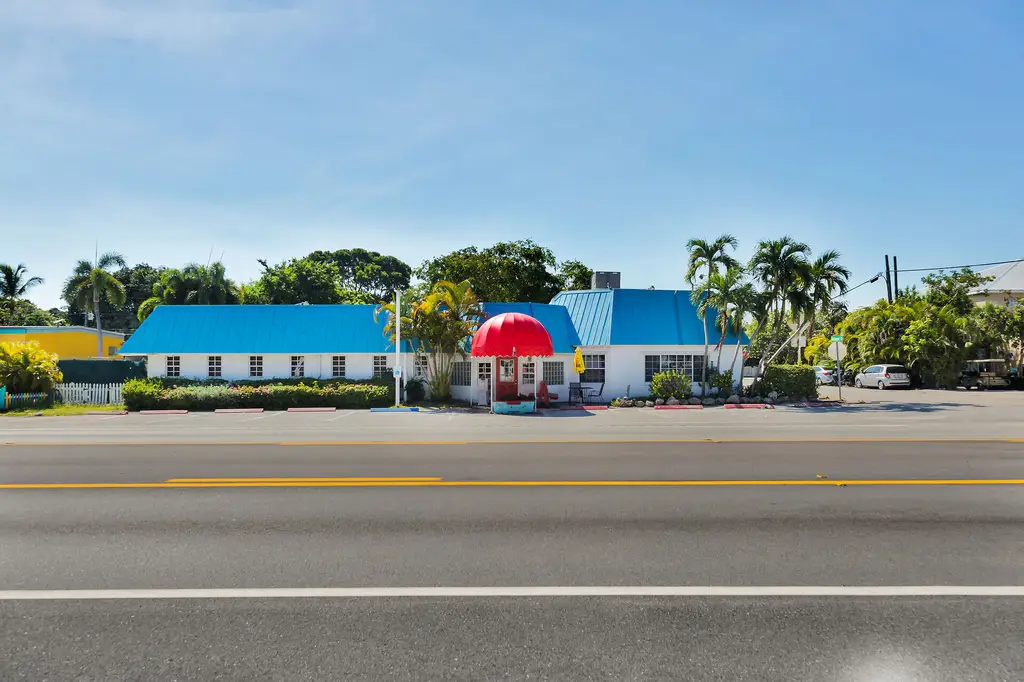
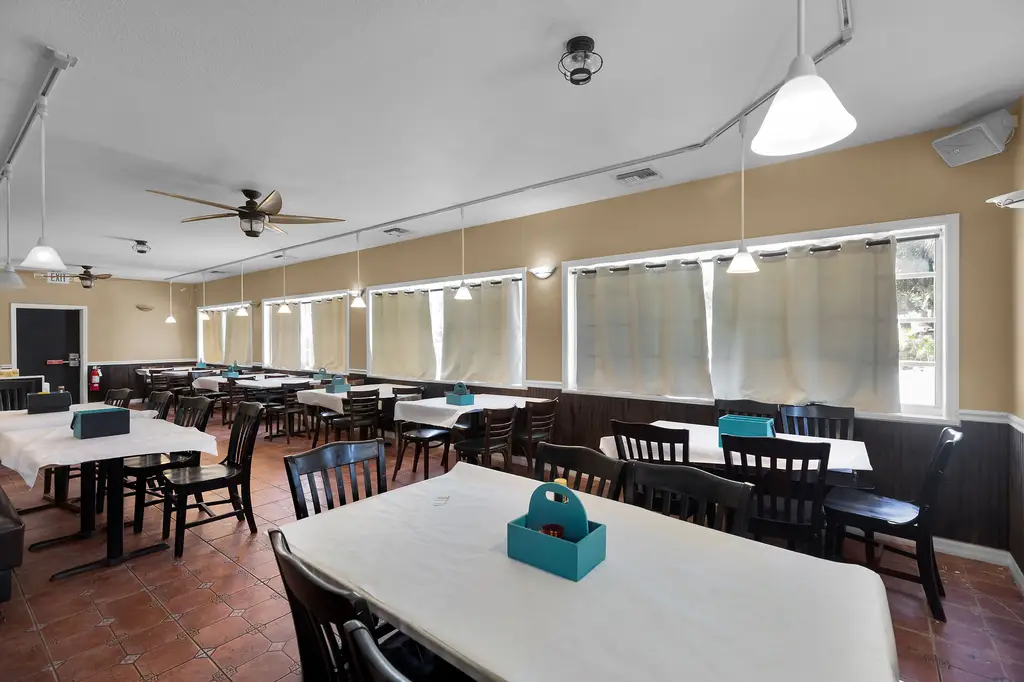
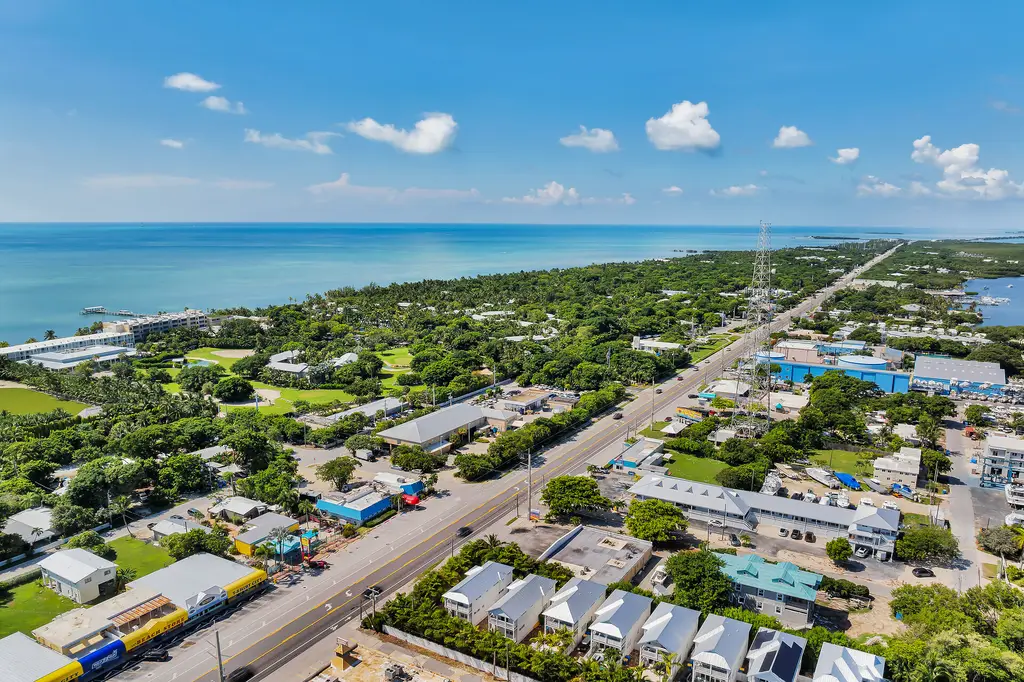
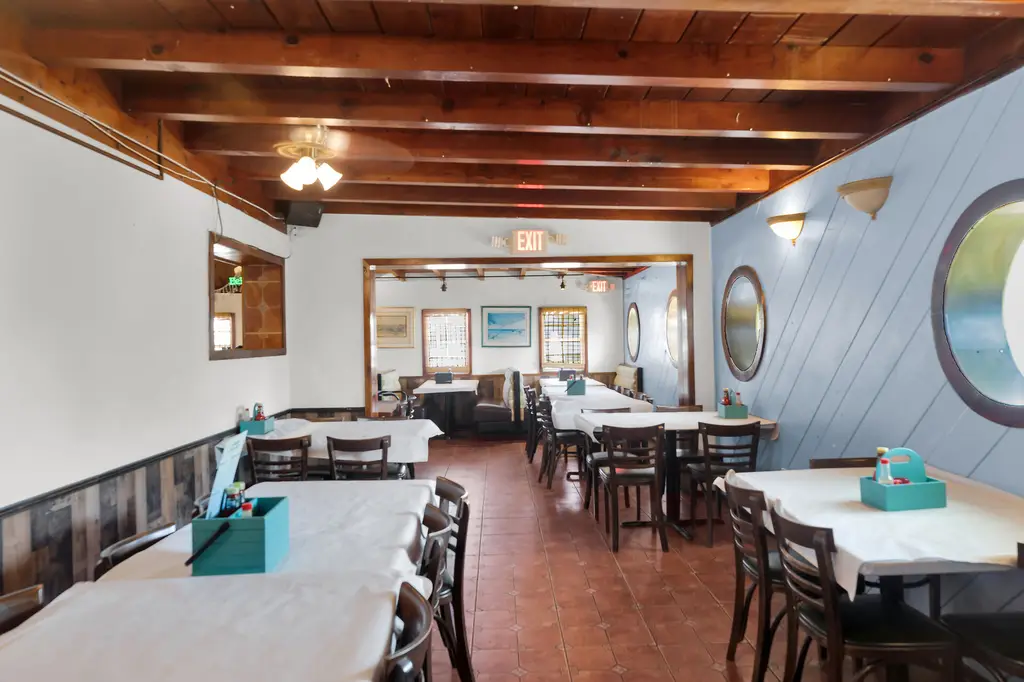
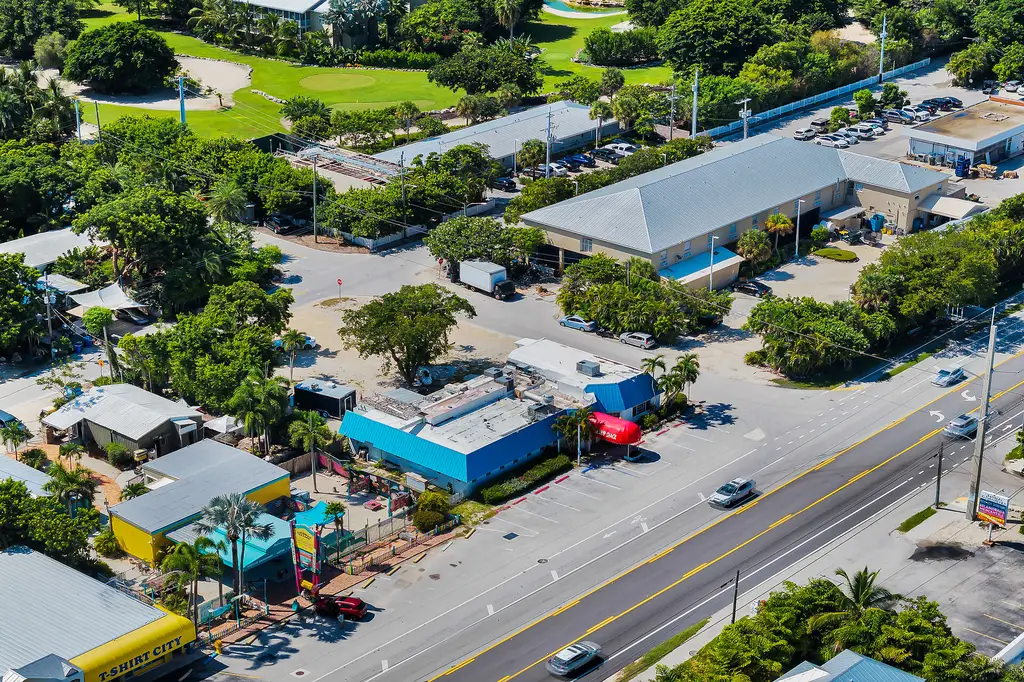
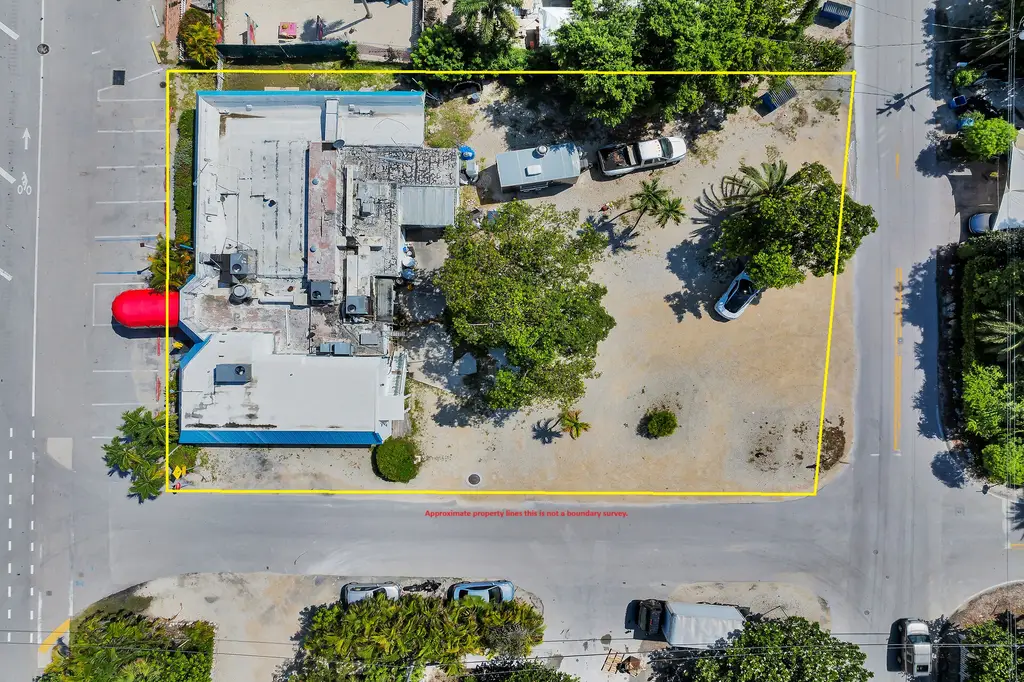
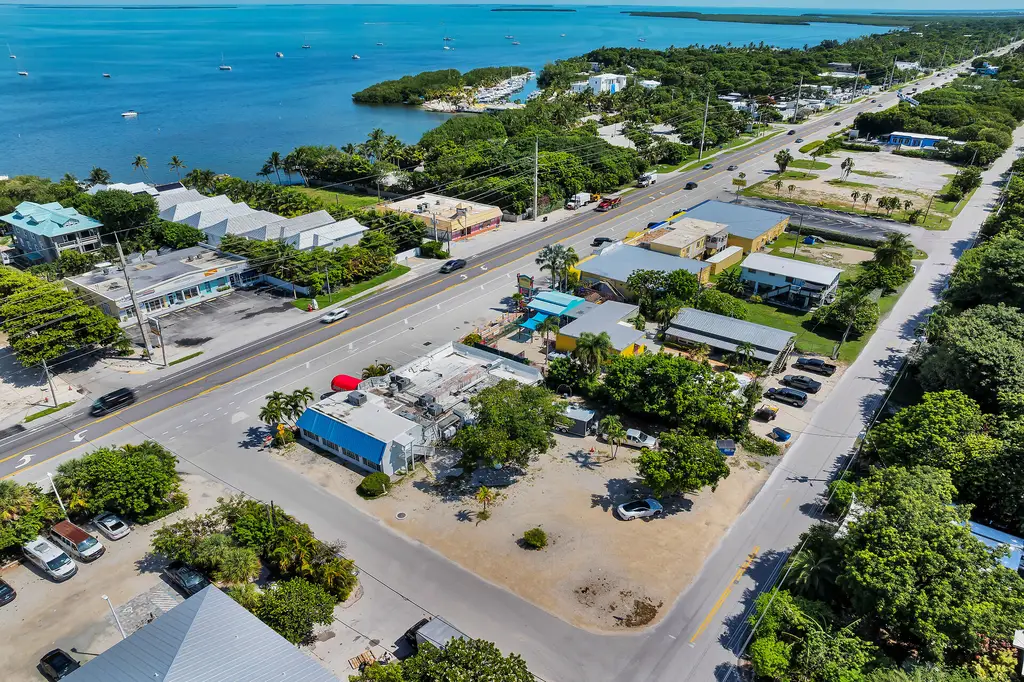
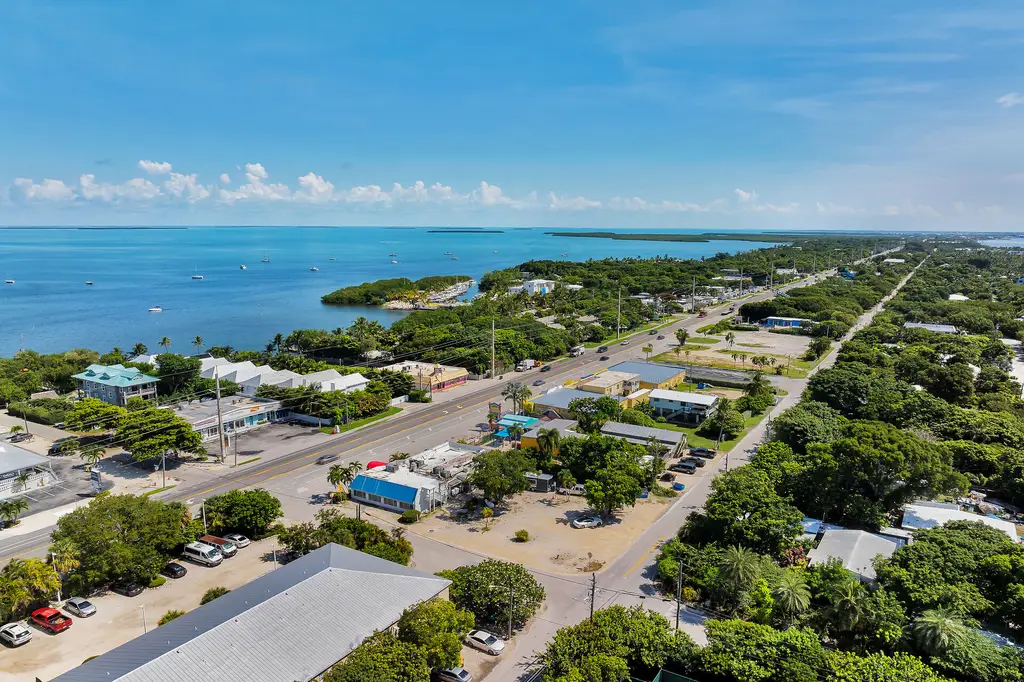
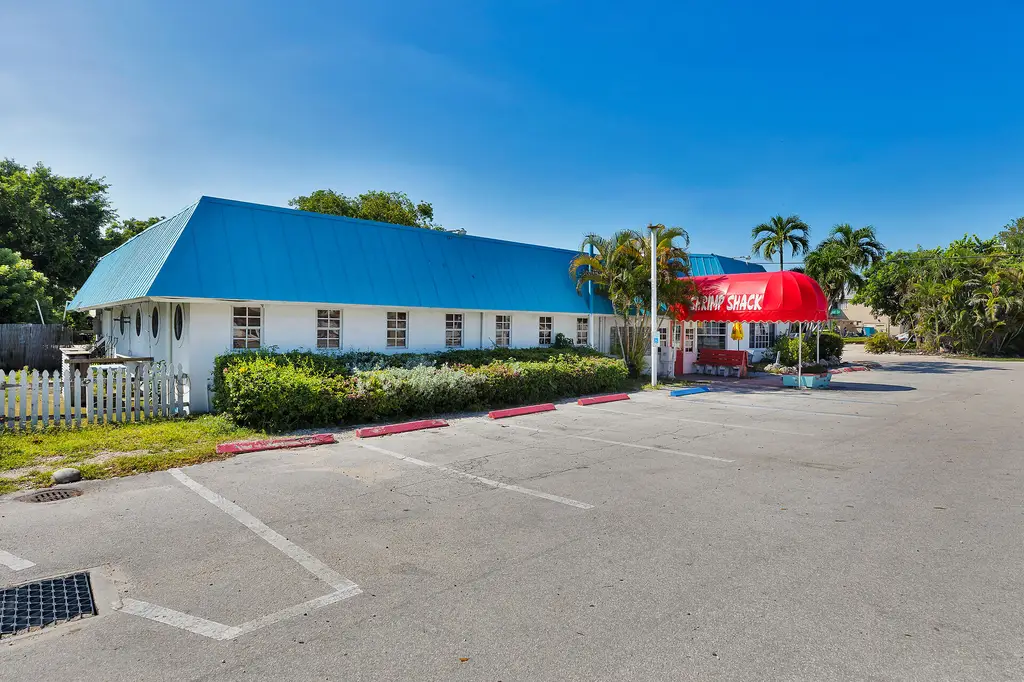
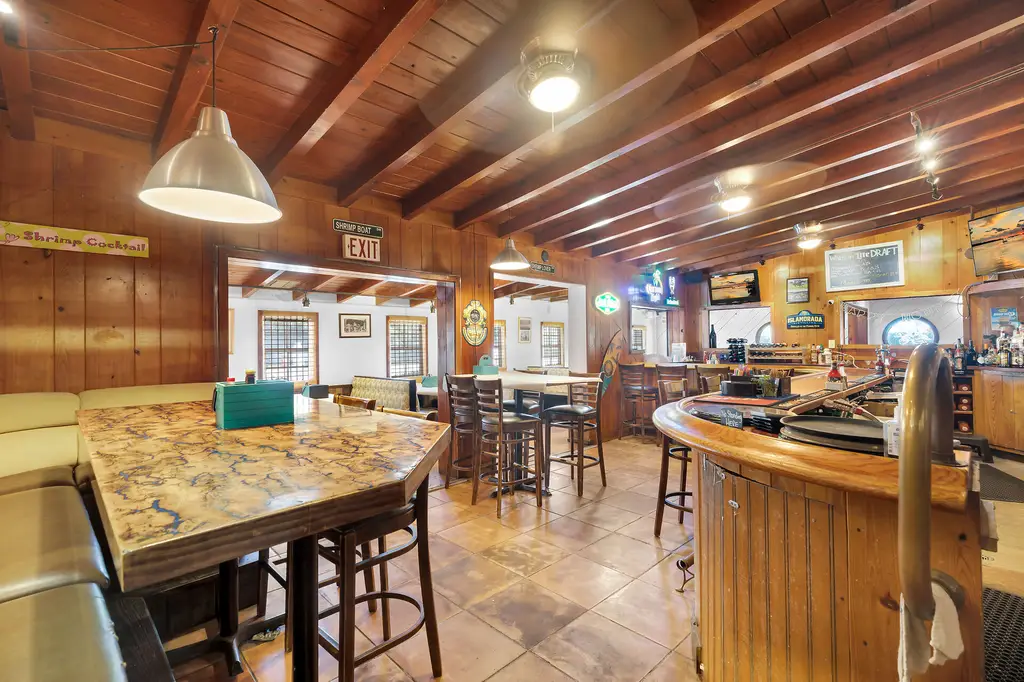
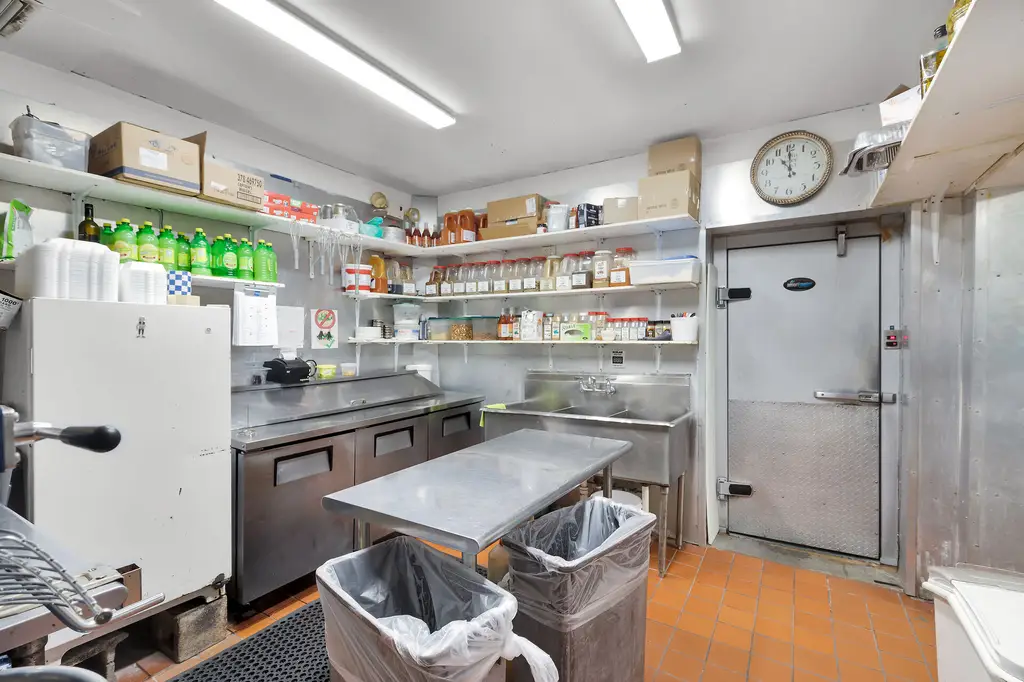
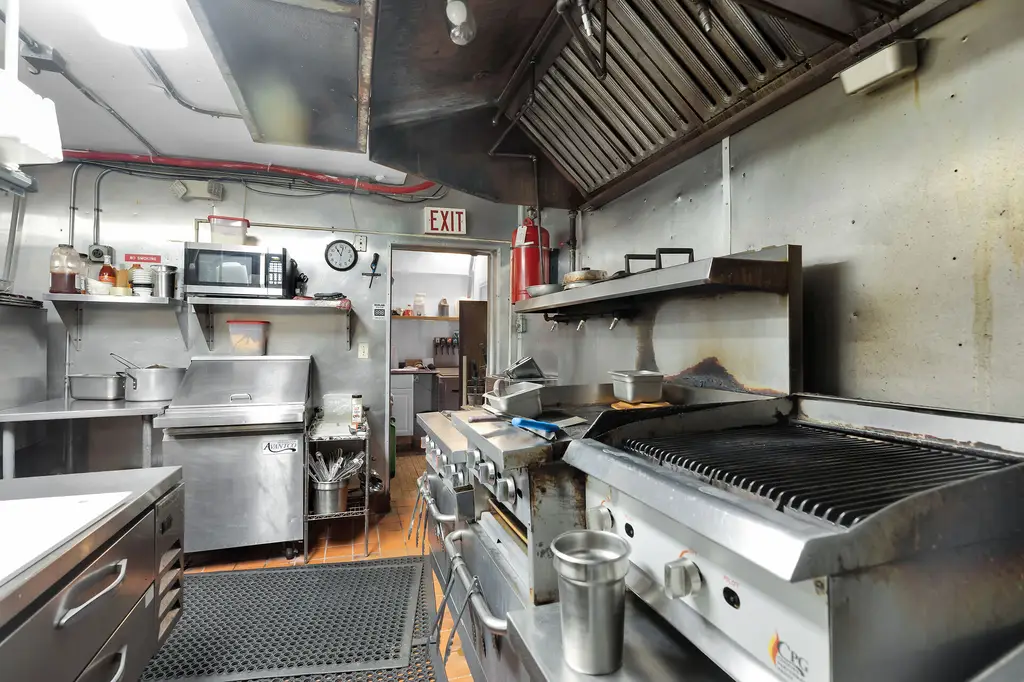
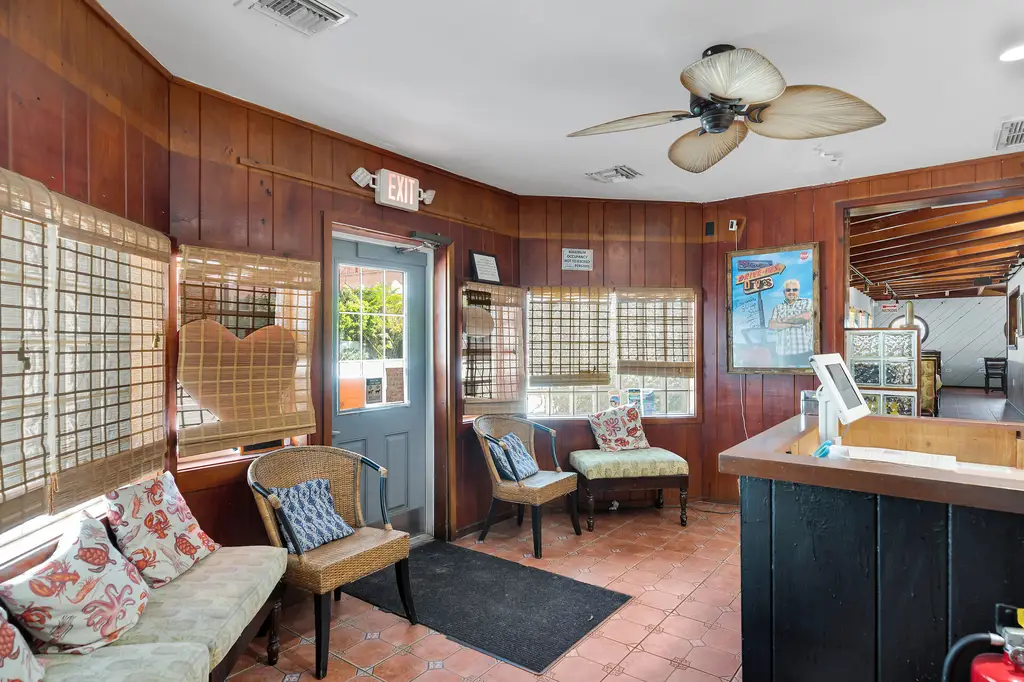
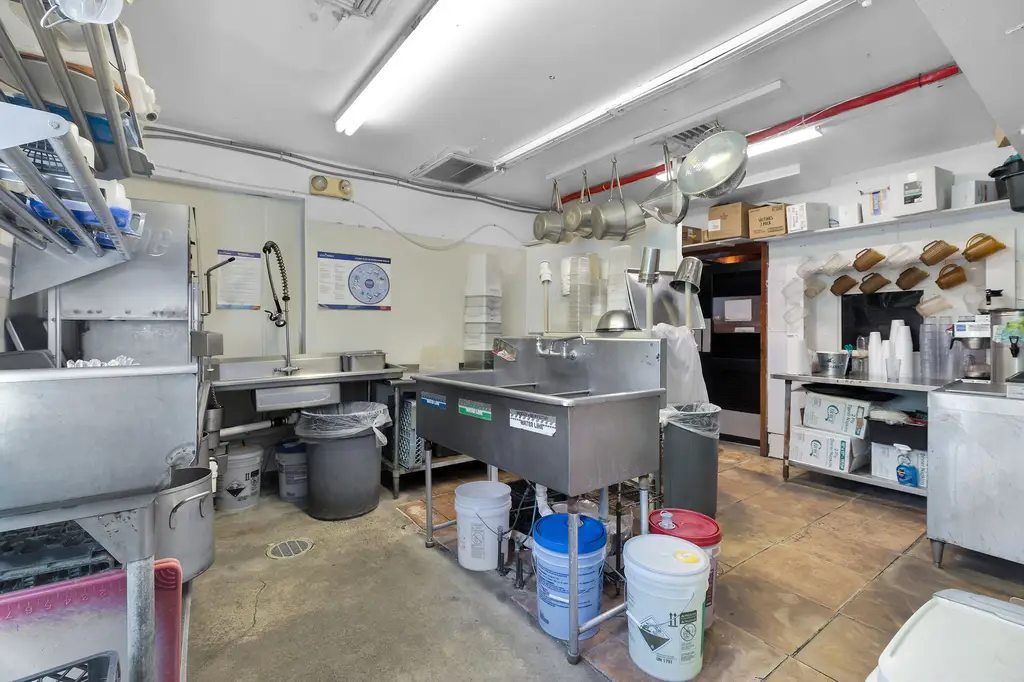
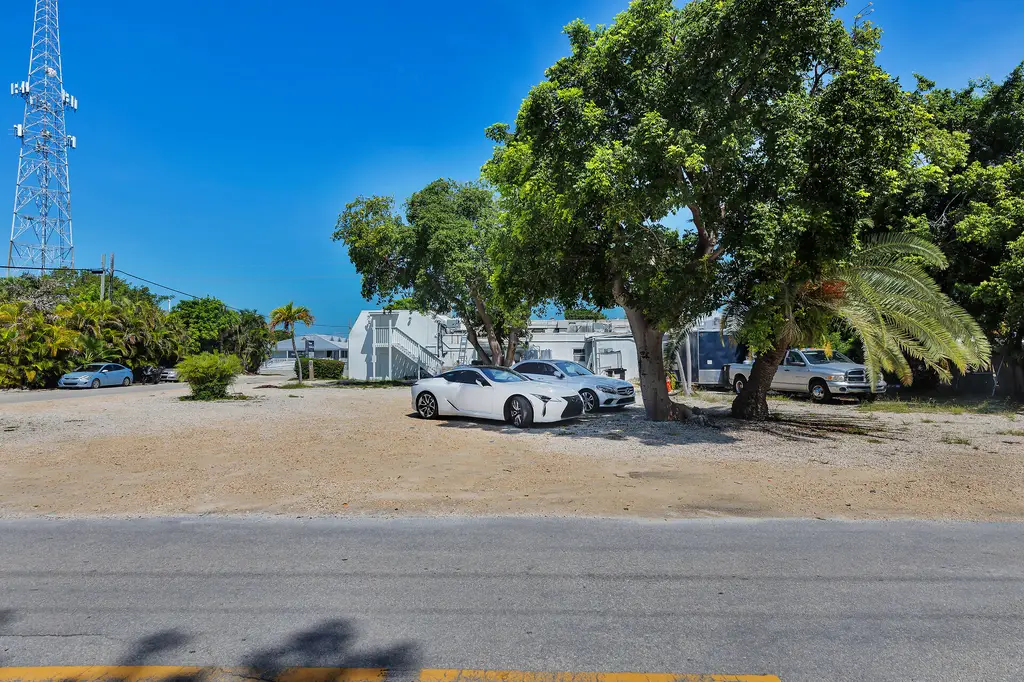
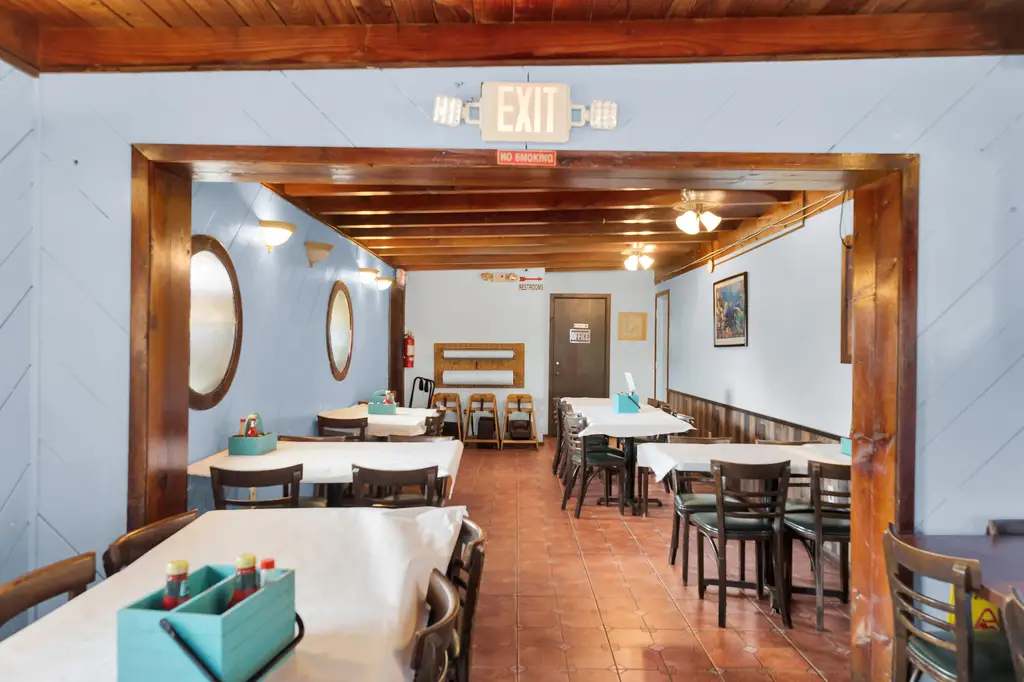
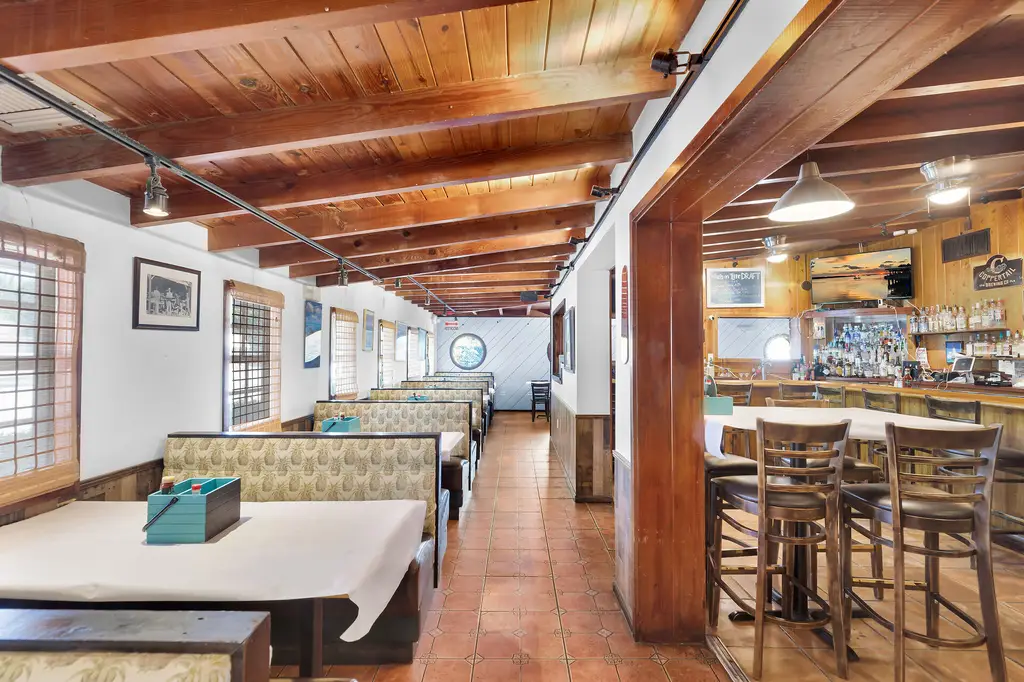
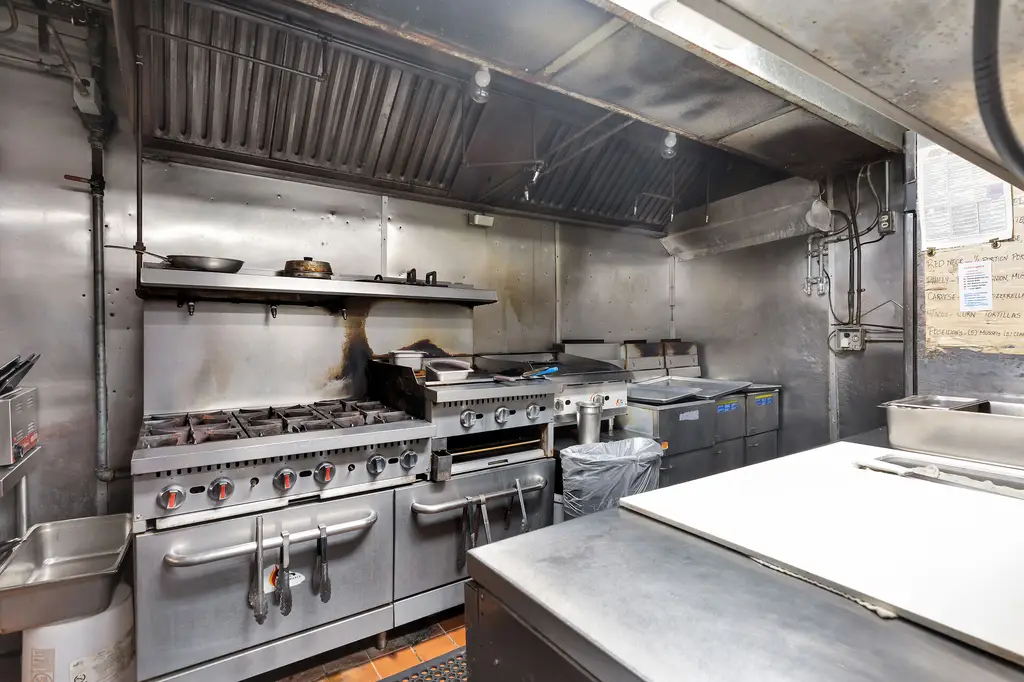
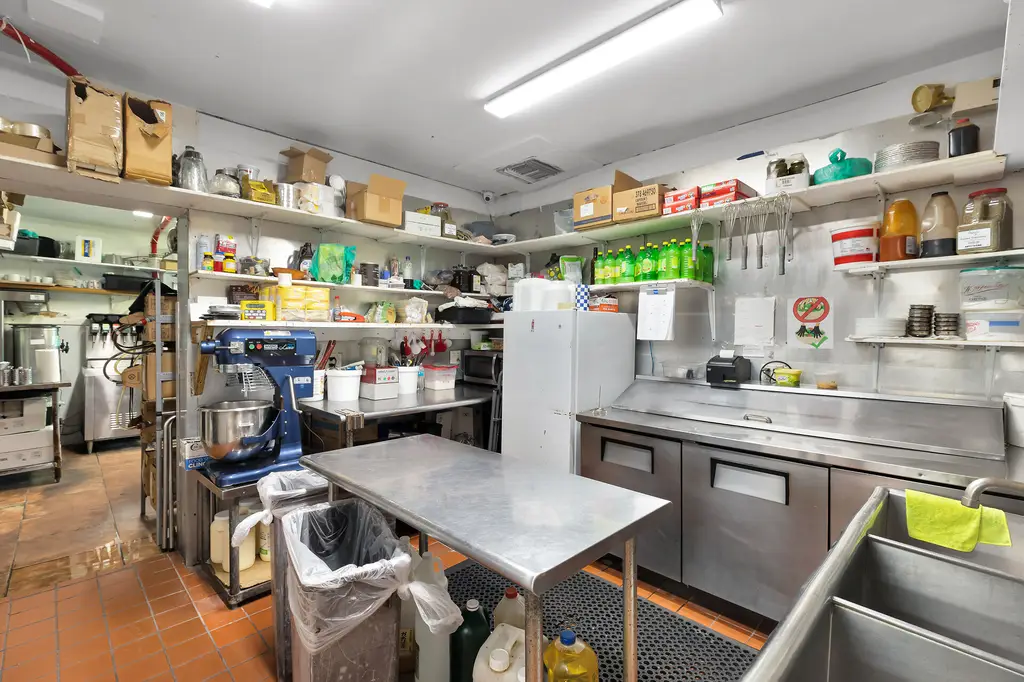
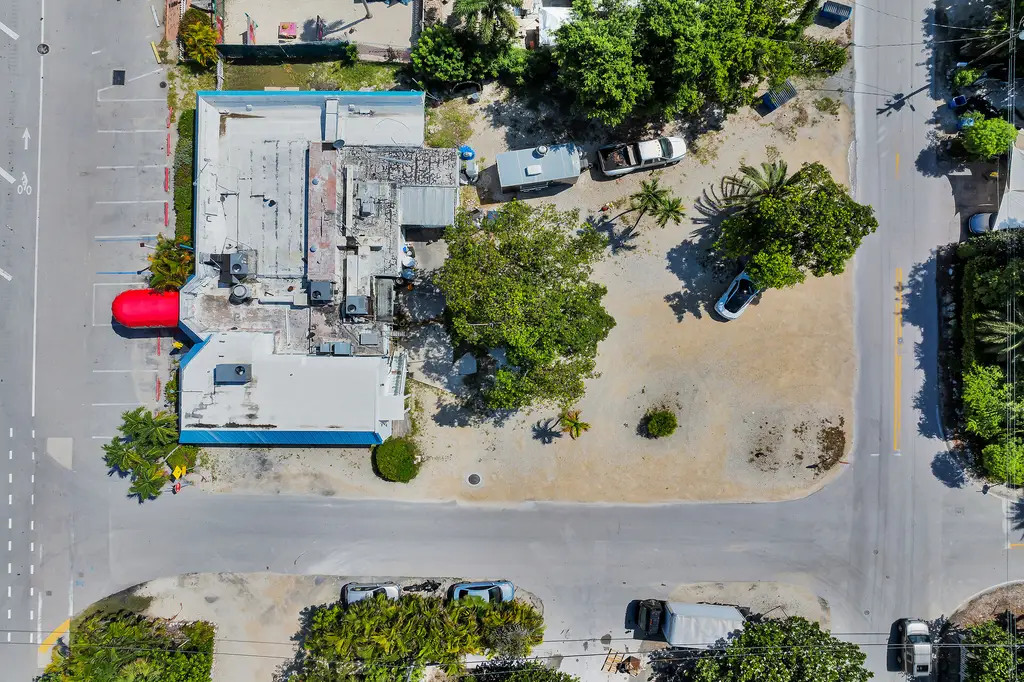
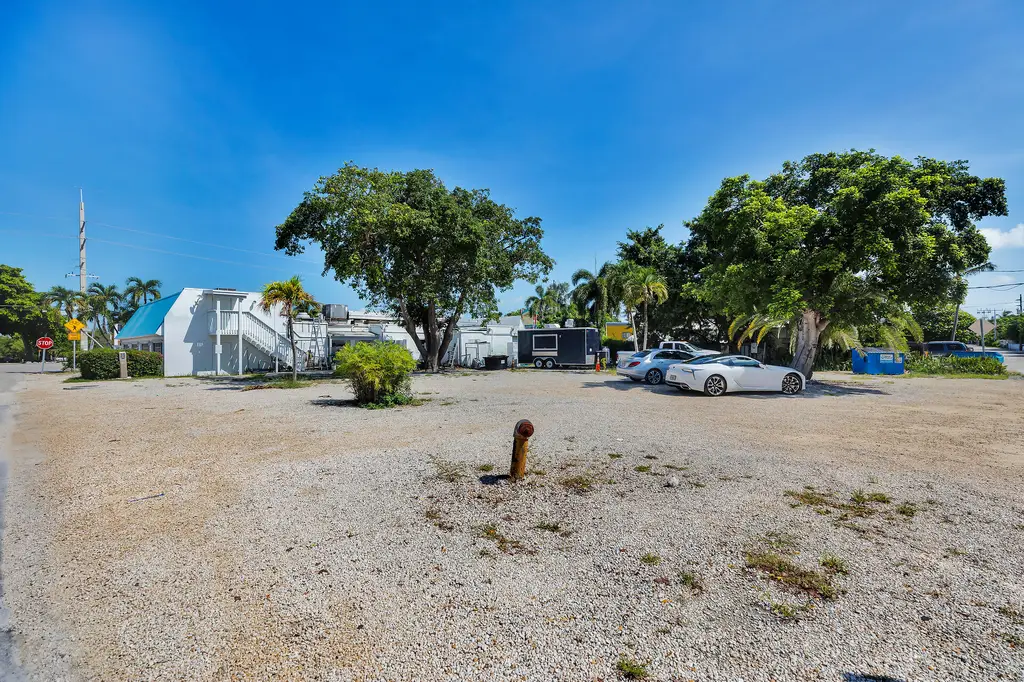
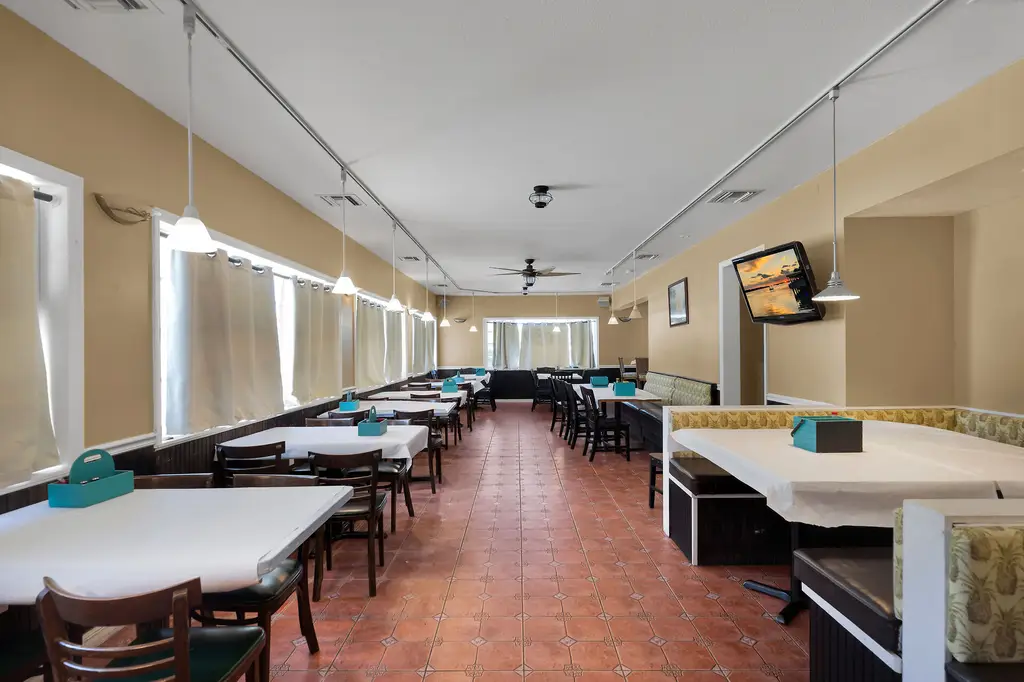
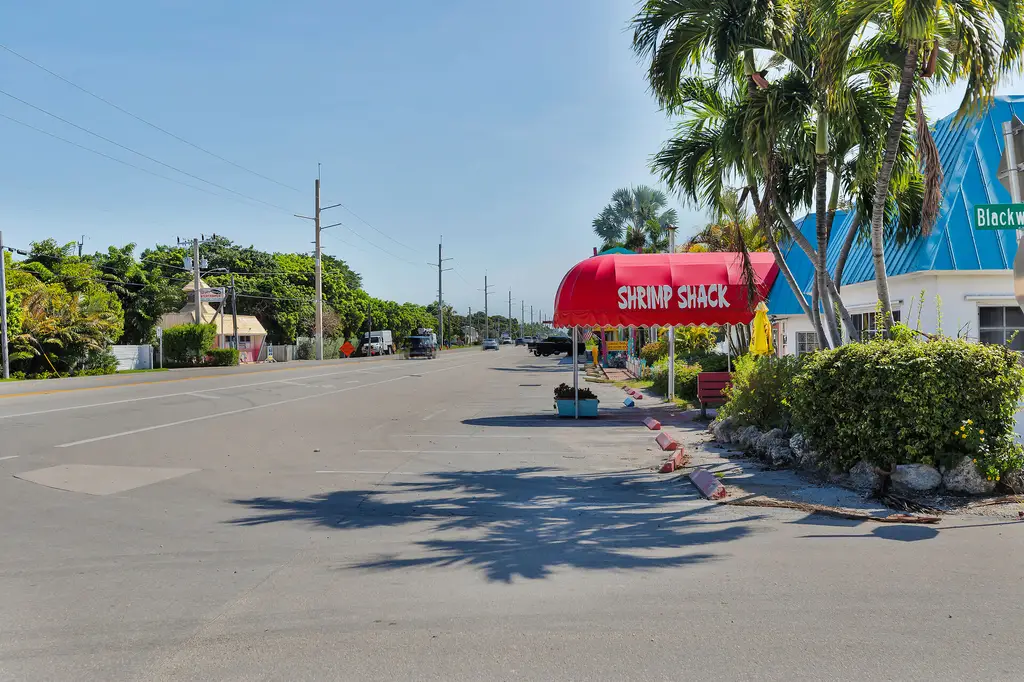
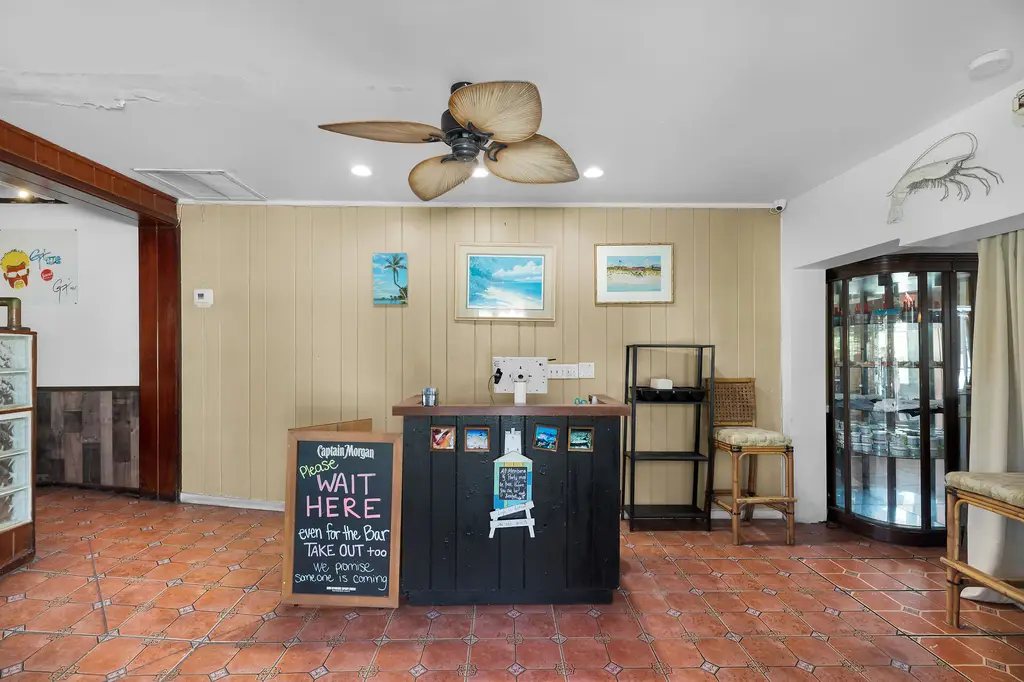
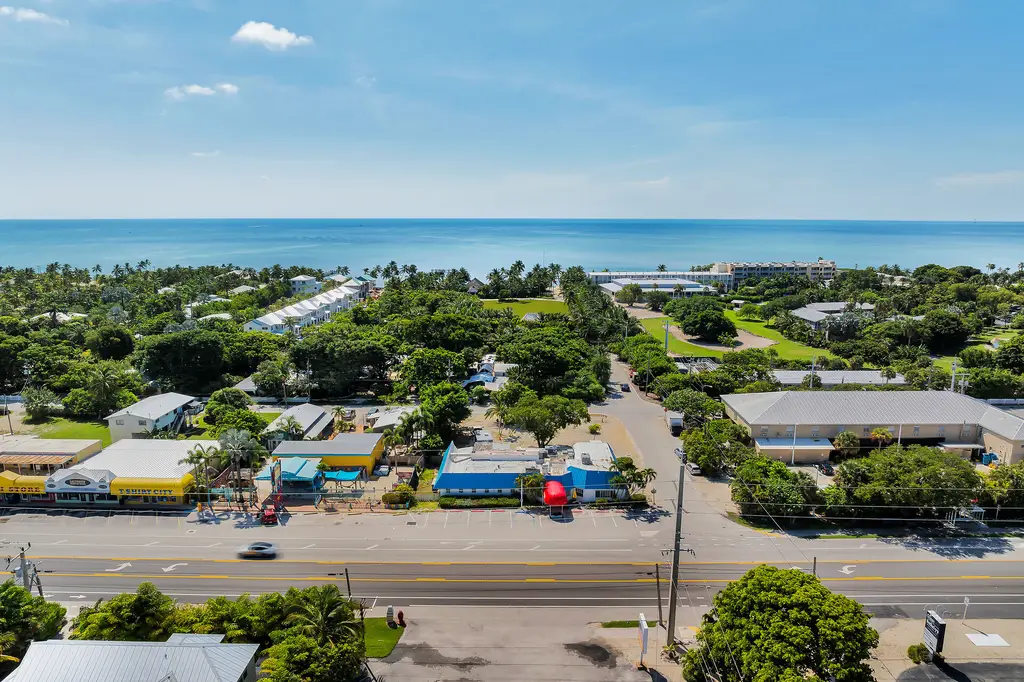
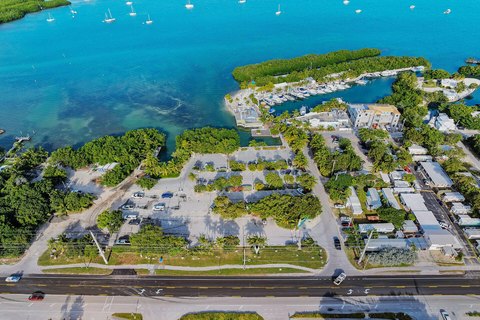
Located at 81901 Overseas Hwy, Islamorada, FL, this property offers a retail/hospitality opportunity with restaurant use. The building, constructed in 1947, has a total area of 4,942 square feet and is situated on a lot of approximately 16,746 square feet. The property is zoned Village Center (VC), allowing for flexible commercial uses. It features ample on-site parking in the front, side, and rear. The property has frontage on Overseas Highway (US-1), providing strong traffic exposure. Its corner lot location at Overseas Hwy & Blackwood Drive ensures high visibility. It is within walking distance of local resorts, shops, and the Morada Way Art District. The current restaurant layout includes seating for approximately 160 seats. The Village Center zoning allows for a range of commercial uses beyond restaurant operations, with potential for retail, office, other hospitality, or redevelopment, subject to local approvals. The property is currently home to the Islamorada Shrimp Shack.
Key Highlights
- 📍 Property Overview
- Address: 81901 Overseas Hwy, Islamorada, FL 33036, Monroe County
- Property Type: Retail / Hospitality – Restaurant use (single tenant)
Financial Insights
Estimated NOI and Cap Rate
NOI / Yr
$76,458
Cap Rate
3.48%
Suggested Prices Based on Cap Rates
Cap Rate 5%
$1,529,160
$1.5M
Cap Rate 7%
$1,092,257
$1.1M
Cap Rate 9%
$849,533
$849.5K
Market Conditions
NOI Build-Up for 4,942 SF
Gross rent
$106.7K $21.60/SF
− Vacancy
−$4.8K −$0.97/SF
EGI
$101.9K $20.63/SF
− OpEx
−$25.5K −$5.16/SF
NOI
$76.5K $15.47/SF
Area
Monroe County, FL
Vacancy
4.50%
Lease Rate
$21.60 /SF/Yr
Expense Ratio
25.00%
Simulate Cap Rate and NOI
Suggested Prices Based on Cap Rates
Cap Rate 5%
$1,529,160
Cap Rate 7%
$1,092,257
Cap Rate 9%
$849,533
Alternative Uses
Best Use
Specialty Retail
$1.09M
$955.7K – $1.27M
NOI $76,458 @ 7.0% cap · market cap 3.48%
Second Best
—
—
no second resolved use
Theoretical Best
Office A
$1.99M
$1.74M – $2.32M
NOI $139,151 @ 7.0% cap · market cap 6.33%
Zoning and permitted uses should be independently verified with authorities.
How Realmo checks its estimates
Property Analytics
Unlock full access to Insights
Subscribe to Realmo Intelligence
Open Analytics
Current Use
Location Intelligence
Trade Area within ½ mile
58
Businesses Nearby
Well-served
Demand for This Use
Explore this area
Business Placement
Demographics for 33036, FL
3,541
Population
3,651
Households
1
Avg Household Size
56
Median Age
40%
College-Educated
97%
High-School Grad
5.8 sq mi
ZIP Area
611
Density / Sq Mi
$88,214
Median Household Income
$46,735
Median Earnings
$1,846
Median Rent
$995,600
Median Home Value
Check the figures for this property
Cap Rate, Value Estimation, Potential NOI and more
View Realmo Analytics
Market
Vacancy Rate% for Retail in South region

Questions? Ask Rey
Realmo’s AI knows this listing — price, zoning, demand, history. Ask anything.






Frequently Asked Questions
What type of property is this?
Conventional restaurant - Iconic restaurant property with high visibility and flexible commercial zoning.
Where is this conventional restaurant located?
The property is located at 81901 Overseas Hwy Islamorada, FL.
What is the asking price?
The asking price for this property is $2,200,000.
What are key features of this property?
This property features: 📍 Property Overview; Address: 81901 Overseas Hwy, Islamorada, FL 33036, Monroe County; Property Type: Retail / Hospitality – Restaurant use (single tenant)



