Vacant Mixed-Use
For Sale
$350,000
808 Sebago Rd, Sebago, ME 04029
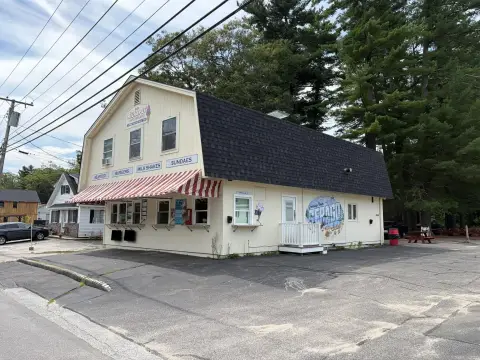
Two separate entrances and ample parking support flexible occupancy in a visible roadside setting.
Property Size1,024 SF
Price / SF$341.80
Days on Market135
Property Features for 808 Sebago Rd
General Information
Standard status
Active
Size
1,024 SF
Building Details
Year Built
1999
Listing Agency:
Keller Williams Realty
Listed By:
Cristina Eugen
(207) 710-1477
Source:
Aroostookrealestate
Added: Jun 3
Changed: Oct 4
Last Checked: Oct 7 at 2:29PM
Displayed information is deemed reliable but is not guaranteed and should be independently verified. All listing content including descriptions, pricing, images are the copyrighted material of Keller Williams Realty
Investment Insights
Based on property information with market context.
This 1,024-square-foot mixed-use property, built in 1999, is currently vacant and offered in as-is condition. Two separate entrances and ample parking provide a practical configuration for a future venture. Photos show the space arranged for retail use, while the property is positioned as a mixed-use opportunity.
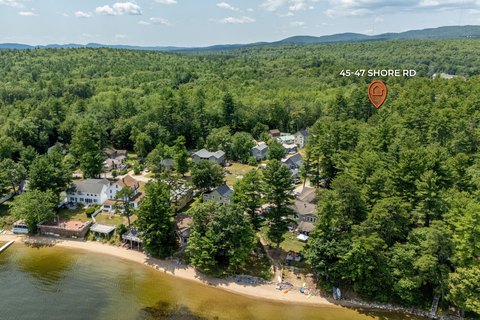
The site is located off Rt 114 near Nason's Beach and boat launch and Gemme's General Store, with views of Sebago Lake. It is also described as being near Naples, Standish, Gorham, downtown Portland, the Lakes Region, major ski resorts, and the White Mountains. Buyers are responsible for investigating development and zoning requirements directly with the Town of Sebago.
The site is located off Rt 114 near Nason's Beach and boat launch and Gemme's General Store, with views of Sebago Lake. It is also described as being near Naples, Standish, Gorham, downtown Portland, the Lakes Region, major ski resorts, and the White Mountains. Buyers are responsible for investigating development and zoning requirements directly with the Town of Sebago.
Key Highlights
- 1,024‑square‑foot mixed‑use property built in 1999
- Currently vacant and offered in as‑is condition
- Two separate entrances
Financial Insights
Estimated NOI and Cap Rate
NOI / Yr
$12,718
Cap Rate
3.63%
Suggested Prices Based on Cap Rates
Cap Rate 5%
$254,360
$254.4K
Cap Rate 7%
$181,686
$181.7K
Cap Rate 9%
$141,311
$141.3K
Market Conditions
NOI Build-Up for 1,024 SF
Gross rent
$22.1K $21.60/SF
− Vacancy
−$1.8K −$1.73/SF
EGI
$20.3K $19.87/SF
− OpEx
−$7.6K −$7.45/SF
NOI
$12.7K $12.42/SF
Area
Cumberland County, ME
Vacancy
8.00%
Lease Rate
$21.60 /SF/Yr
Expense Ratio
37.50%
Simulate Cap Rate and NOI
Suggested Prices Based on Cap Rates
Cap Rate 5%
$254,360
Cap Rate 7%
$181,686
Cap Rate 9%
$141,311
Alternative Uses
Best Use
Mixed Use
$181.7K
$159.0K – $212.0K
NOI $12,718 @ 7.0% cap · market cap 3.63%
Second Best
Retail
$153.0K
$133.9K – $178.5K
NOI $10,709 @ 7.0% cap · market cap 3.06%
Theoretical Best
Office A
$281.4K
$246.3K – $328.4K
NOI $19,701 @ 7.0% cap · market cap 5.63%
Zoning and permitted uses should be independently verified with authorities.
How Realmo checks its estimates
Property Analytics
Unlock full access to Insights
Subscribe to Realmo Intelligence
Open Analytics
Current Use
Location Intelligence
Trade Area within ½ mile
14
Businesses Nearby
Explore this area
Business Placement
Demographics for 04029, ME
1,917
Population
1,506
Households
1.3
Avg Household Size
47
Median Age
24%
College-Educated
87%
High-School Grad
32.9 sq mi
ZIP Area
58
Density / Sq Mi
$71,845
Median Household Income
$40,838
Median Earnings
$1,302
Median Rent
$272,900
Median Home Value
Check the figures for this property
Cap Rate, Value Estimation, Potential NOI and more
View Realmo Analytics
Market
Vacancy Rate% for Retail in Northeast region

Questions? Ask Rey
Realmo’s AI knows this listing — price, zoning, demand, history. Ask anything.
Frequently Asked Questions
What type of property is this?
Mixed-use property - Two separate entrances and ample parking support flexible occupancy in a visible roadside setting.
Where is this mixed-use property located?
The property is located at 808 Sebago Rd Sebago, ME.
What is the asking price?
The asking price for this property is $350,000.
What are key features of this property?
This property features: 1,024‑square‑foot mixed‑use property built in 1999; Currently vacant and offered in as‑is condition; Two separate entrances


