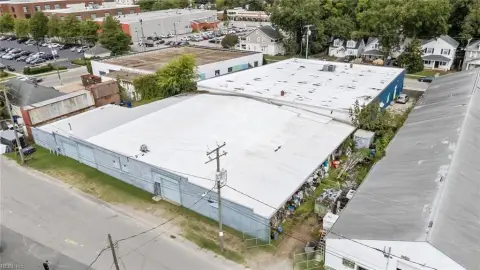
Four-Suite Flex Warehouse
For Sale
$4,675,000
801 East 25th Street, Norfolk, VA 23504
Fully leased flex building with four tenant suites, grade-level doors, and convenient access to major transportation routes.
Property Size18,740 SF
Price / SF$249.47
Days on Market108
Property Features for 801 East 25th Street
General Information
Standard status
Active
Size
18,740 SF
Property subtype
Industrial
Occupancy
100%
Additional Details
Highway Access
Yes
Building Details
Building Size
18,740 SF
Year Built
2009
Tenancy
Multi
Listing Agency:
S.L. Nusbaum Realty Co
Listed By:
Bill Overman, CCIM · License #0225054722
(757) 640-2254
Source:
Slnusbaum
Added: Jun 29
Changed: Oct 7
Last Checked: Oct 12 at 5:10PM
Displayed information is deemed reliable but is not guaranteed and should be independently verified. All listing content including descriptions, pricing, images are the copyrighted material of S.L. Nusbaum Realty Co
Investment Insights
Based on property information with market context.
This fully leased 18,740-square-foot flex building is demised into four functional tenant suites, providing separate space for light industrial, warehouse, or service-oriented operations. The property includes grade-level doors designed for practical loading and straightforward access, along with ample parking and maneuverability for tenant vehicles and service traffic.
Located in the West Norfolk industrial submarket, the asset offers direct access to I-664 and Route 164 and proximity to the Port of Virginia. The surrounding corridor supports efficient regional connectivity, which can be a key consideration for logistics and distribution-adjacent users.
With 100% leasing and stable in-place tenancy, this is suited for buyers seeking a move-forward opportunity in a flex/warehouse configuration already arranged for multiple occupancies. The four-suite layout can also be useful for tenants or operators who prefer compartmentalized space within one building while relying on the existing functional features such as grade-level access, parking, and vehicle maneuvering.
Located in the West Norfolk industrial submarket, the asset offers direct access to I-664 and Route 164 and proximity to the Port of Virginia. The surrounding corridor supports efficient regional connectivity, which can be a key consideration for logistics and distribution-adjacent users.
With 100% leasing and stable in-place tenancy, this is suited for buyers seeking a move-forward opportunity in a flex/warehouse configuration already arranged for multiple occupancies. The four-suite layout can also be useful for tenants or operators who prefer compartmentalized space within one building while relying on the existing functional features such as grade-level access, parking, and vehicle maneuvering.
Key Highlights
- Fully leased 18,740 SF flex building demised into four (4) tenant suites
- 100% leased with a diverse tenant mix and stable cash flow
- Grade‑level doors with ample parking and maneuverability
Financial Insights
Estimated NOI and Cap Rate
NOI / Yr
$182,423
Cap Rate
3.90%
Suggested Prices Based on Cap Rates
Cap Rate 5%
$3,648,460
$3.6M
Cap Rate 7%
$2,606,043
$2.6M
Cap Rate 9%
$2,026,922
$2.0M
Market Conditions
NOI Build-Up for 18,740 SF
Gross rent
$292.3K $15.60/SF
− Vacancy
−$11.7K −$0.62/SF
EGI
$280.7K $14.98/SF
− OpEx
−$98.2K −$5.24/SF
NOI
$182.4K $9.73/SF
Area
Norfolk, VA
Vacancy
4.00%
Lease Rate
$15.60 /SF/Yr
Expense Ratio
35.00%
Simulate Cap Rate and NOI
Suggested Prices Based on Cap Rates
Cap Rate 5%
$3,648,460
Cap Rate 7%
$2,606,043
Cap Rate 9%
$2,026,922
Alternative Uses
Best Use
Flex RnD
$2.61M
$2.28M – $3.04M
NOI $182,423 @ 7.0% cap · market cap 3.90%
Second Best
Warehouse
$2.13M
$1.86M – $2.49M
NOI $149,101 @ 7.0% cap · market cap 3.19%
Theoretical Best
Office A
$3.98M
$3.48M – $4.64M
NOI $278,279 @ 7.0% cap · market cap 5.95%
Zoning and permitted uses should be independently verified with authorities.
How Realmo checks its estimates
Property Analytics
Unlock full access to Insights
Subscribe to Realmo Intelligence
Open Analytics
Current Use
Lease Details
100%
Occupancy
Multi-tenant
Tenancy
Yes
Highway access
Location Intelligence
Trade Area within ½ mile
805
Businesses Nearby
Under-served
Demand for This Use
Explore this area
Business Placement
Demographics for 23504, VA
22,465
Population
9,462
Households
2.4
Avg Household Size
30
Median Age
24%
College-Educated
83%
High-School Grad
4.1 sq mi
ZIP Area
5,479
Density / Sq Mi
$43,156
Median Household Income
$26,707
Median Earnings
$872
Median Rent
$259,500
Median Home Value
Check the figures for this property
Cap Rate, Value Estimation, Potential NOI and more
View Realmo Analytics
Market
Vacancy Rate% for Industrial in South region

Questions? Ask Rey
Realmo’s AI knows this listing — price, zoning, demand, history. Ask anything.




Similar Off Market Nearby
- Heavenly Bites Truck — 1446a Church St, Norfolk, VA 23504
- Cloud90 LLC — 200 W 31st St, Norfolk, VA 23504
Frequently Asked Questions
What type of property is this?
Flex space - Fully leased flex building with four tenant suites, grade-level doors, and convenient access to major transportation routes.
Where is this flex space located?
The property is located at 801 East 25th Street Norfolk, VA.
What is the asking price?
The asking price for this property is $4,675,000.
What are key features of this property?
This property features: Fully leased 18,740 SF flex building demised into four (4) tenant suites; 100% leased with a diverse tenant mix and stable cash flow; Grade‑level doors with ample parking and maneuverability