Light Industrial Flex
For Sale
$1,400,000
Pending
80 Happy Valley Rd, Nampa, ID 83687
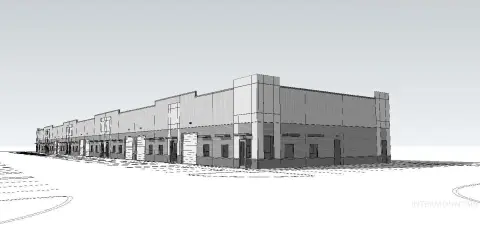
New light industrial building with drive-through warehouse doors and two small office suites.
Property Size5,054 SF
Lot Size0.65 Acres
Days on Market107
Property Features for 80 Happy Valley Rd
General Information
Standard status
Pending
Size
5,054 SF
Lot size
0.65 Acres
Property subtype
Commercial
Additional Details
Highway Access
Yes
Heavy Power
Yes
Amenities
Garage: 11 - 20 Spaces, Trailer Parking
11 - 20 Spaces, Trailer Parking
Building Details
Year Built
2026
Listing Agency:
Keller Williams Realty Boise
Listed By:
Van States · License #AB24555
(208) 391-5331
Source:
Clearwaterproperties
Added: Jul 4
Changed: Oct 16
Last Checked: Oct 16 at 9:13AM
Displayed information is deemed reliable but is not guaranteed and should be independently verified. All listing content including descriptions, pricing, images are the copyrighted material of Keller Williams Realty Boise

Ask AI about this property
Review the available facts, identify missing information and prepare questions for the agent.
Investment Insights
Based on property information with market context.
Brand new light industrial flex building on a 0.65-acre lot, featuring warehouse space plus two 544 SF office spaces. The offices include two restrooms total. The warehouse is served by drive-through doors, with 14' tall and 12' wide openings designed to support easier deliveries.
A non-structural dividing wall separates portions of the warehouse and can be removed if the owner wants to open up the layout or left in place for separate use. The building is steel-framed with 3-phase power and a gas-heated warehouse. Utilities provided include city water and septic. Completion is expected mid-July 2026, and the property is described as having easy access to I-84.
Additional details such as exact unit boundaries beyond the two office suites are not provided.
A non-structural dividing wall separates portions of the warehouse and can be removed if the owner wants to open up the layout or left in place for separate use. The building is steel-framed with 3-phase power and a gas-heated warehouse. Utilities provided include city water and septic. Completion is expected mid-July 2026, and the property is described as having easy access to I-84.
Additional details such as exact unit boundaries beyond the two office suites are not provided.
Key Highlights
- Brand‑new light industrial building in Nampa on a 0.65‑acre lot with easy access to I‑84
- Warehouse includes 14' tall, 12' wide drive‑through doors designed for deliveries
- Two 544 SF office suites, each with 2 restrooms
Financial Insights
Estimated NOI and Cap Rate
NOI / Yr
$52,736
Cap Rate
3.77%
Suggested Prices Based on Cap Rates
Cap Rate 5%
$1,054,720
$1.1M
Cap Rate 7%
$753,371
$753.4K
Cap Rate 9%
$585,956
$586.0K
Market Conditions
NOI Build-Up for 5,054 SF
Gross rent
$66.7K $13.20/SF
− Vacancy
−$4.7K −$0.92/SF
EGI
$62.0K $12.28/SF
− OpEx
−$9.3K −$1.84/SF
NOI
$52.7K $10.43/SF
Area
Nampa, ID
Vacancy
7.00%
Lease Rate
$13.20 /SF/Yr
Expense Ratio
15.00%
Simulate Cap Rate and NOI
Suggested Prices Based on Cap Rates
Cap Rate 5%
$1,054,720
Cap Rate 7%
$753,371
Cap Rate 9%
$585,956
Alternative Uses
Best Use
Warehouse
$753.4K
$659.2K – $878.9K
NOI $52,736 @ 7.0% cap · market cap 3.77%
Second Best
Flex RnD
$721.4K
$631.2K – $841.7K
NOI $50,499 @ 7.0% cap · market cap 3.61%
Theoretical Best
Office A
$1.28M
$1.12M – $1.49M
NOI $89,492 @ 7.0% cap · market cap 6.39%
Zoning and permitted uses should be independently verified with authorities.
How Realmo checks its estimates
Property Analytics
Current Use
Lease Details
Yes
Heavy power
Yes
Highway access
Location Intelligence
Trade Area within ½ mile
109
Businesses Nearby
Under-served
Demand for This Use
Explore this area
Business Placement
Demographics for 83687, ID
37,254
Population
14,484
Households
2.6
Avg Household Size
33
Median Age
27%
College-Educated
91%
High-School Grad
49.4 sq mi
ZIP Area
754
Density / Sq Mi
$72,294
Median Household Income
$40,328
Median Earnings
$1,416
Median Rent
$369,700
Median Home Value
Market
Vacancy Rate% for Industrial in West region



Frequently Asked Questions
What type of property is this?
Flex space - New light industrial building with drive-through warehouse doors and two small office suites.
Where is this flex space located?
The property is located at 80 Happy Valley Rd Nampa, ID.
What is the asking price?
The asking price for this property is $1,400,000.
What are key features of this property?
This property features: Brand‑new light industrial building in Nampa on a 0.65‑acre lot with easy access to I‑84; Warehouse includes 14' tall, 12' wide drive‑through doors designed for deliveries; Two 544 SF office suites, each with 2 restrooms


