Two-Bedroom Residential Income
For Sale
$1,100,000
8 Vanderbilt Avenue 3A, Brooklyn, NY 11205
Condominium residence with open living areas, two full baths, modern finishes, and access to extensive shared amenities.
Property Size1,072 SF
Price / SF$1,026
Days on Market65
Property Features for 8 Vanderbilt Avenue 3A
General Information
Standard status
Active
Size
1,072 SF
Property subtype
Apartment
Taxes and HOA fees
Annual Taxes
$270
Building Details
Building Size
1,072 SF
Year Built
2014
Listing Agency:
Keller Williams NYC
Listed By:
William Krooss-Tadas · License #10401258251
(631) 827-1541
Source:
Carlinwright
Added: Aug 3
Changed: Oct 5
Last Checked: Oct 5 at 9:23PM
Displayed information is deemed reliable but is not guaranteed and should be independently verified. All listing content including descriptions, pricing, images are the copyrighted material of Keller Williams NYC
Investment Insights
Based on property information with market context.
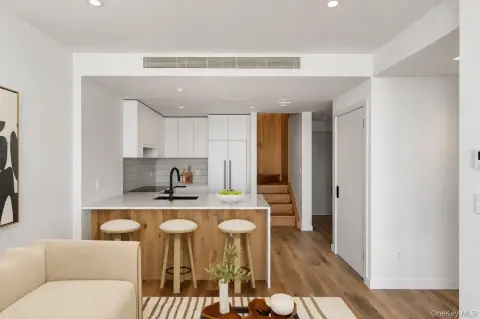
This 1,072-square-foot condominium residence includes two bedrooms, two full baths, an open living and dining arrangement, wide-plank hardwood flooring, oversized windows, and high ceilings. The kitchen features stainless-steel appliances, a dishwasher, substantial cabinetry, and generous work surfaces. Three-zone heating and cooling supports climate control, while an on-site laundry room adds convenience.
Completed in 2014, the LEED-certified, 12-story condominium was designed by FXFowle Architects. Building amenities include a glass-enclosed lobby, two elevators, fitness room, live-in superintendent, cold storage, bike room, package room, and cloud-based intercom system. Shared outdoor areas include a 30,000-square-foot landscaped courtyard and a roof deck with BBQ facilities and views toward the East River, Manhattan skyline, and Downtown Brooklyn.
The property is within the Brooklyn Navy Yard redevelopment and near Wegmans, retail, dining, creative workspaces, WeWork, and the NYC Ferry. Transit options include nearby CitiBike, bus service, the F train at York, A/C/F/R at Jay St-MetroTech, and the G at Clinton-Washington. The 421-A tax abatement remains in place until 2042.
Completed in 2014, the LEED-certified, 12-story condominium was designed by FXFowle Architects. Building amenities include a glass-enclosed lobby, two elevators, fitness room, live-in superintendent, cold storage, bike room, package room, and cloud-based intercom system. Shared outdoor areas include a 30,000-square-foot landscaped courtyard and a roof deck with BBQ facilities and views toward the East River, Manhattan skyline, and Downtown Brooklyn.
The property is within the Brooklyn Navy Yard redevelopment and near Wegmans, retail, dining, creative workspaces, WeWork, and the NYC Ferry. Transit options include nearby CitiBike, bus service, the F train at York, A/C/F/R at Jay St-MetroTech, and the G at Clinton-Washington. The 421-A tax abatement remains in place until 2042.
Key Highlights
- 1,072‑square‑foot condominium residence with 2 bedrooms and 2 full baths
- Completed in 2014; LEED‑certified 12‑story condominium designed by FXFowle Architects
- 30,000‑square‑foot landscaped courtyard plus roof deck with BBQ facilities
Financial Insights
Estimated NOI and Cap Rate
NOI / Yr
$32,727
Cap Rate
2.98%
Suggested Prices Based on Cap Rates
Cap Rate 5%
$654,540
$654.5K
Cap Rate 7%
$467,529
$467.5K
Cap Rate 9%
$363,633
$363.6K
Market Conditions
NOI Build-Up for 1,072 SF
Gross rent
$60.7K $56.64/SF
− Vacancy
−$1.2K −$1.13/SF
EGI
$59.5K $55.51/SF
− OpEx
−$26.8K −$24.98/SF
NOI
$32.7K $30.53/SF
Area
Brooklyn, NY
Vacancy
2.00%
Lease Rate
$56.64 /SF/Yr
Expense Ratio
45.00%
Simulate Cap Rate and NOI
Suggested Prices Based on Cap Rates
Cap Rate 5%
$654,540
Cap Rate 7%
$467,529
Cap Rate 9%
$363,633
Alternative Uses
Best Use
Apartment 5plus
$467.5K
$409.1K – $545.5K
NOI $32,727 @ 7.0% cap · market cap 2.98%
Second Best
—
—
no second resolved use
Theoretical Best
Specialty Retail
$887.6K
$776.7K – $1.04M
NOI $62,133 @ 7.0% cap · market cap 5.65%
Zoning and permitted uses should be independently verified with authorities.
Property Analytics
Unlock full access to Insights
Subscribe to Realmo Intelligence
Open Analytics
Current Use
Location Intelligence
Trade Area within ½ mile
5,981
Businesses Nearby
Explore this area
Business Placement
Demographics for 11205, NY
50,474
Population
19,200
Households
2.6
Avg Household Size
30
Median Age
52%
College-Educated
86%
High-School Grad
1.2 sq mi
ZIP Area
42,062
Density / Sq Mi
$86,753
Median Household Income
$59,901
Median Earnings
$2,307
Median Rent
$892,800
Median Home Value
Check the figures for this property
Cap Rate, Value Estimation, Potential NOI and more
View Realmo Analytics

Questions? Ask Rey
Realmo’s AI knows this listing — price, zoning, demand, history. Ask anything.
Frequently Asked Questions
What type of property is this?
Residential income property - Condominium residence with open living areas, two full baths, modern finishes, and access to extensive shared amenities.
Where is this residential income property located?
The property is located at 8 Vanderbilt Avenue 3A Brooklyn, NY.
What is the asking price?
The asking price for this property is $1,100,000.
What are key features of this property?
This property features: 1,072‑square‑foot condominium residence with 2 bedrooms and 2 full baths; Completed in 2014; LEED‑certified 12‑story condominium designed by FXFowle Architects; 30,000‑square‑foot landscaped courtyard plus roof deck with BBQ facilities



