Mixed-Use Property with
For Sale
$399,900
792 HIGHWAY 395 N, Colville, WA 99114
Commercial, COLVILLE, WA
Property Size4,290 SF
Lot Size6.30 Acres
Price / SF$93.22
Days on Market95
Property Features for 792 HIGHWAY 395 N
General Information
Property type
Commercial Sale
Property subtype
Other
Zoning description
Residential
Rooms
Basement
Parking features
Parking Lot, Off Street, Covered
Exterior features
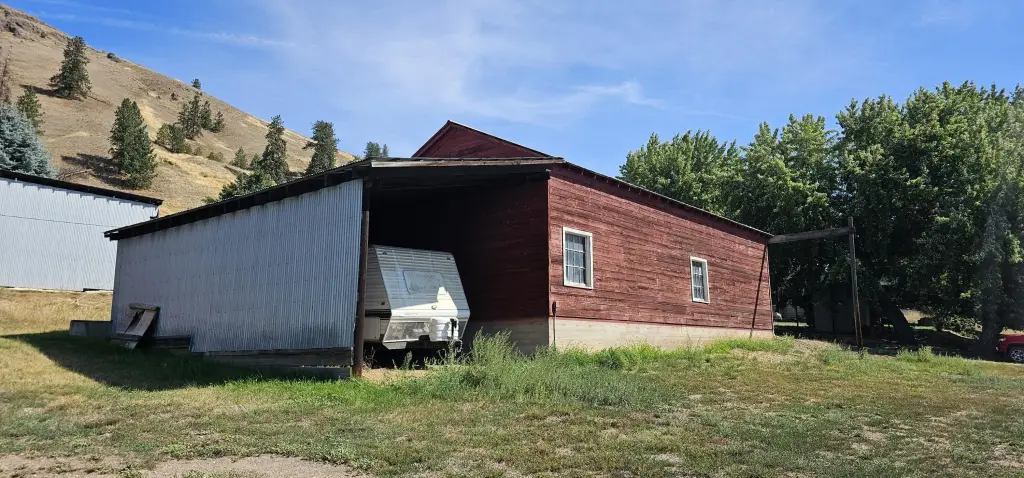
Road Frontage, Storage
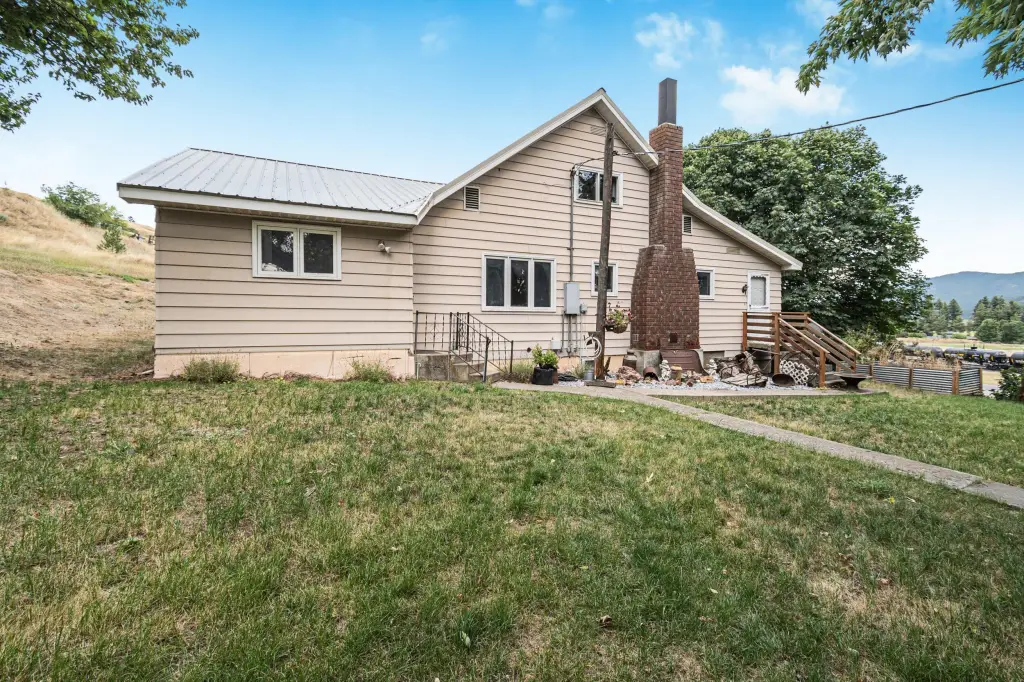
Fireplace
1
Basement
Full
Directions
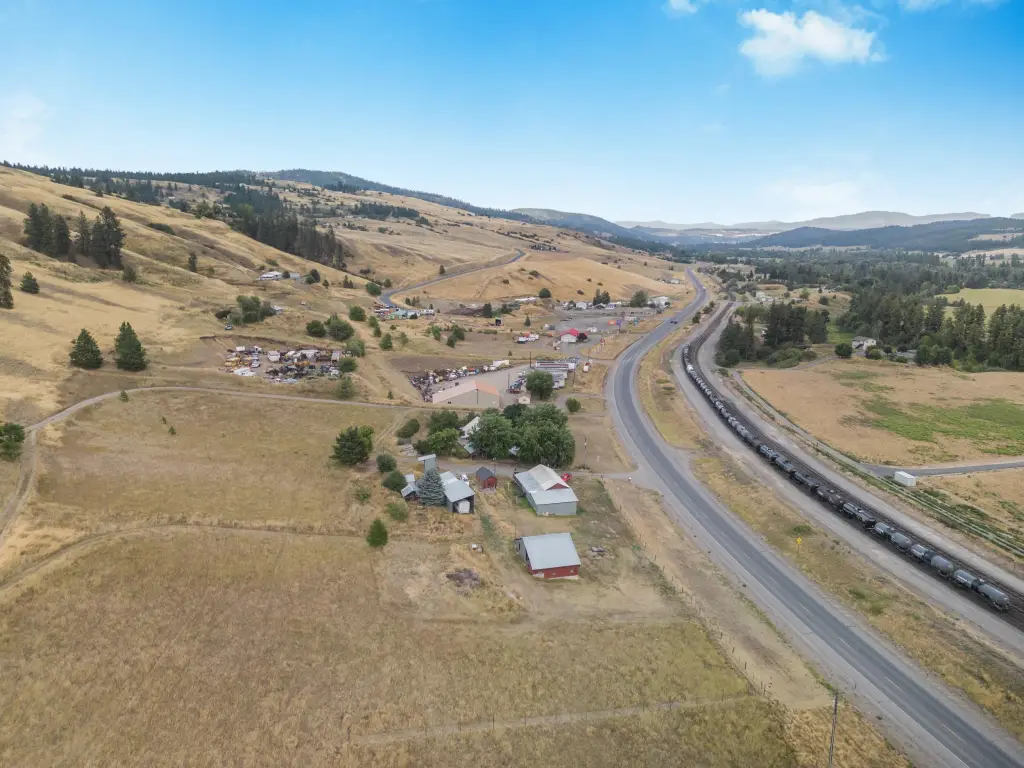
Travel on Hwy 395 between Colville and Kettle Falls. Property is located in the north side of Hwy 395 less than a mile outside of Kettle Falls.
Subdivision
S2 - Kettle Falls
Standard status
Active
APN
1929365
Size
4,290 SF
Lot size
6.30 Acres
Taxes and HOA fees
Tax Description
TAX #29, LS M/R (SP 39-95-2) (BAL TAX #29 IN 16-36-38)
Legal Description
TAX #29, LS M/R (SP 39-95-2) (BAL TAX #29 IN 16-36-38)
Utilities
Heating system
Forced Air, Central, Fireplace(s), Electric (Heating)
Water source
Public
Building Details
Year built
1922
Additional Structures
Storage
Listing Agency:
KELLER WILLIAMS REALTY COLVILLE
(509) 684-1414
Listed By:
Day Star Realty Team
(509) 593-1059
Added: Jul 15
Changed: Oct 8
Last Checked: Oct 17 at 7:06AM
MLS# 46189
Copyright © 2026 Northeast Washington Association of Realtor MLS. All rights reserved. All information provided by the listing agent/broker is deemed reliable but is not guaranteed and should be independently verified.

Ask AI about this property
Review the available facts, identify missing information and prepare questions for the agent.
Investment Insights
Based on property information with market context.
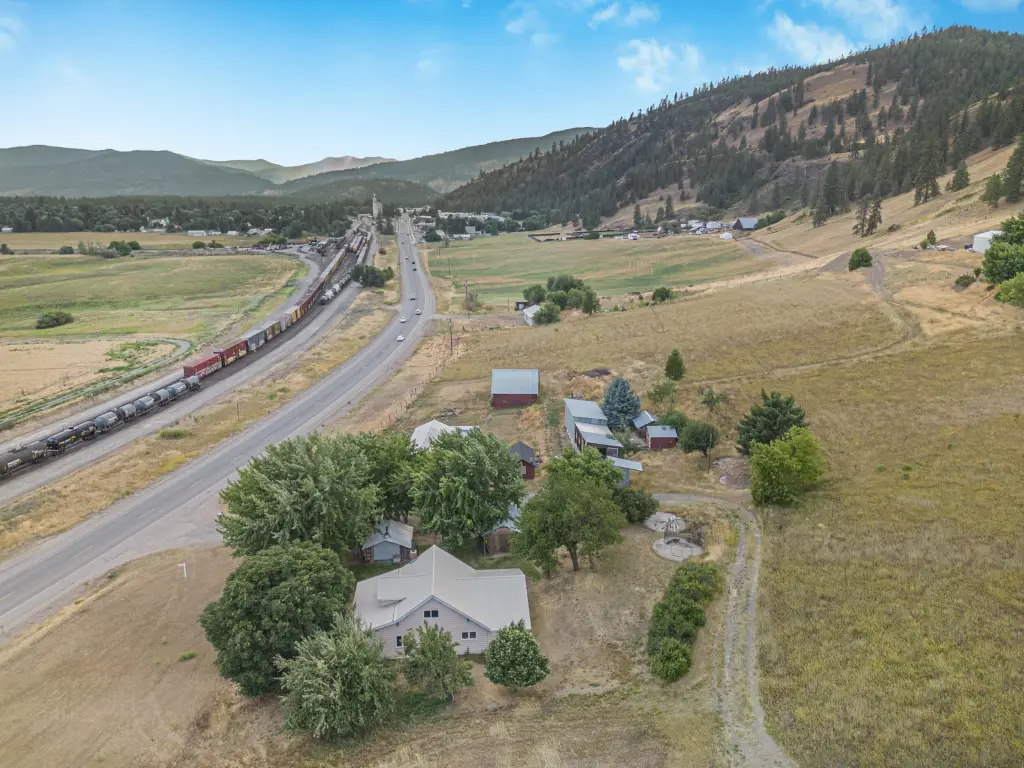
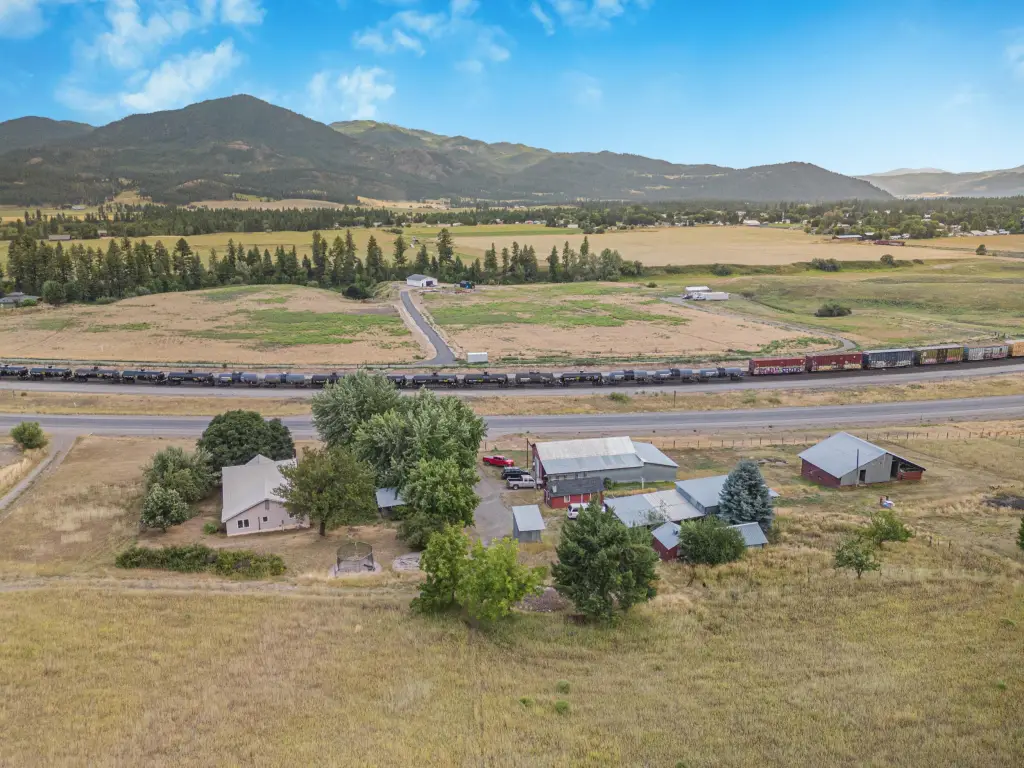
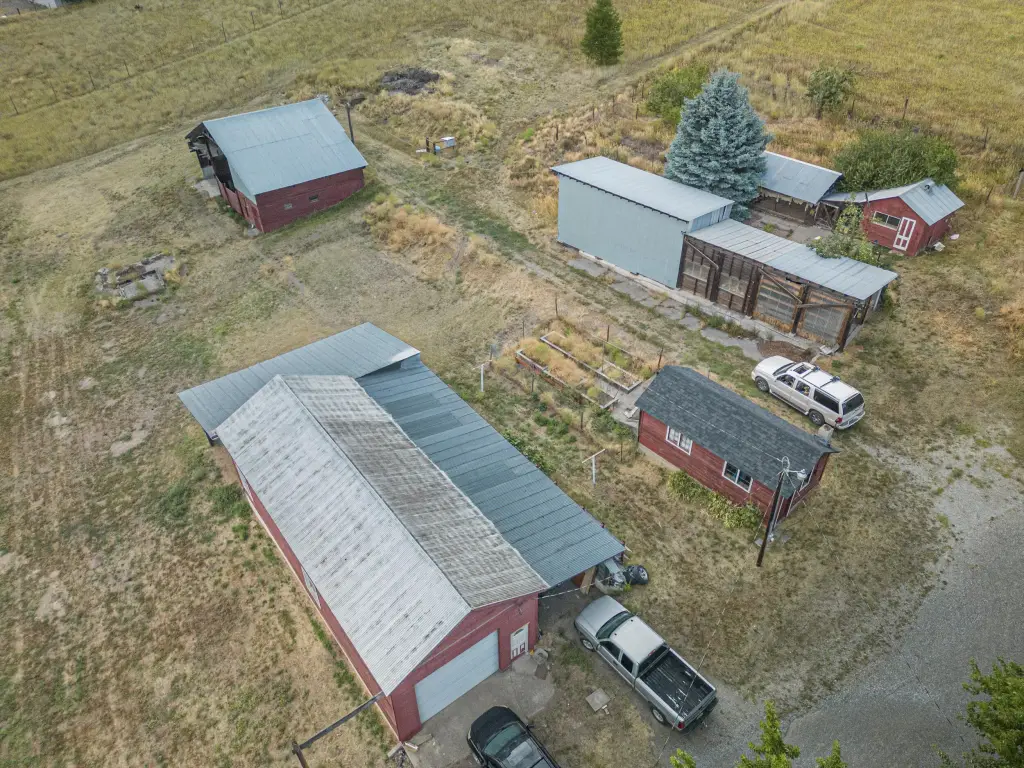
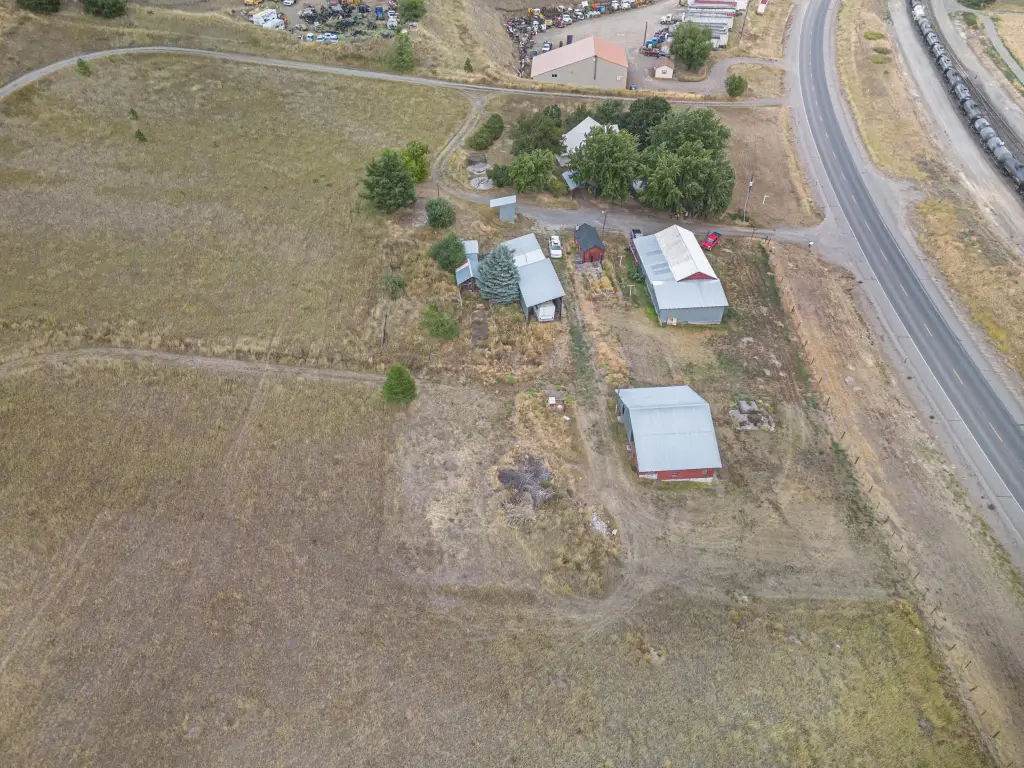
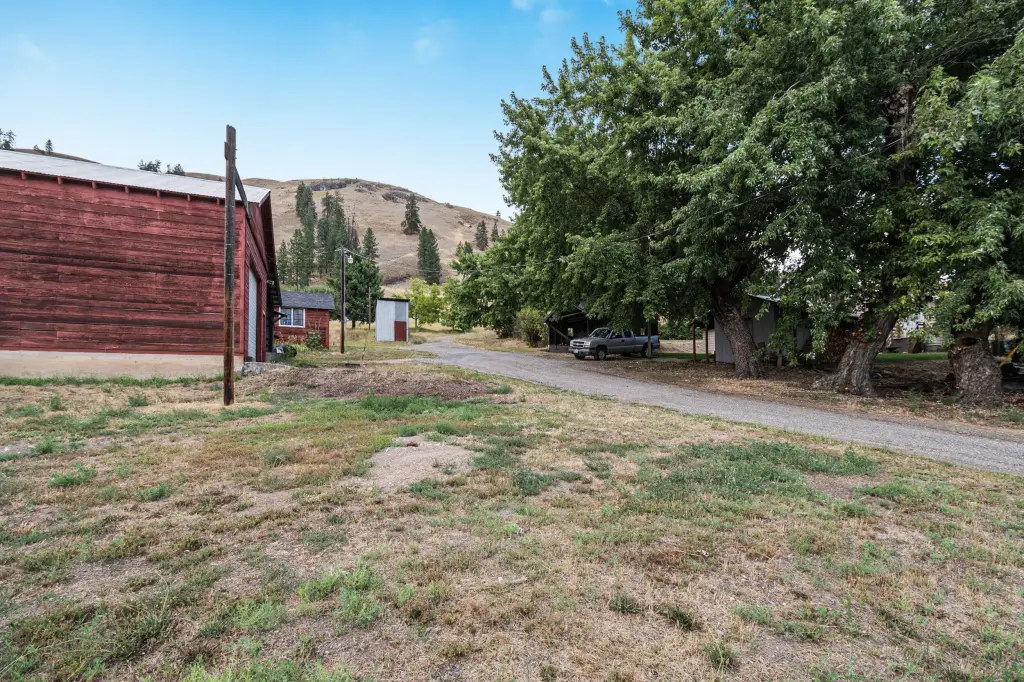
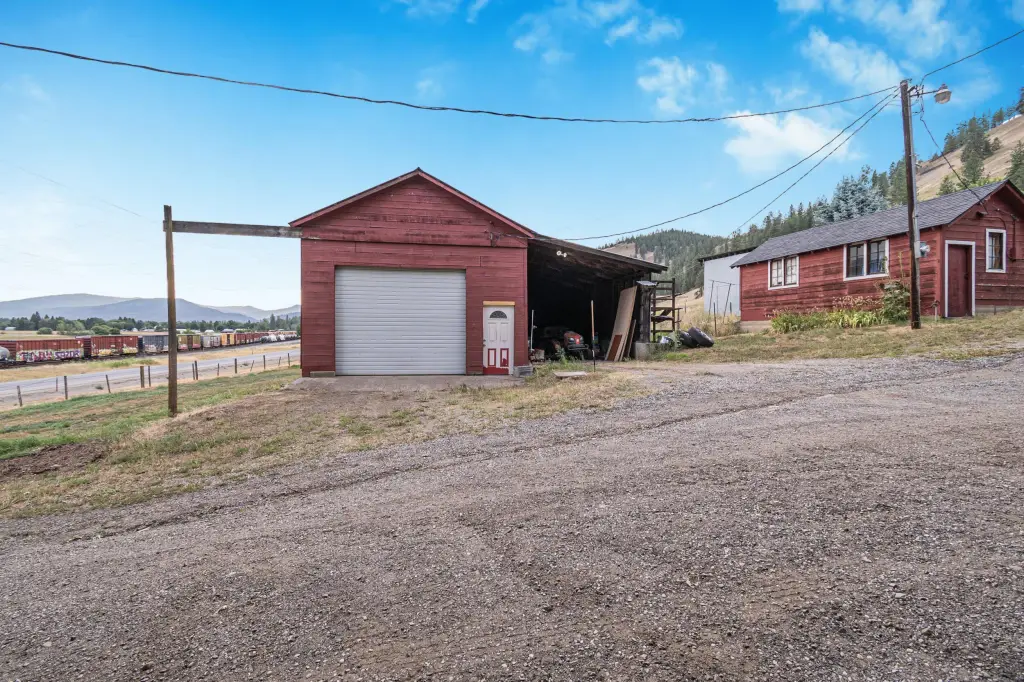
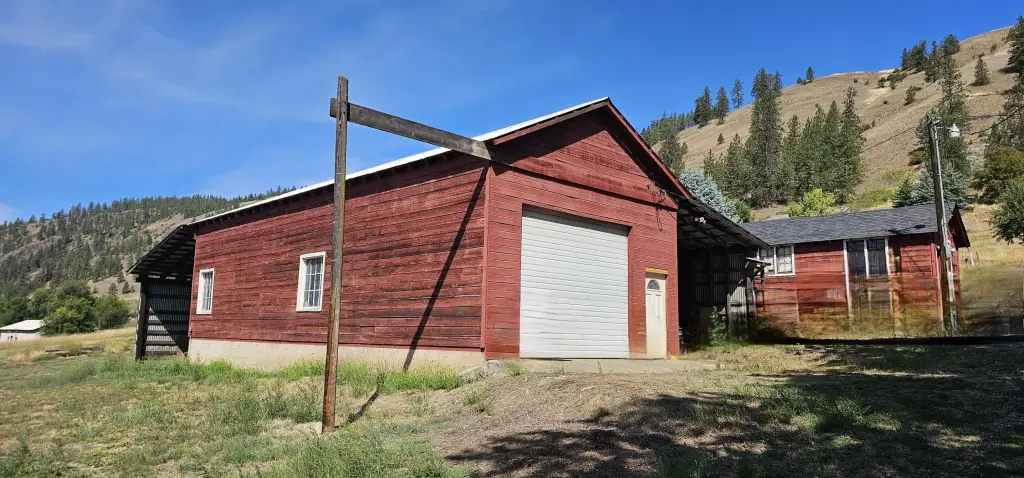
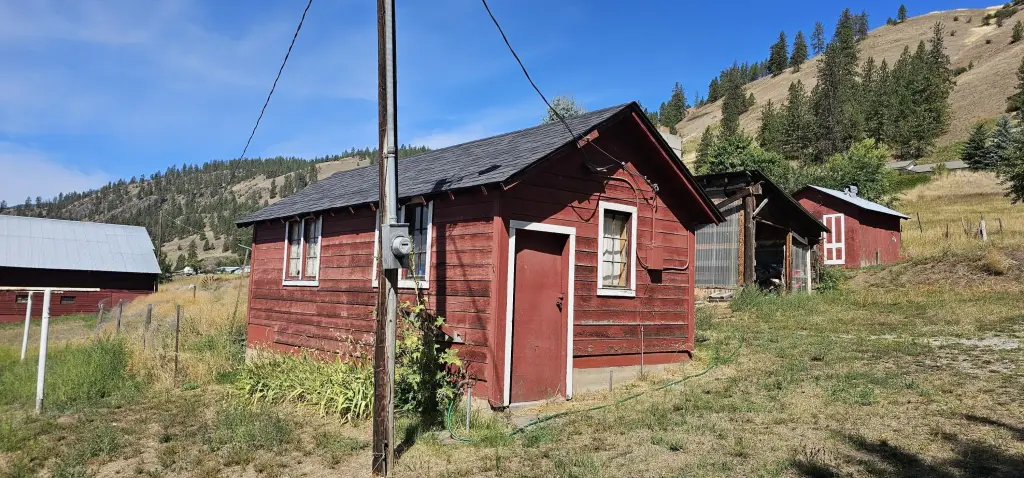
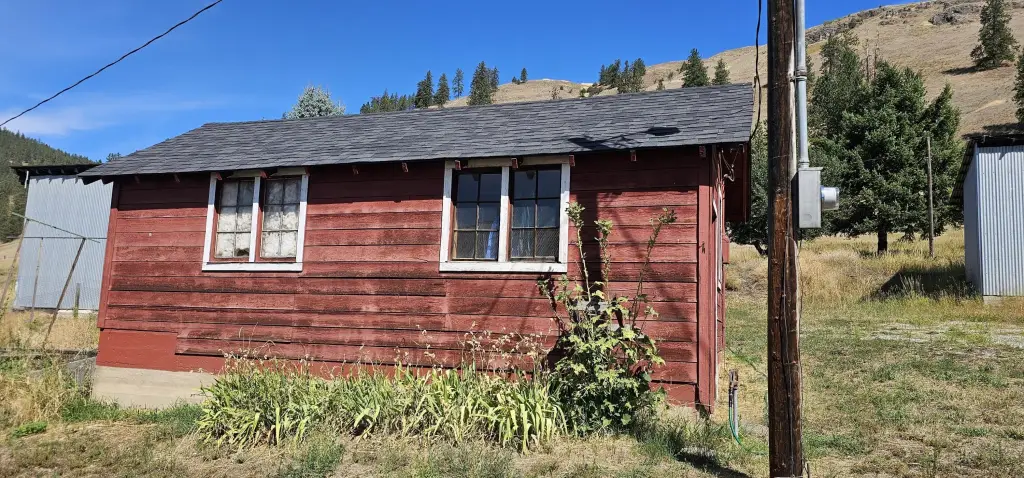
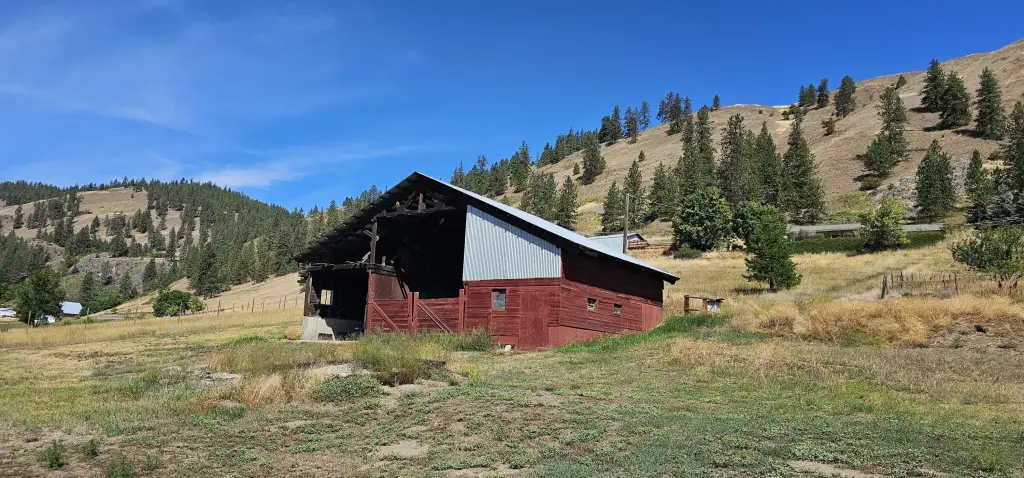
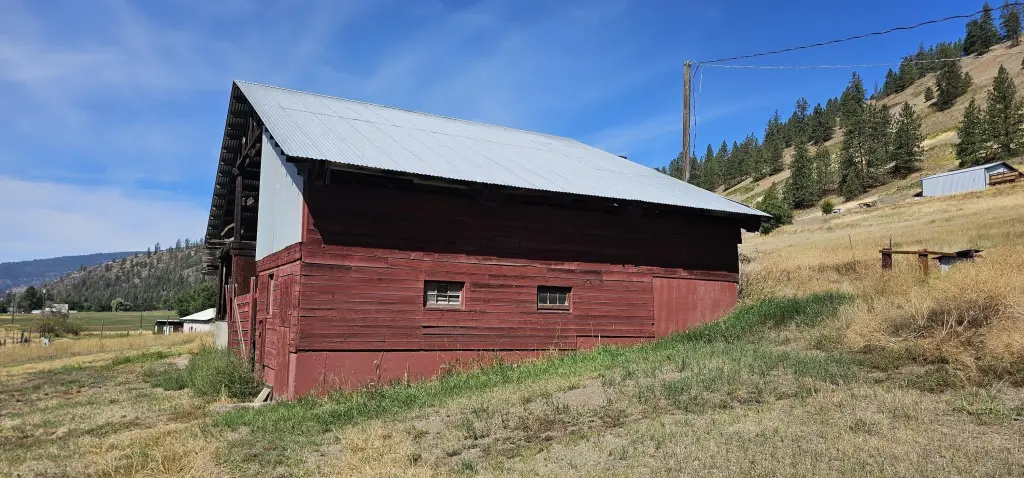
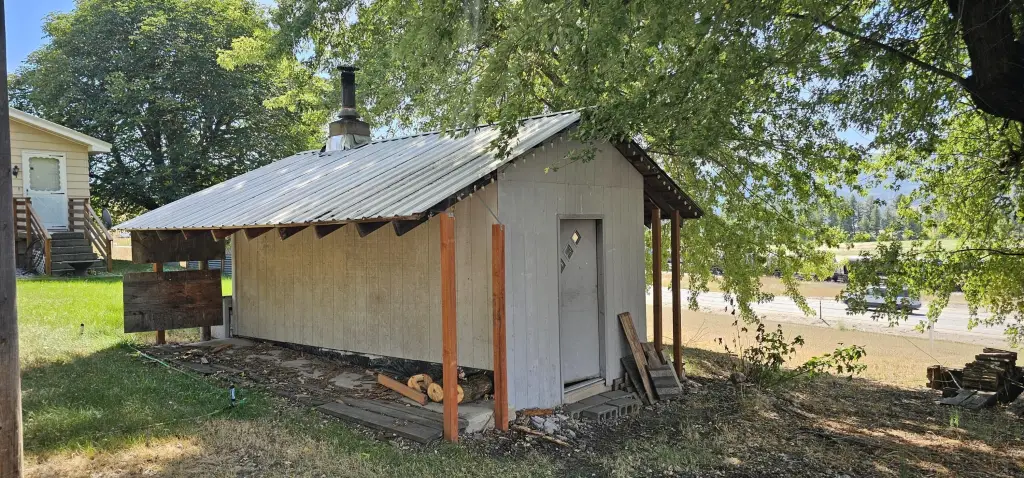
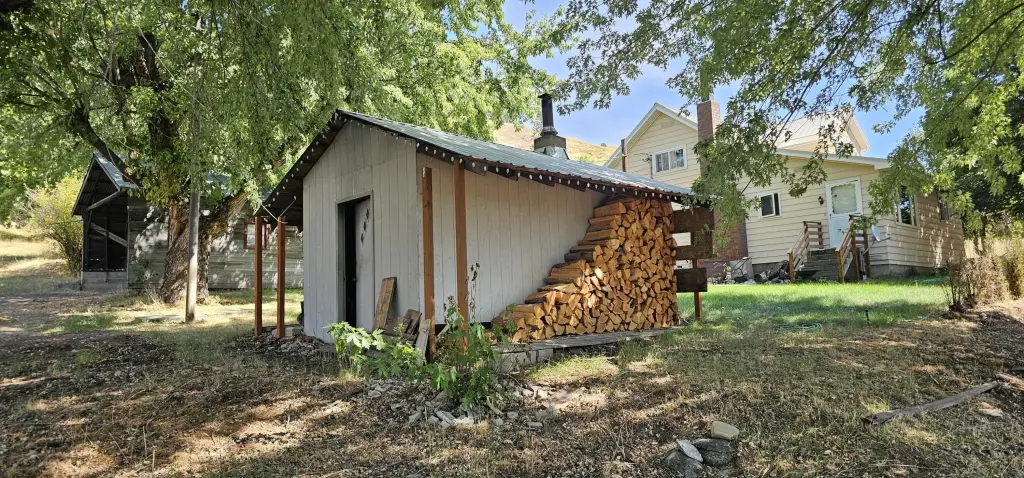
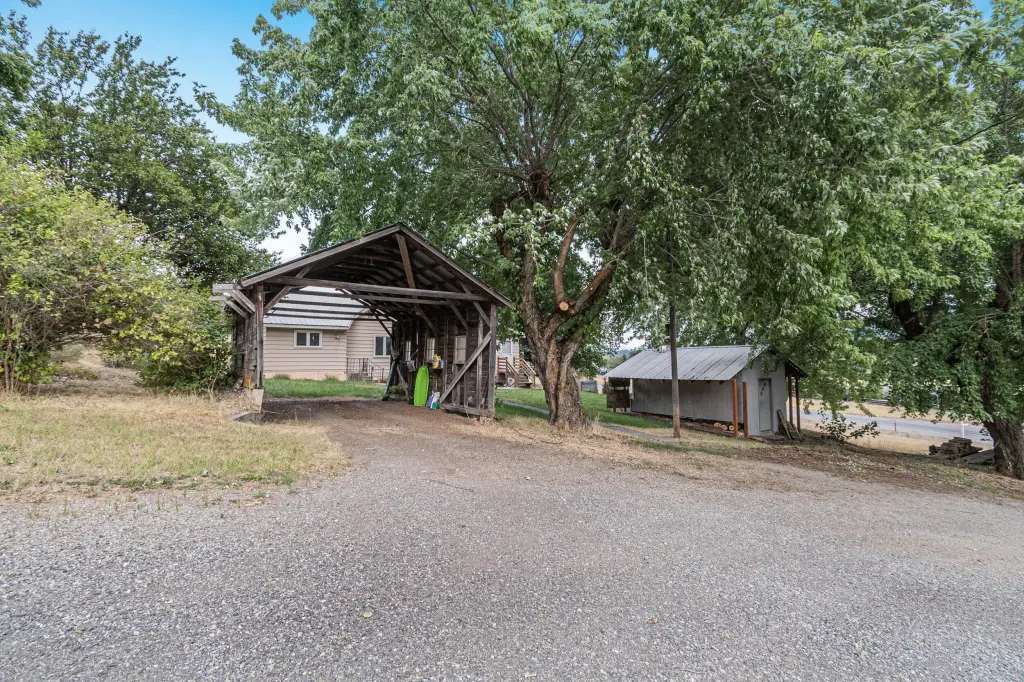
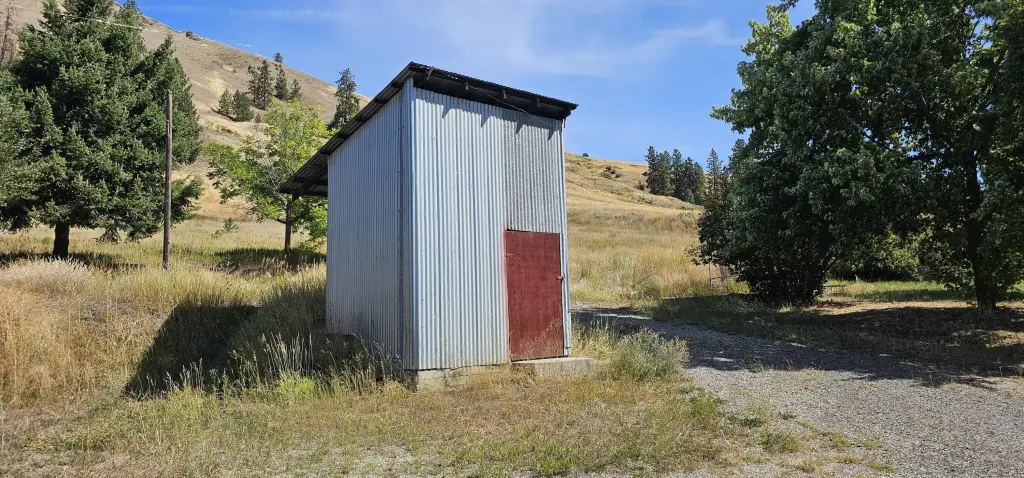
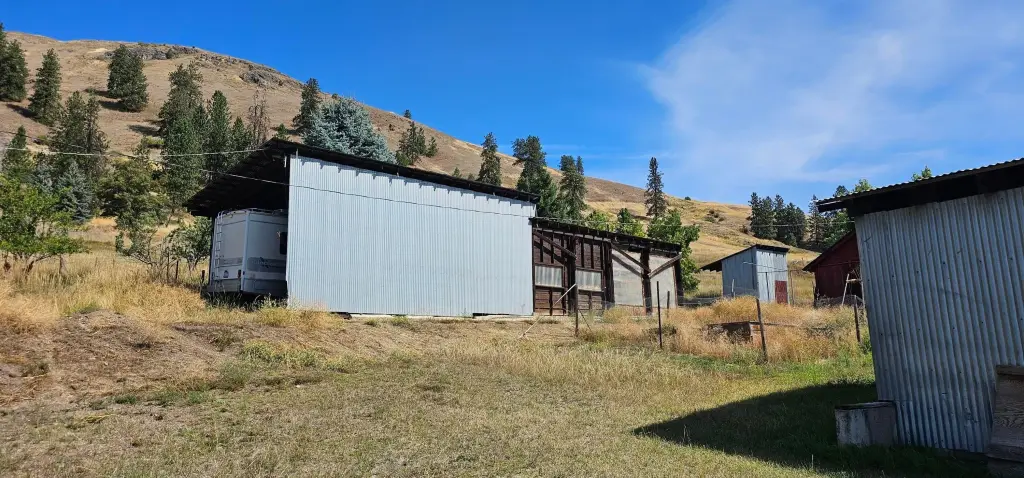
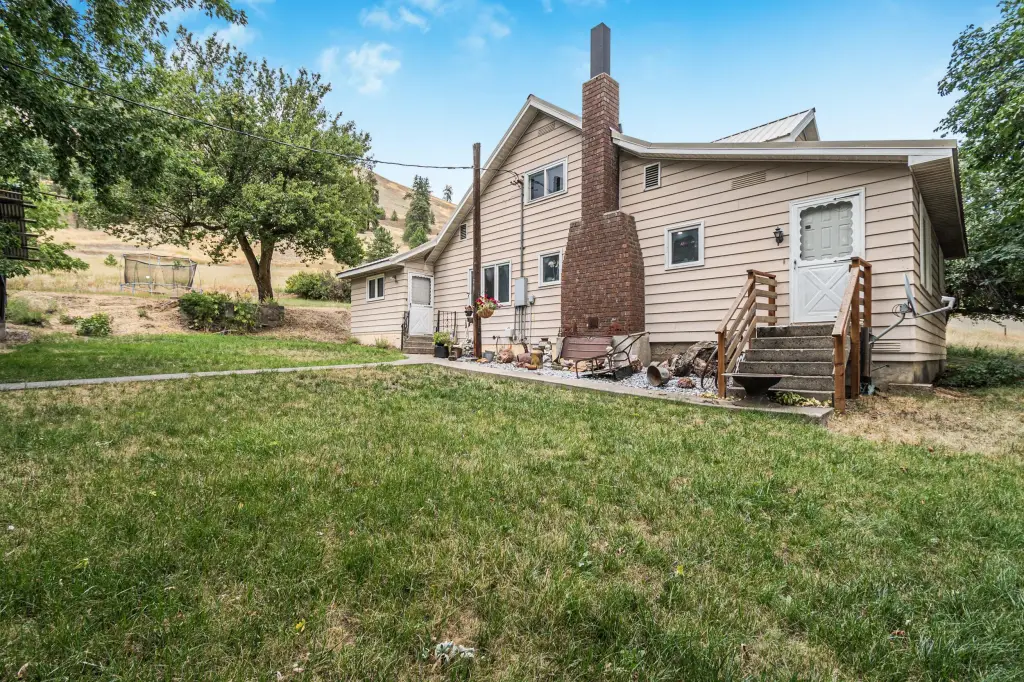
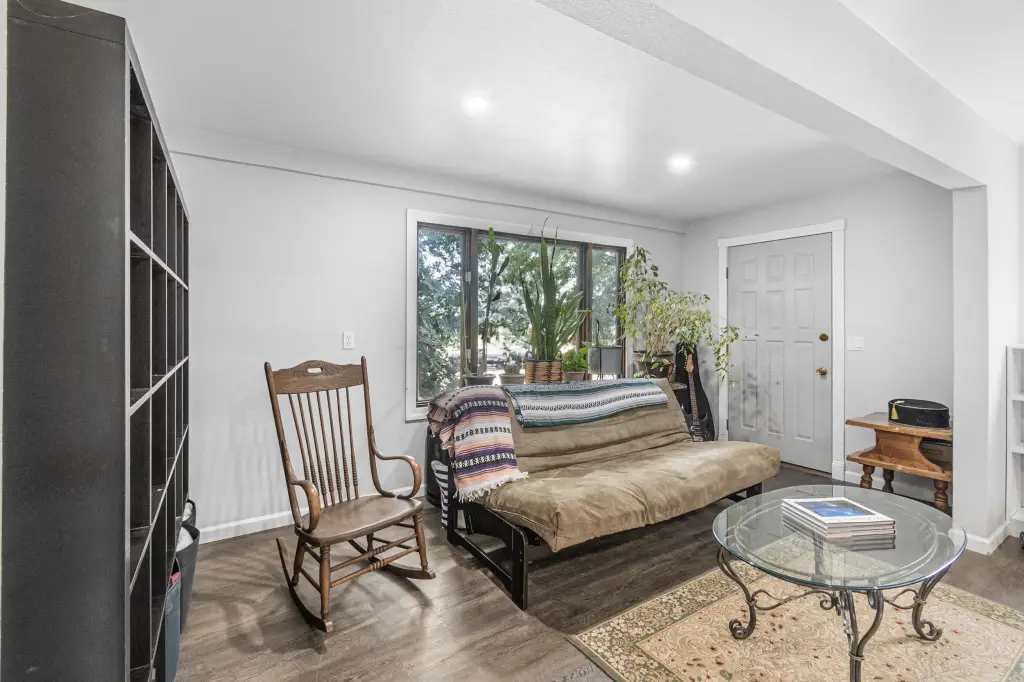
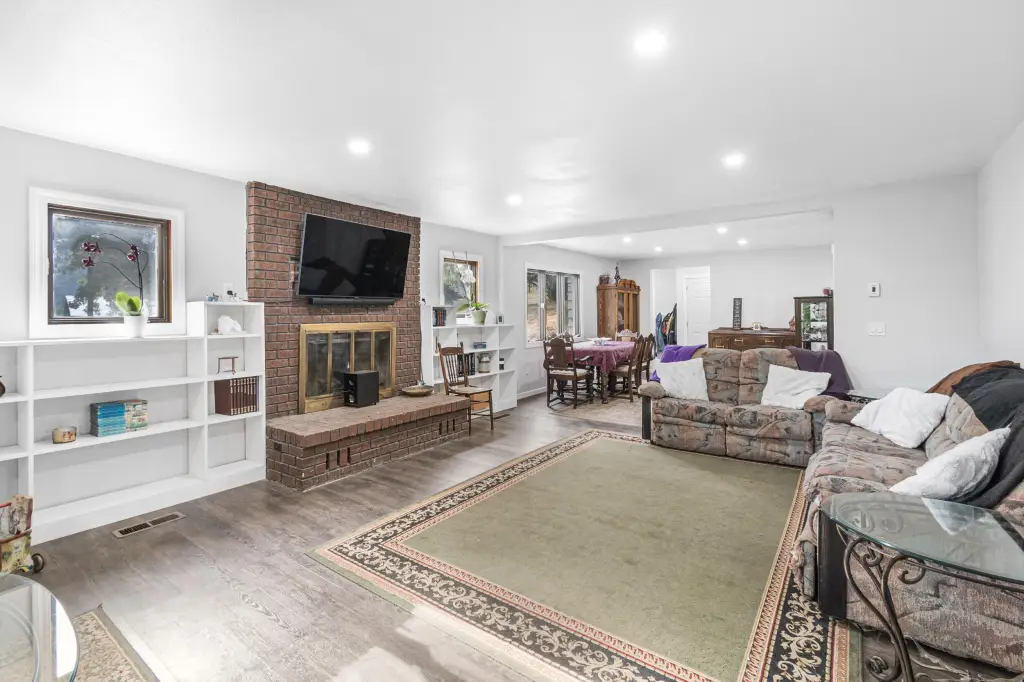
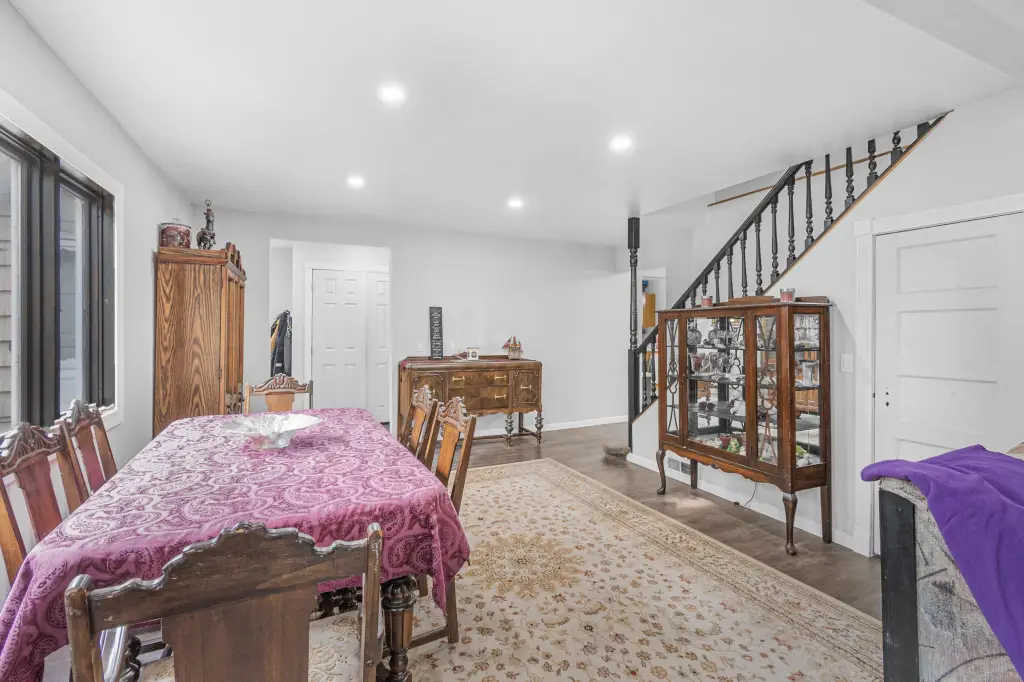
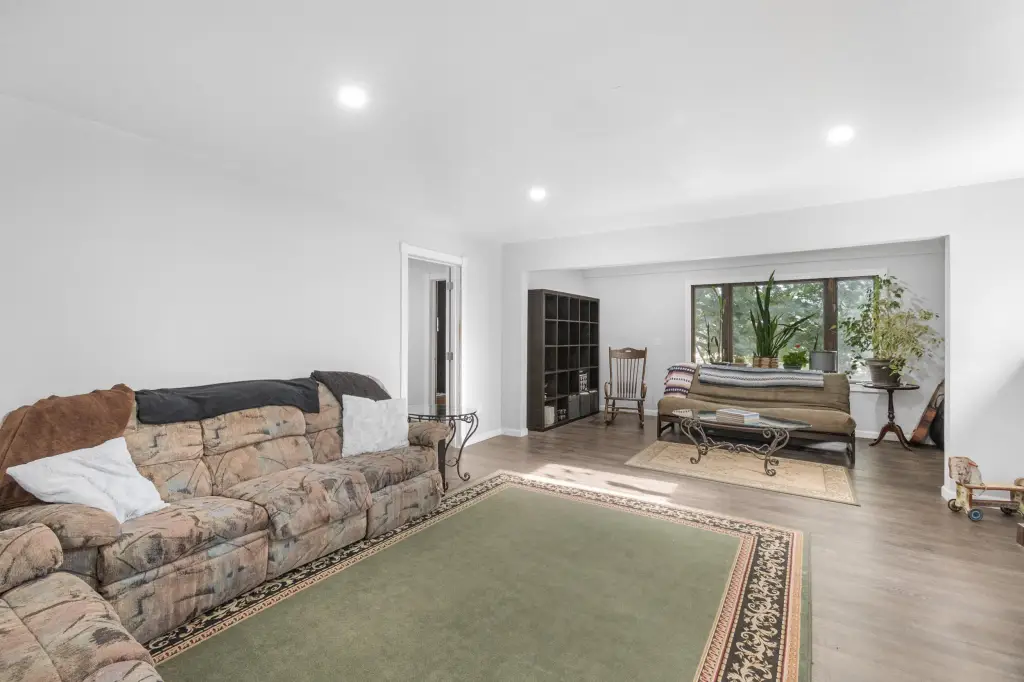
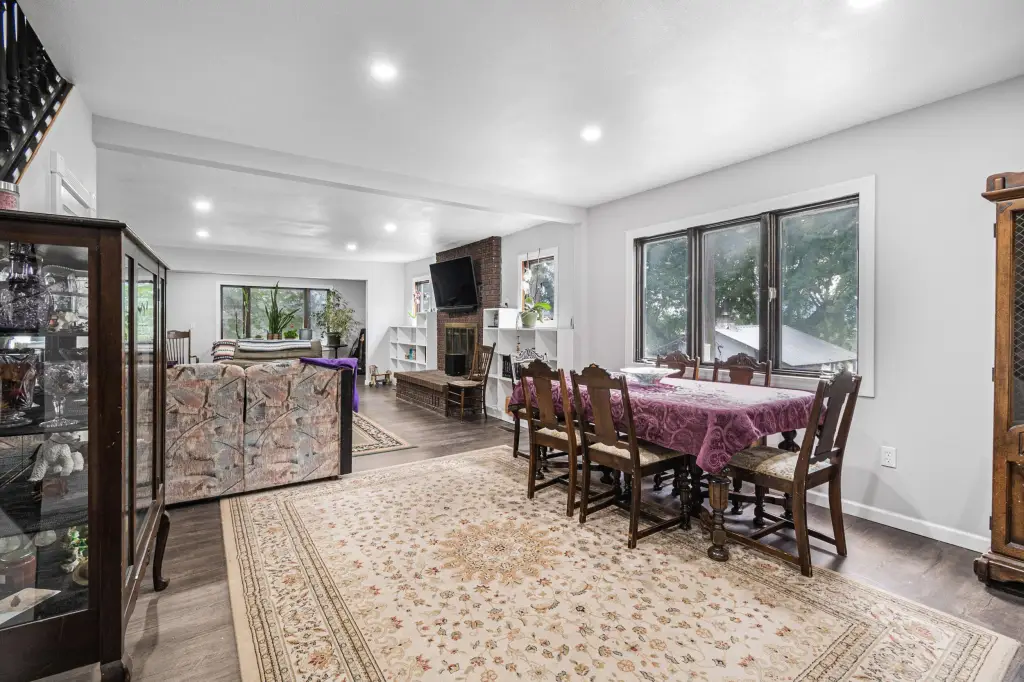
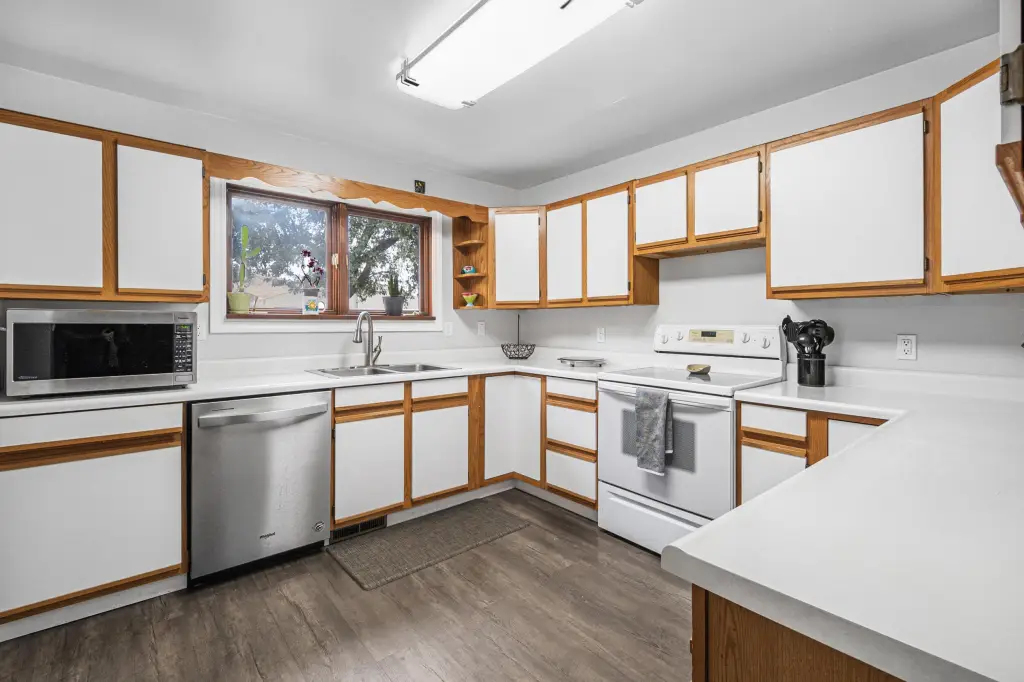
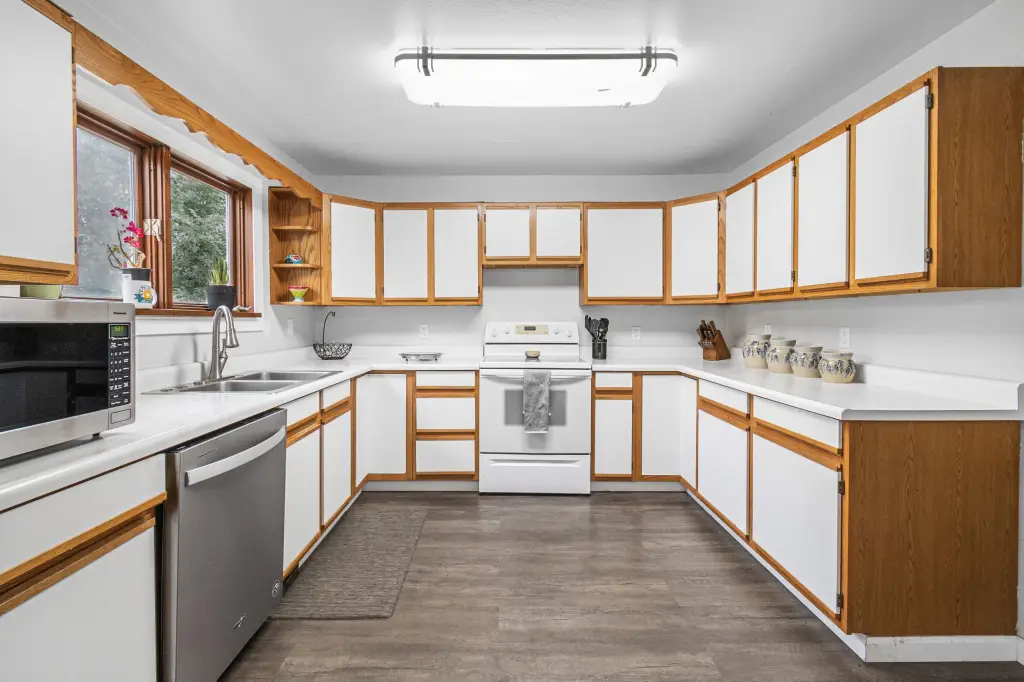
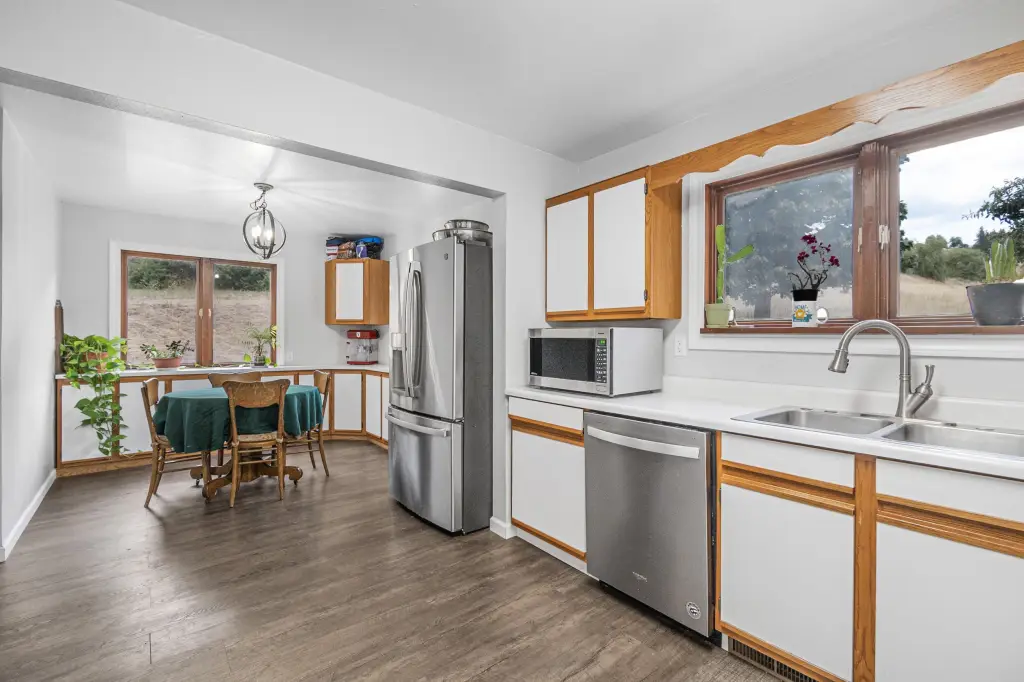
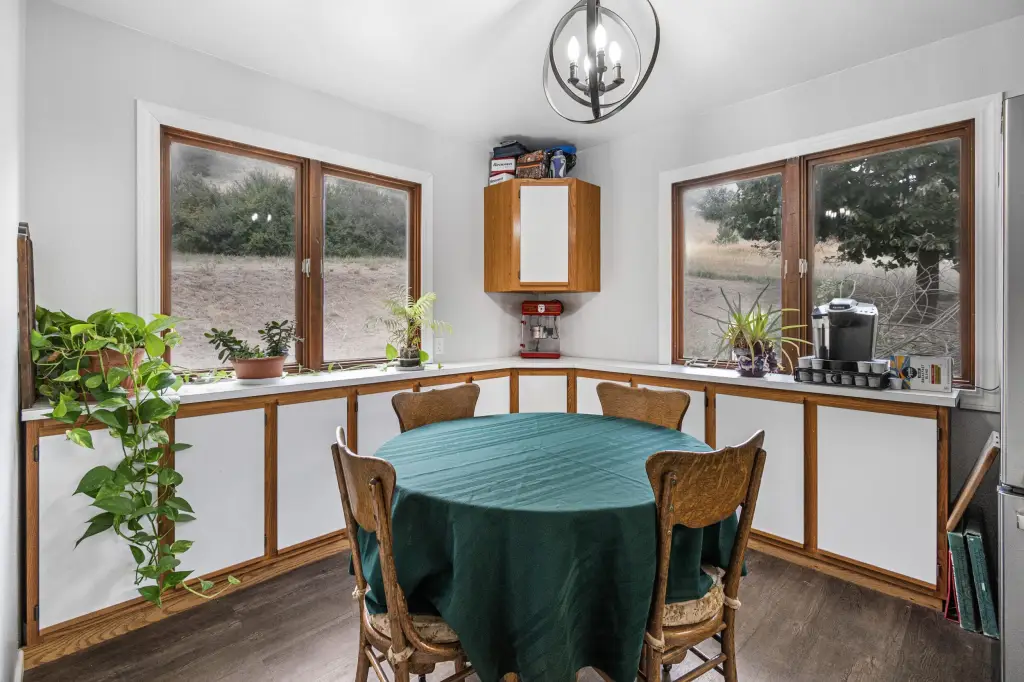
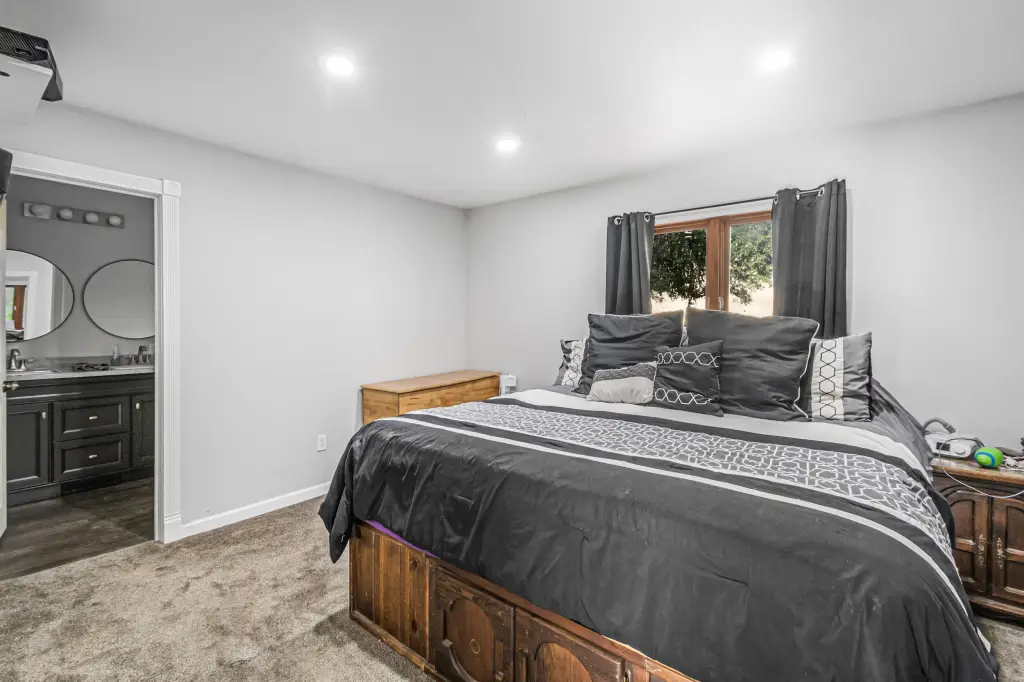
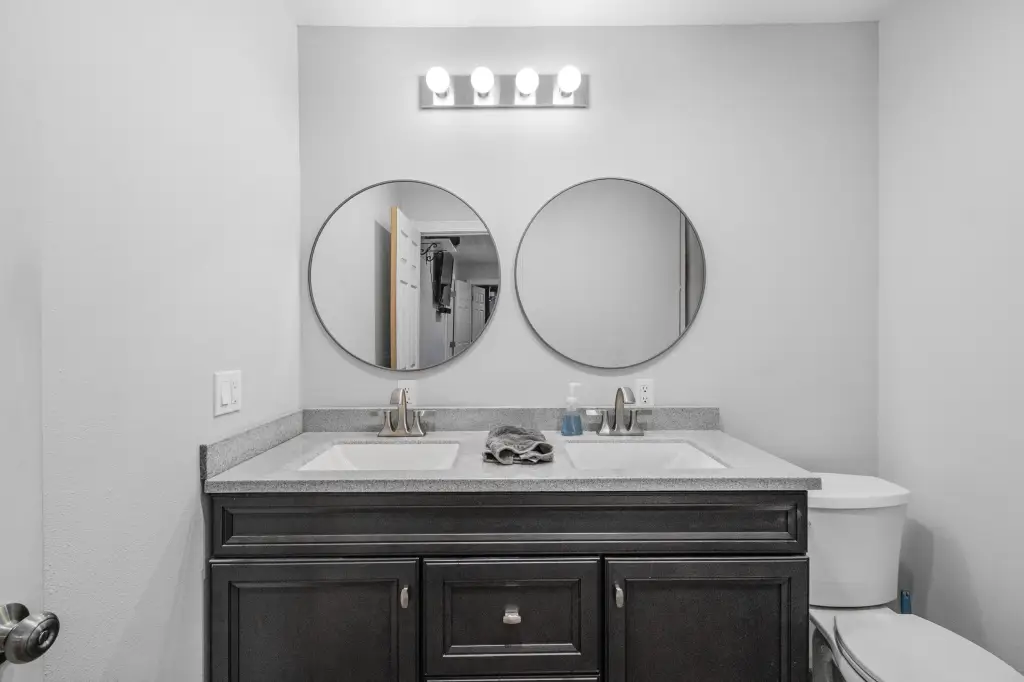
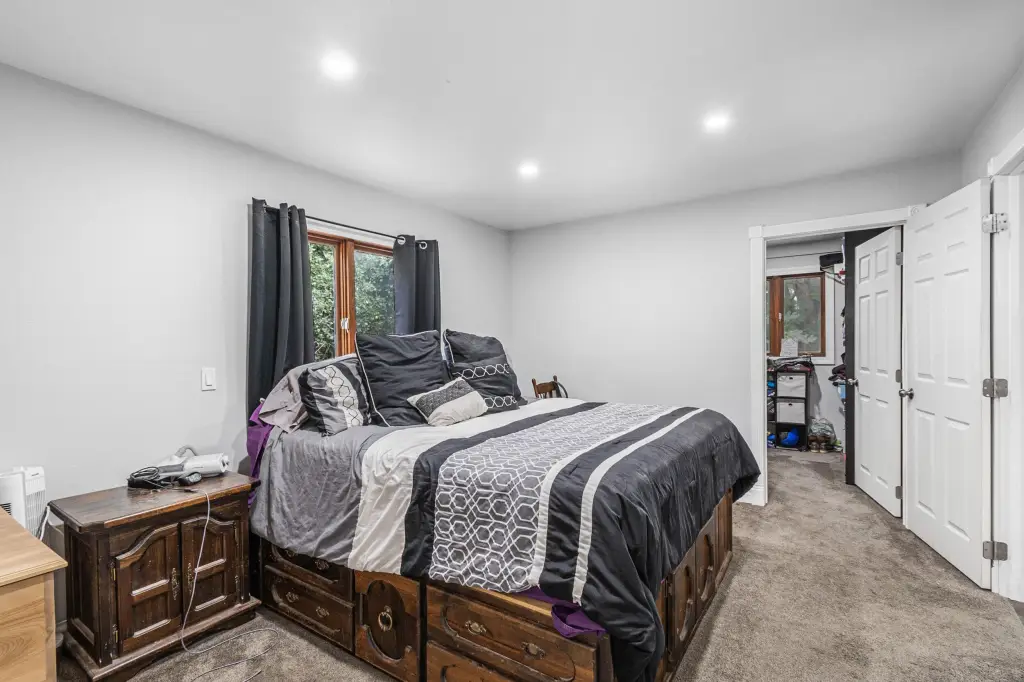
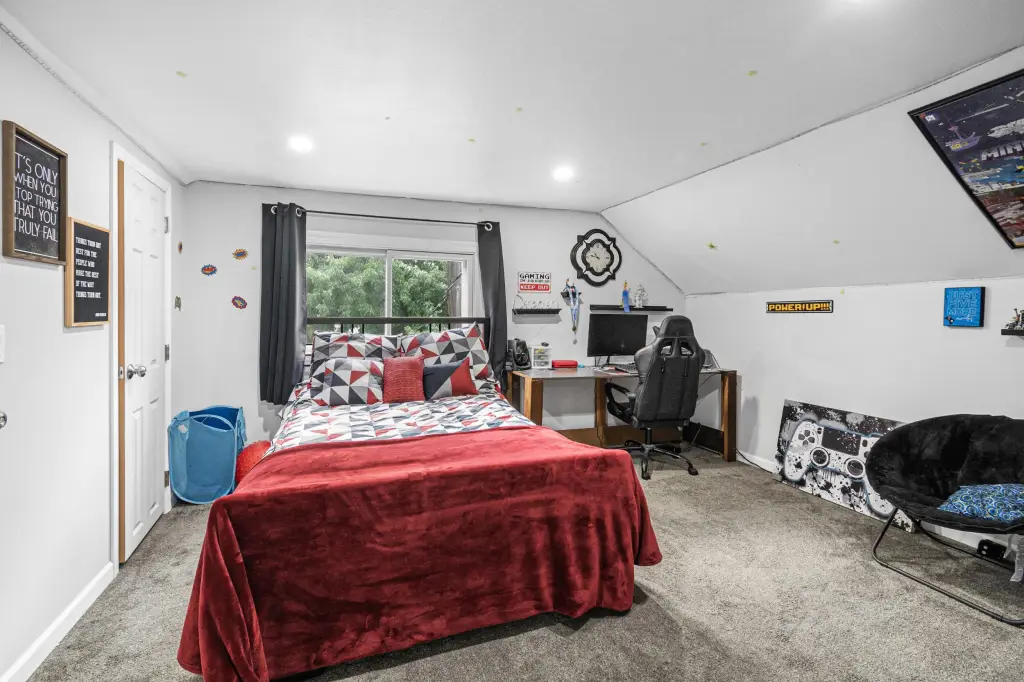
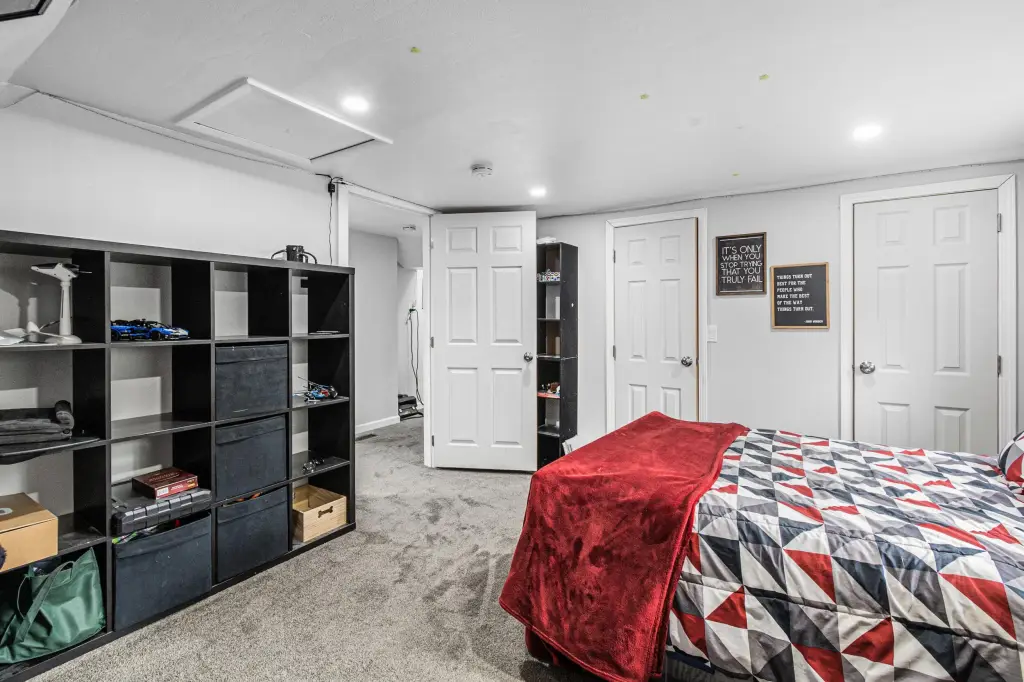
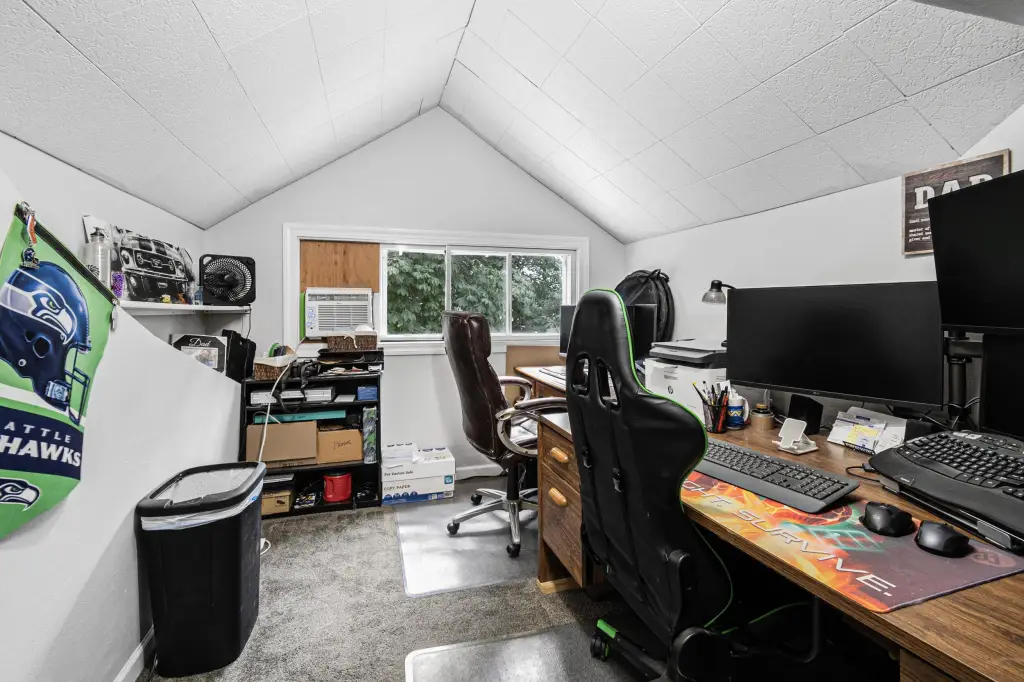
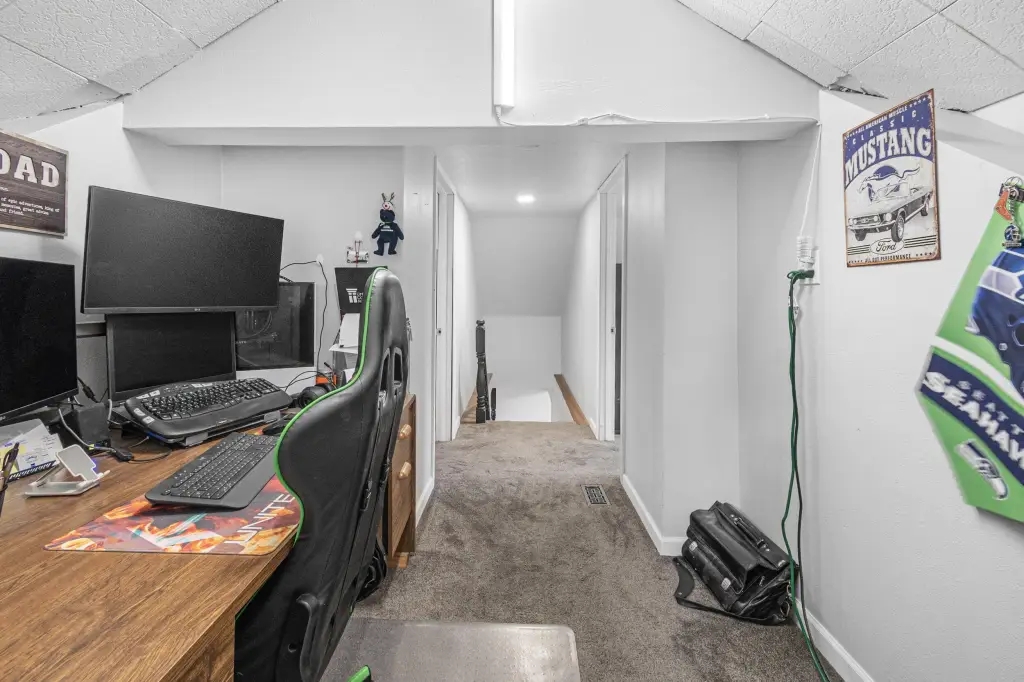
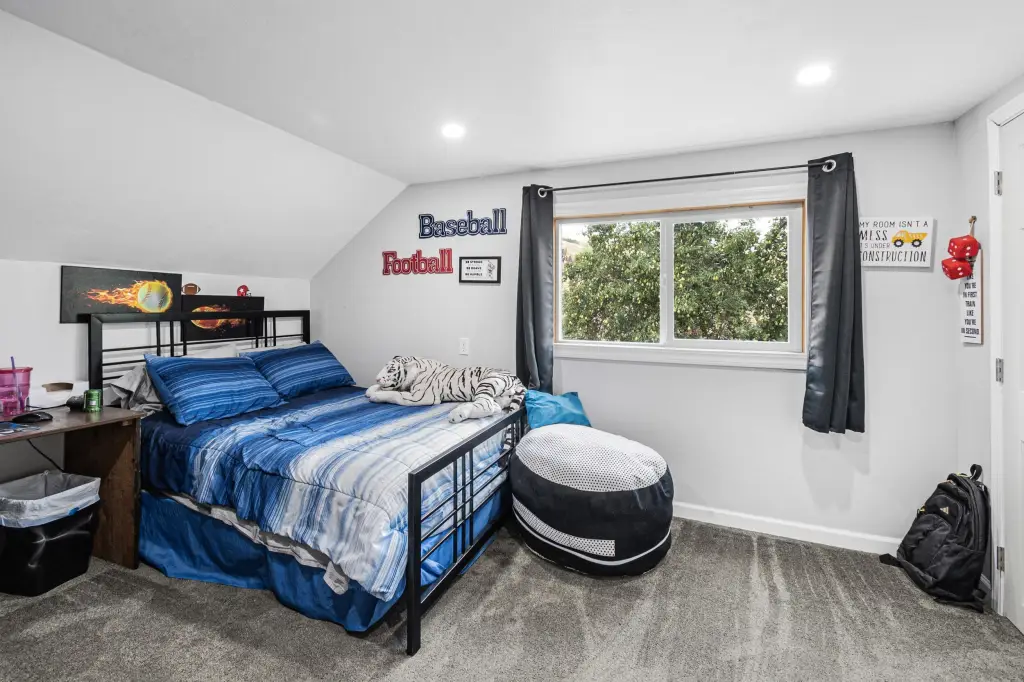
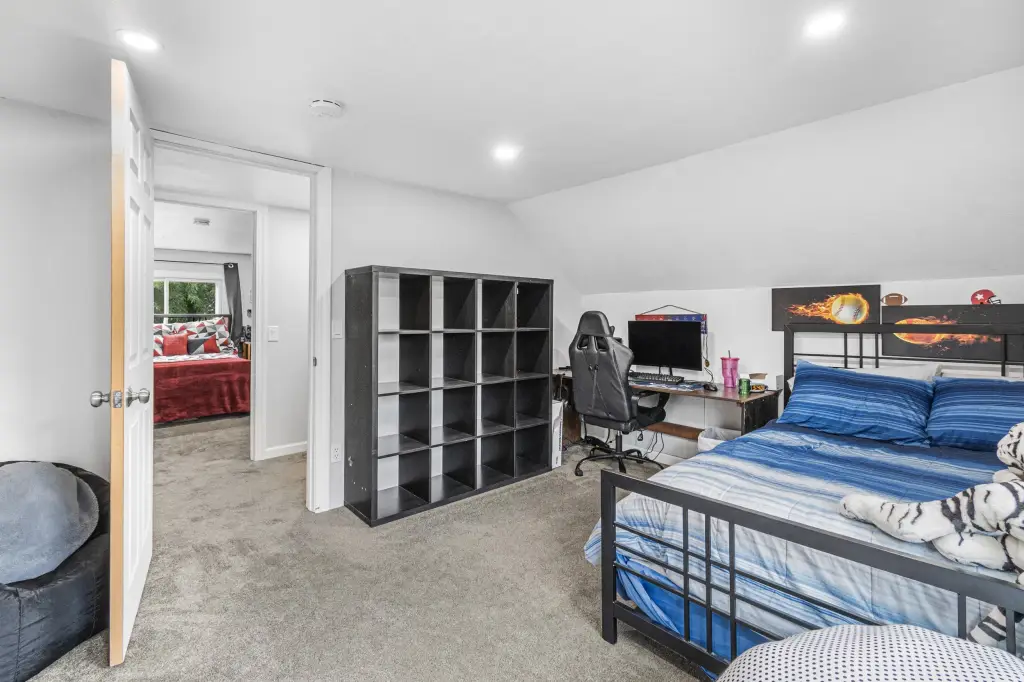
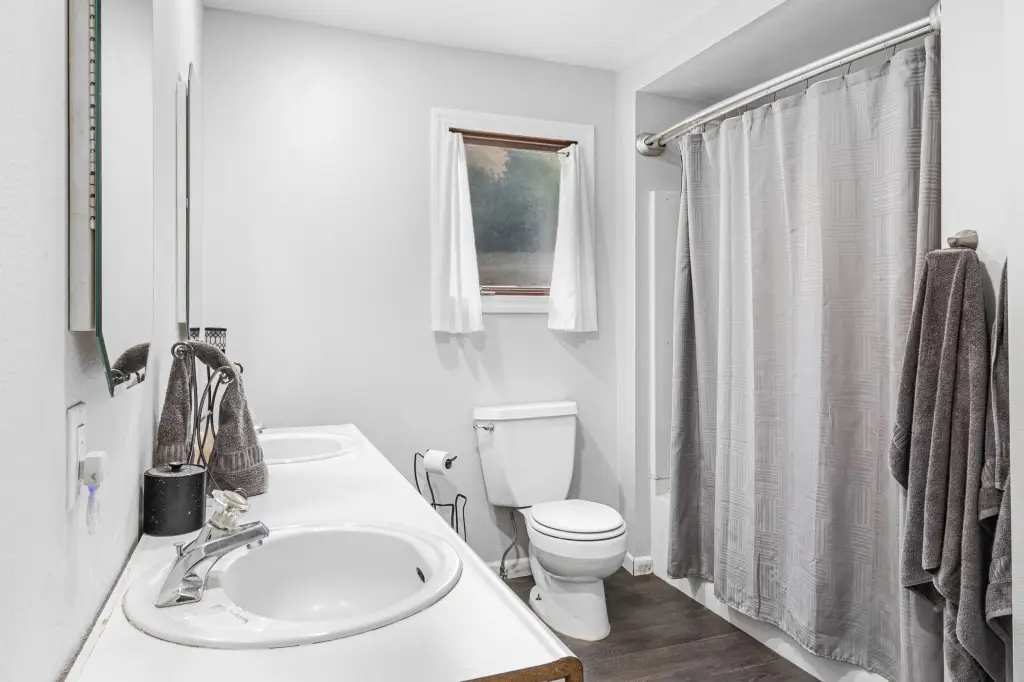
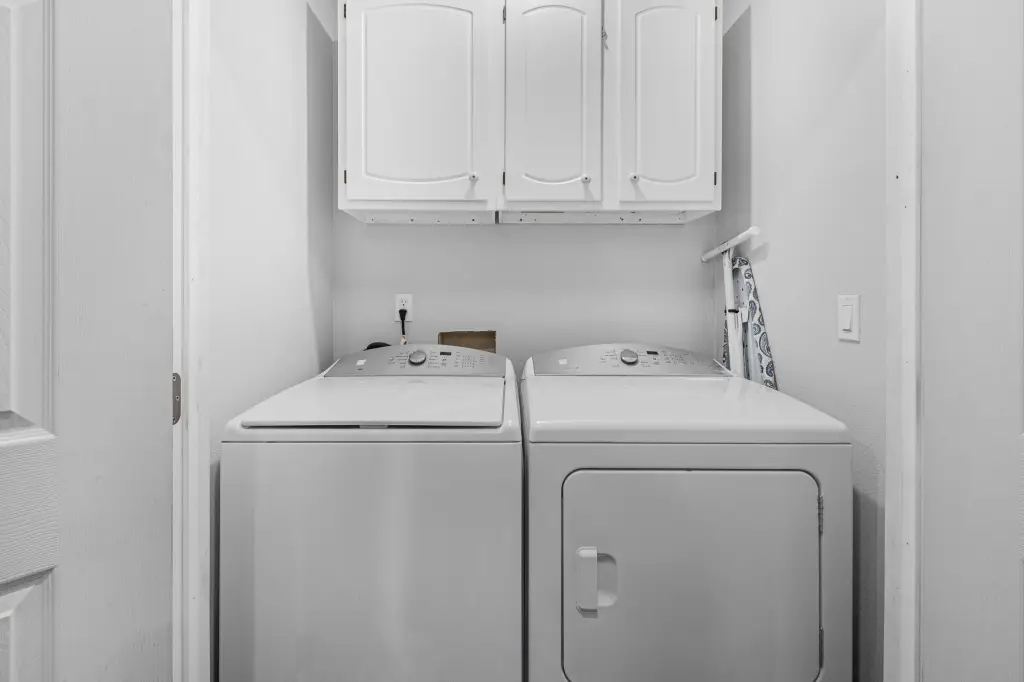
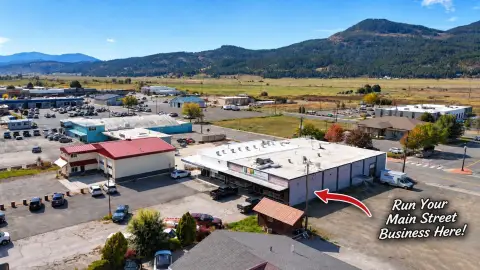
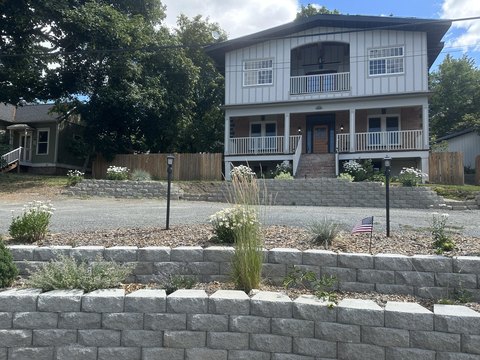
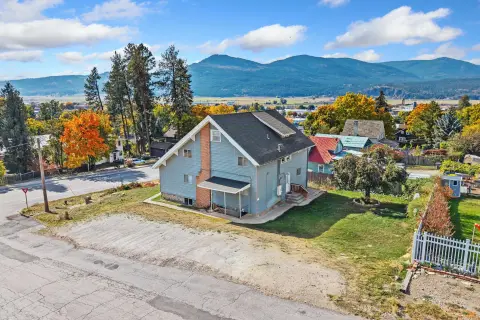
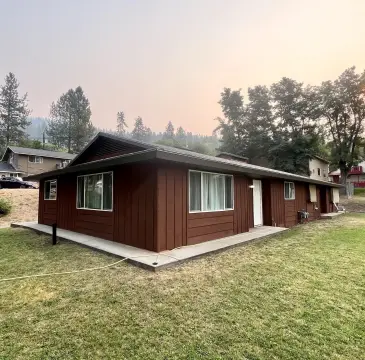
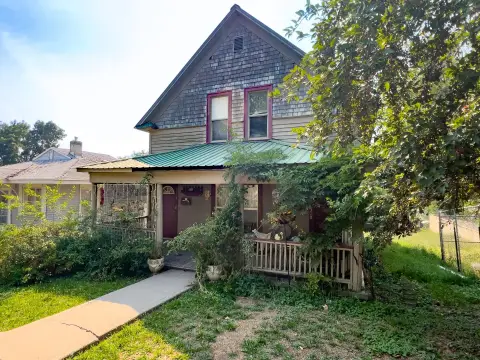
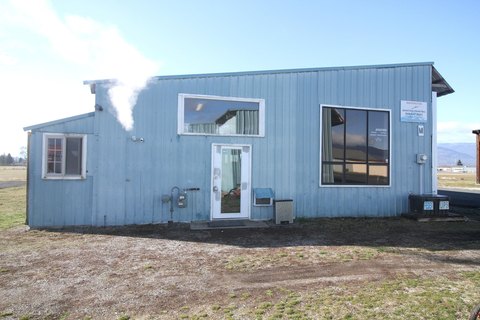
This 6.3-acre mixed-use property brings together an updated farmhouse, a shop with high ceilings, a barn accessible on both levels, and additional buildings for storage. The farmhouse may serve as an office or support a home-and-work arrangement. Total property size is 4,290 square feet.
The property fronts Highway 395 between Colville and Kettle Falls, with access to both communities. Highway frontage provides exposure to passing retail traffic.
The property fronts Highway 395 between Colville and Kettle Falls, with access to both communities. Highway frontage provides exposure to passing retail traffic.
Key Highlights
- 6.3‑acre mixed‑use property with road frontage on Highway 395
- 4,290 square feet of property size
- Updated farmhouse, shop, barn, and separate storage buildings
Financial Insights
Estimated NOI and Cap Rate
NOI / Yr
$24,960
Cap Rate
6.24%
Suggested Prices Based on Cap Rates
Cap Rate 5%
$499,200
$499.2K
Cap Rate 7%
$356,571
$356.6K
Cap Rate 9%
$277,333
$277.3K
Market Conditions
NOI Build-Up for 4,290 SF
Gross rent
$38.1K $8.88/SF
− Vacancy
−$2.4K −$0.57/SF
EGI
$35.7K $8.31/SF
− OpEx
−$10.7K −$2.49/SF
NOI
$25.0K $5.82/SF
Area
Stevens County, WA
Vacancy
6.40%
Lease Rate
$8.88 /SF/Yr
Expense Ratio
30.00%
Simulate Cap Rate and NOI
Suggested Prices Based on Cap Rates
Cap Rate 5%
$499,200
Cap Rate 7%
$356,571
Cap Rate 9%
$277,333
Alternative Uses
Best Use
Mixed Use
$732.0K
$640.5K – $854.0K
NOI $51,239 @ 7.0% cap · market cap 12.81%
Second Best
Industrial
$356.6K
$312.0K – $416.0K
NOI $24,960 @ 7.0% cap · market cap 6.24%
Theoretical Best
Office A
$1.11M
$968.5K – $1.29M
NOI $77,477 @ 7.0% cap · market cap 19.37%
Zoning and permitted uses should be independently verified with authorities.
How Realmo checks its estimates
Property Analytics
Unlock full access to Insights
Subscribe to Realmo Intelligence
Open Analytics
Current Use
Lease Details
Yes
Highway access
Yes
Paved road access
Location Intelligence
Trade Area within ½ mile
13
Businesses Nearby
Explore this area
Business Placement
Demographics for 99114, WA
12,649
Population
6,154
Households
2.1
Avg Household Size
49
Median Age
23%
College-Educated
91%
High-School Grad
718.5 sq mi
ZIP Area
18
Density / Sq Mi
$61,891
Median Household Income
$45,164
Median Earnings
$916
Median Rent
$268,300
Median Home Value
Check the figures for this property
Cap Rate, Value Estimation, Potential NOI and more
View Realmo Analytics
Market
Vacancy Rate% for Industrial in West region




Frequently Asked Questions
What type of property is this?
Mixed-use property - An updated farmhouse, high-ceiling shop, barn, and storage buildings support a range of commercial configurations.
Where is this mixed-use property located?
The property is located at 792 HIGHWAY 395 N Colville, WA.
What is the asking price?
The asking price for this property is $399,900.
What are key features of this property?
This property features: 6.3‑acre mixed‑use property with road frontage on Highway 395; 4,290 square feet of property size; Updated farmhouse, shop, barn, and separate storage buildings


