Six-Bay Auto Repair
For Sale
$750,000
7903 Traders Circle, Greenville, TX 75402
CommercialSale, Greenville, TX
Property Size2,925 SF
Lot Size0.78 Acres
Price / SF$256.41
Days on Market137
Property Features for 7903 Traders Circle
General Information
Property type
Commercial Sale
Property subtype
Other
Zoning description
Commercial
Parking features
Parking Lot
Subdivision
Traders Circle Add
Directions
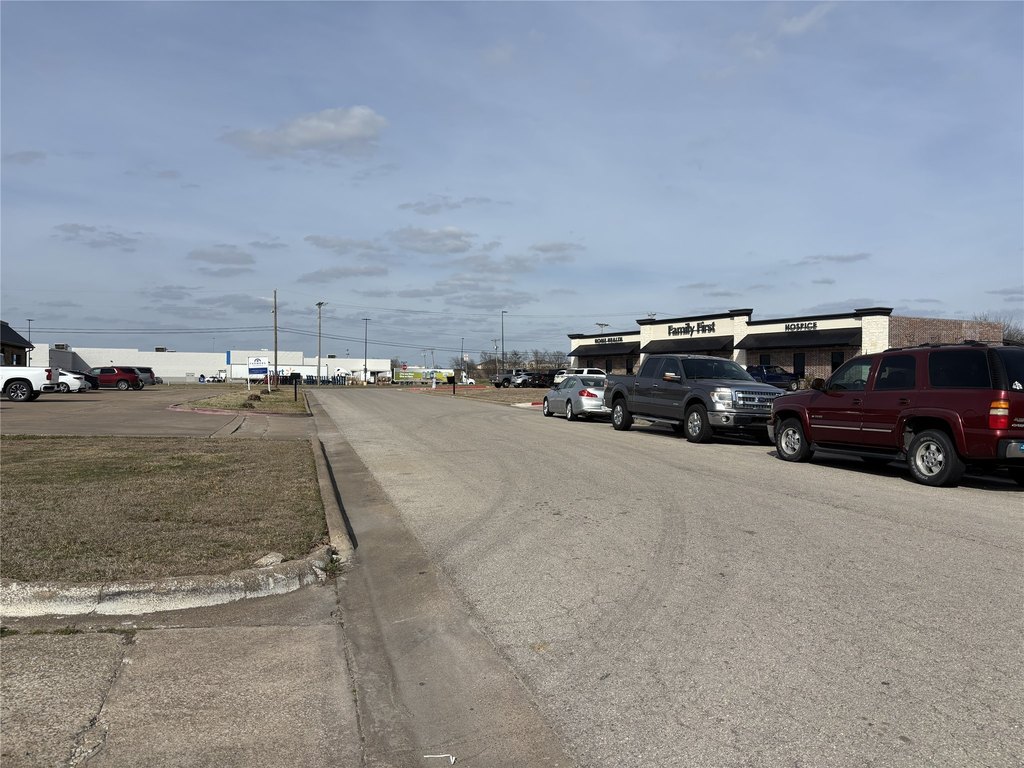
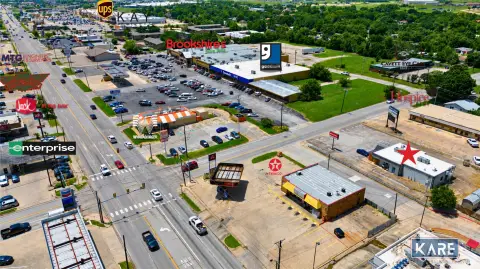
From Hwy 34, just South of I-30, turn to the left on Traders Road, follow to first Right, which is Traders Circle, Property on the Left.
Standard status
Active
APN
82100
Size
2,925 SF
Lot size
0.78 Acres
Taxes and HOA fees
Tax Description
S5216 TRADERS CIRCLE ADDITION SEC 1,2,3 LOT 3
Tax Annual Amount
5492
Legal Description
S5216 TRADERS CIRCLE ADDITION SEC 1,2,3 LOT 3
Utilities
Sewer type
Public Sewer
Heating system
Central, Electric (Heating)
Cooling system
Central Air
Water source
Public
Amenities
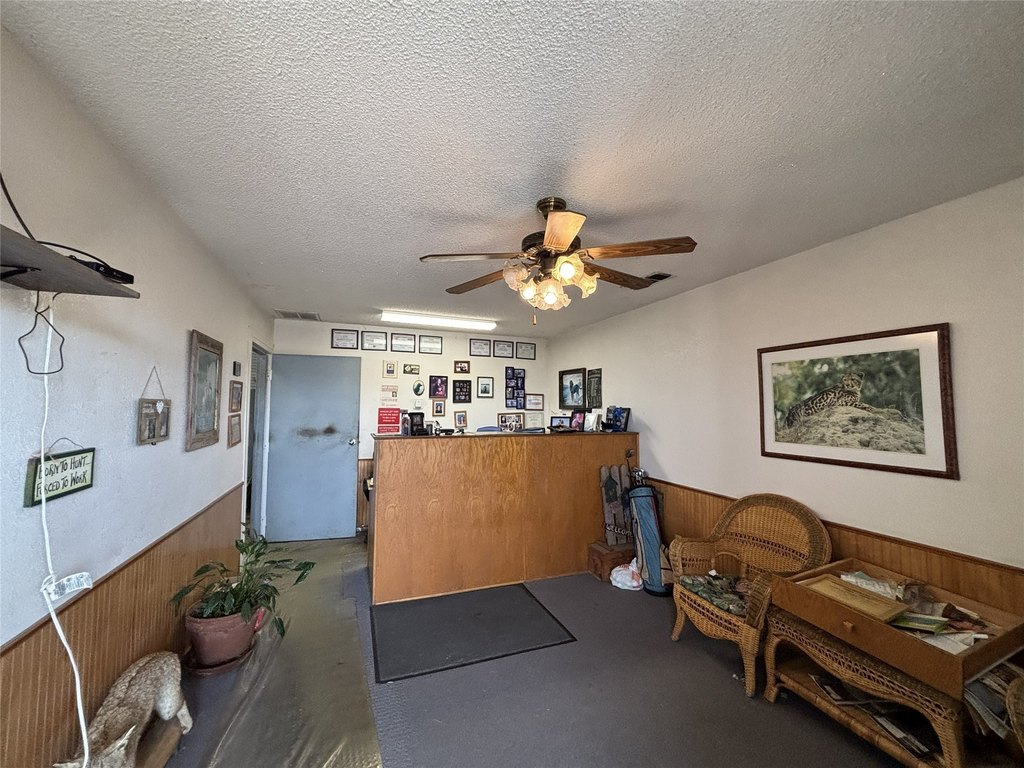
office
break room
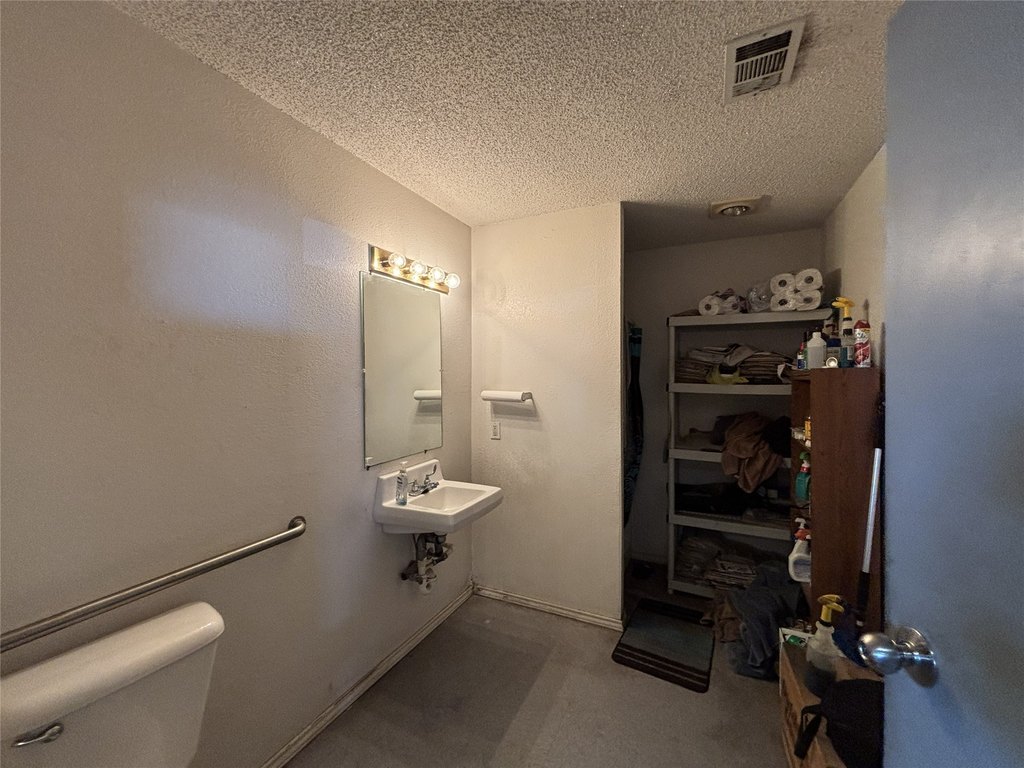
full bath
parts storage area
Building Details
Year built
1998
Floors in Building
1
Number of units
1
Flooring type
Concrete
Building materials
MetalSiding
Roof type
Metal
Listing Agency:
CENTURY 21 Upchurch Real Estate
(903) 356-3116
Listed By:
Tonya Sanders · License #0587303
(972) 977-2501
Added: Jun 2
Changed: Sep 13
Last Checked: Oct 16 at 6:06PM
MLS# 21227223
Copyright © 2026 North Texas Real Estate Information Systems, Inc. All rights reserved. All information provided by the listing agent/broker is deemed reliable but is not guaranteed and should be independently verified.

Ask AI about this property
Review the available facts, identify missing information and prepare questions for the agent.
Investment Insights
Based on property information with market context.
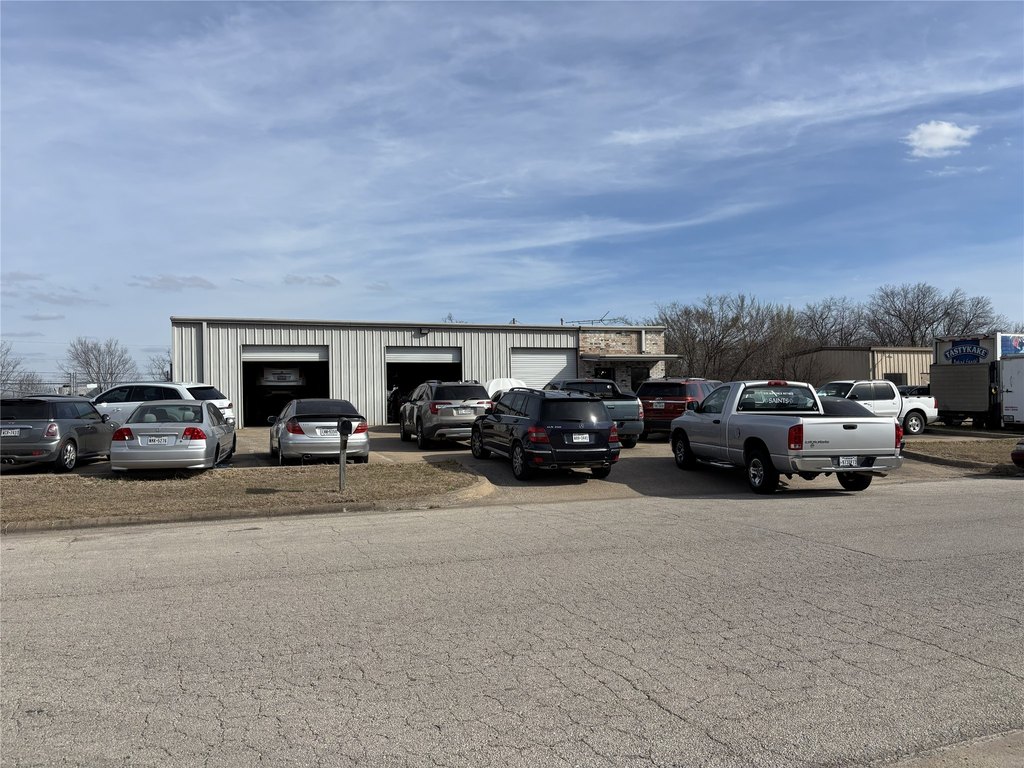
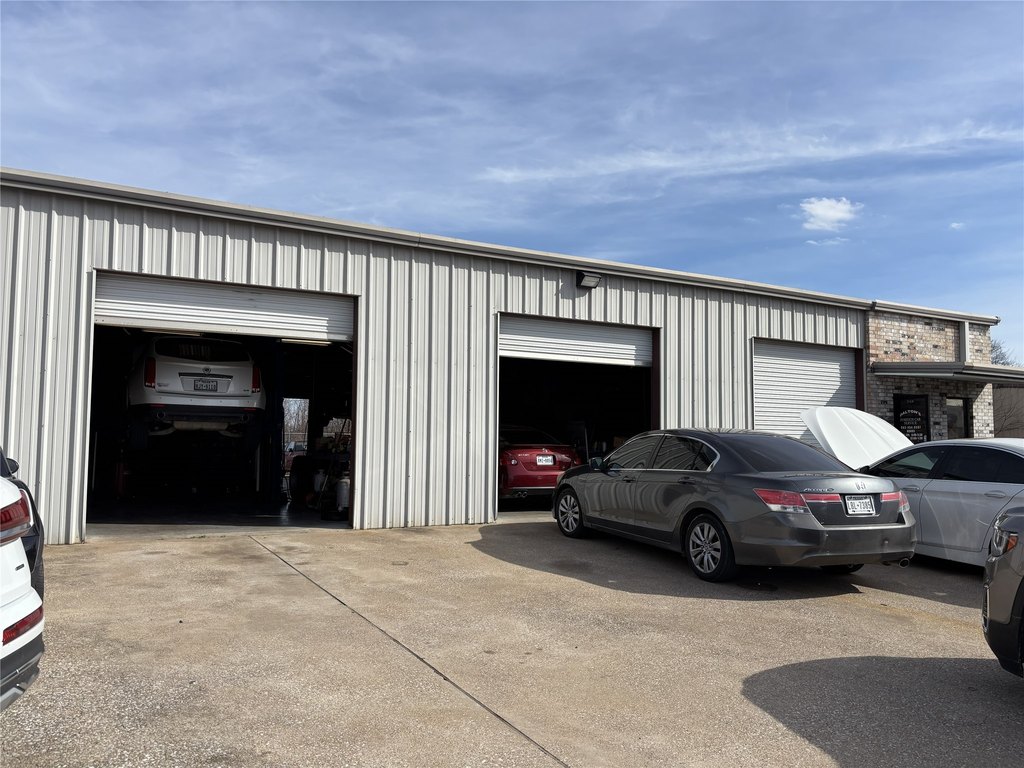
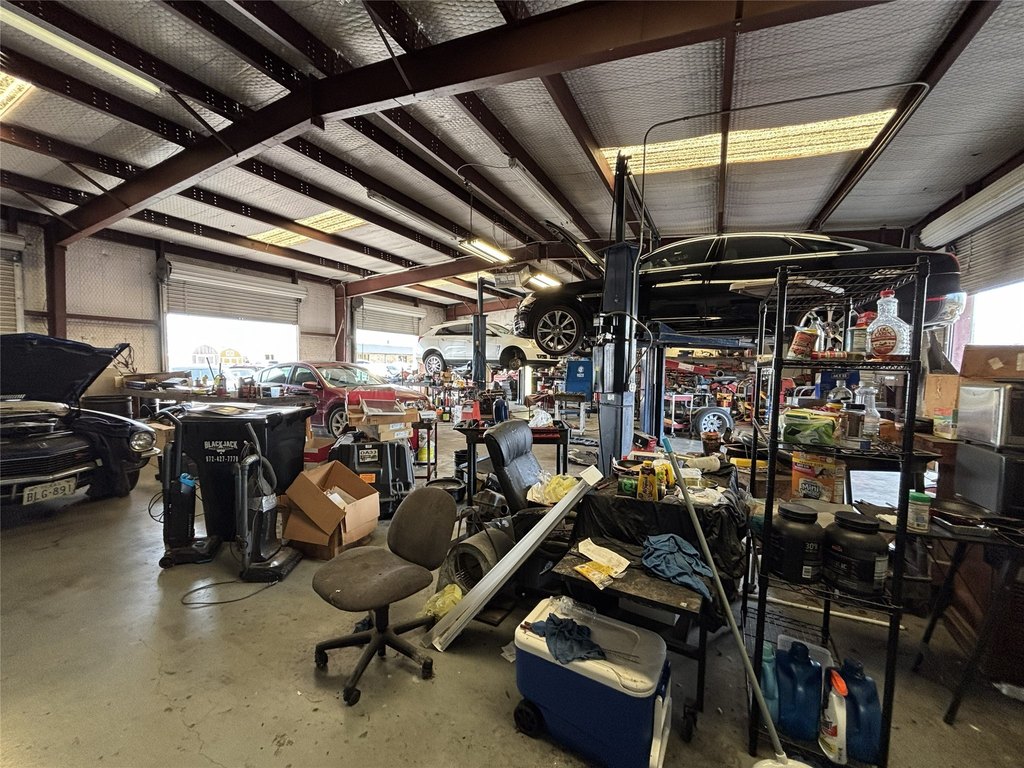
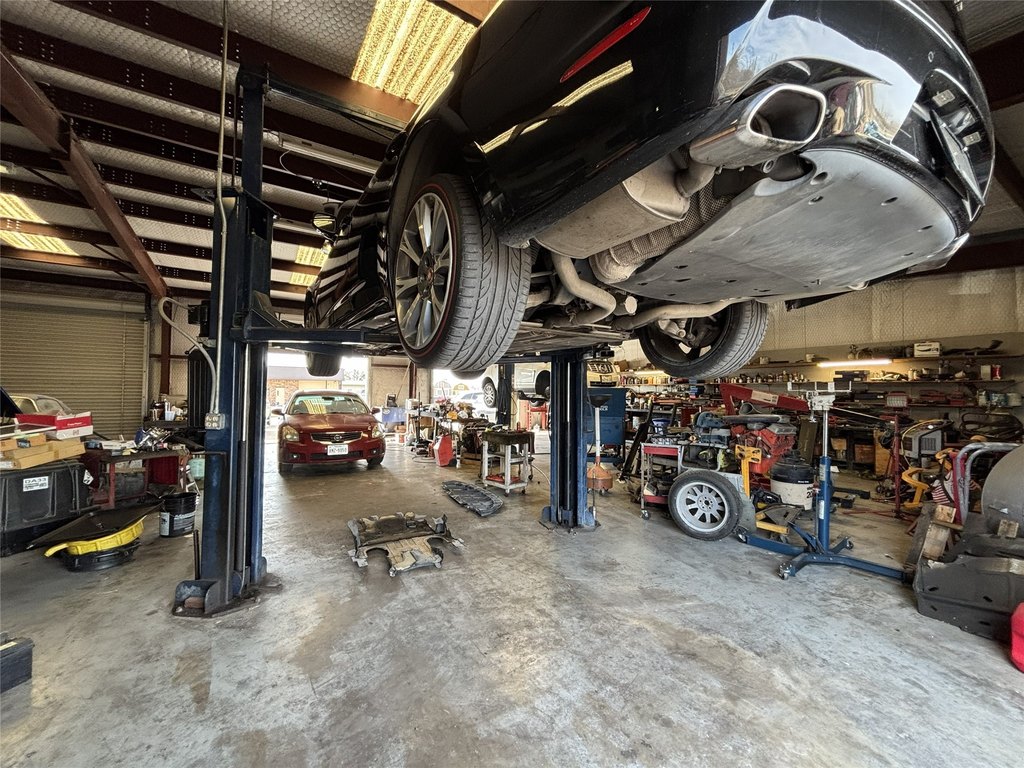
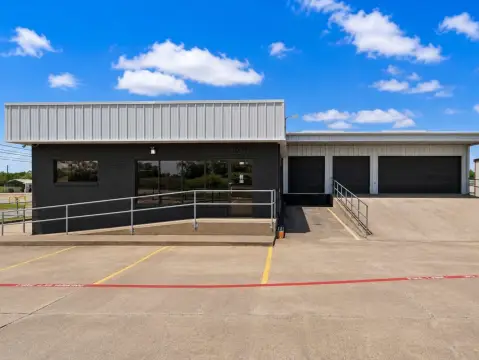
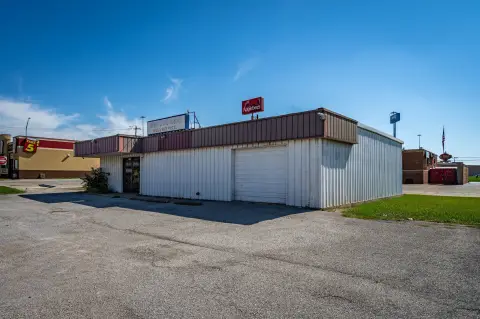
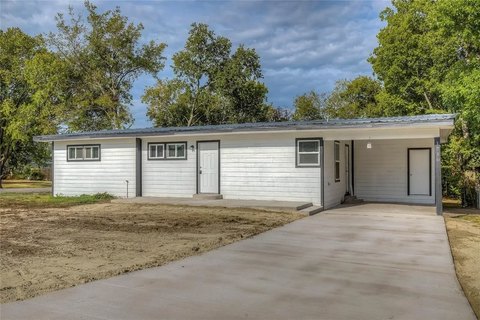
This 2,925-square-foot auto repair facility was built in 1998 and measures 65 x 45. The metal-sided building has six 10 x 10 bay doors, a 7,000 lb lift, a 9,000 lb lift, and a 60-gallon air compressor. Interior support areas include an 11 x 17 office, an 11 x 11 break room, a 6 x 11 full bath, and dedicated parts storage. Most tools are included, with a few exceptions.
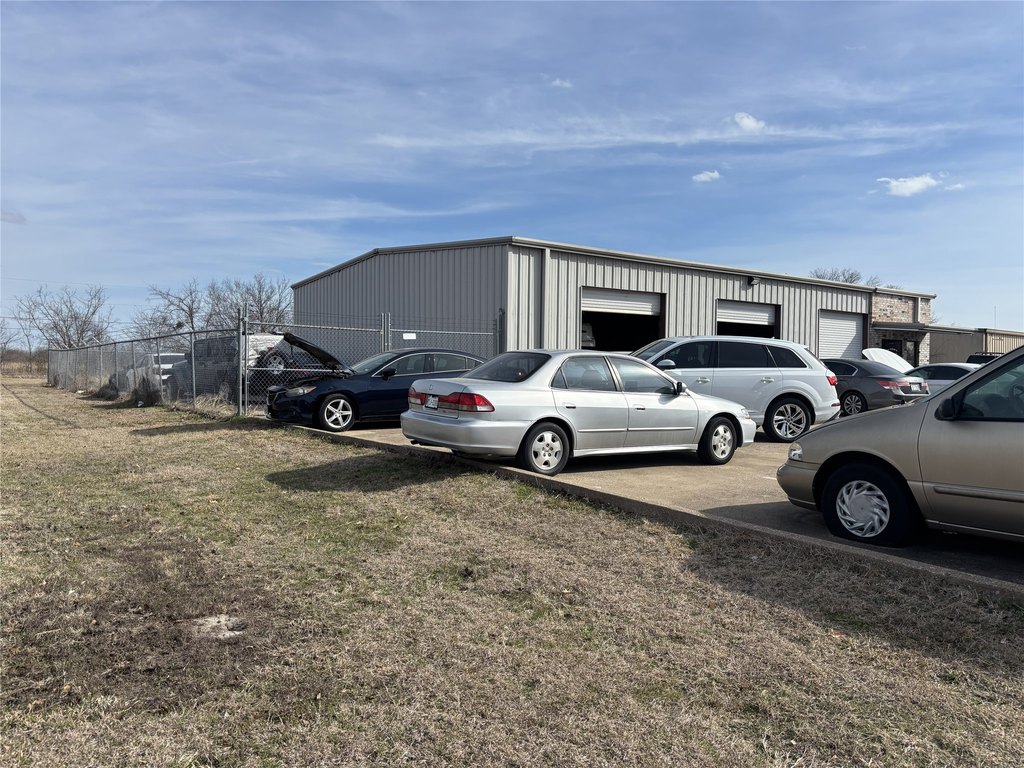
The 0.776-acre property is located at 7903 Traders Circle, just off I-30 and Traders Road in Greenville. A paved front parking lot serves the building, while the rear portion is fenced. The property has public water and public sewer, central electric heating, central air, concrete flooring, and a metal roof.
The 0.776-acre property is located at 7903 Traders Circle, just off I-30 and Traders Road in Greenville. A paved front parking lot serves the building, while the rear portion is fenced. The property has public water and public sewer, central electric heating, central air, concrete flooring, and a metal roof.
Key Highlights
- 2,925‑square‑foot auto repair building on 0.776 acres
- Six 10 x 10 bay doors
- Includes 7,000 lb lift and 9,000 lb lift
Financial Insights
Estimated NOI and Cap Rate
NOI / Yr
$47,065
Cap Rate
6.28%
Suggested Prices Based on Cap Rates
Cap Rate 5%
$941,300
$941.3K
Cap Rate 7%
$672,357
$672.4K
Cap Rate 9%
$522,944
$522.9K
Market Conditions
NOI Build-Up for 2,925 SF
Gross rent
$70.6K $24.12/SF
− Vacancy
−$3.3K −$1.13/SF
EGI
$67.2K $22.99/SF
− OpEx
−$20.2K −$6.90/SF
NOI
$47.1K $16.09/SF
Area
Hunt County, TX
Vacancy
4.70%
Lease Rate
$24.12 /SF/Yr
Expense Ratio
30.00%
Simulate Cap Rate and NOI
Suggested Prices Based on Cap Rates
Cap Rate 5%
$941,300
Cap Rate 7%
$672,357
Cap Rate 9%
$522,944
Alternative Uses
Best Use
Industrial
$2.91M
$2.54M – $3.39M
NOI $203,452 @ 7.0% cap · market cap 27.13%
Second Best
Retail
$672.4K
$588.3K – $784.4K
NOI $47,065 @ 7.0% cap · market cap 6.28%
Theoretical Best
—
—
same as Best Use
Zoning and permitted uses should be independently verified with authorities.
How Realmo checks its estimates
Property Analytics
Unlock full access to Insights
Subscribe to Realmo Intelligence
Open Analytics
Current Use
Lease Details
6
Service bays
Yes
Fenced yard
Yes
Highway access
Yes
Paved road access
Location Intelligence
Trade Area within ½ mile
345
Businesses Nearby
327k
Monthly Visits Nearby
Well-served
Demand for This Use
Explore this area
Business Placement
Foot Traffic Nearby
Dining 35%
Superstores 33%
Shops & Services 20%
Home Improvements & Furnishings 11%
Walmart
Superstores
108,435 visits/mo
0.1 miles
The Home Depot
Home Improvements & Furnishings
35,255 visits/mo
0.4 miles
McDonald's
Dining
28,764 visits/mo
0.3 miles
Murphy USA
Shops & Services
21,430 visits/mo
0.2 miles
Cracker Barrel Old Country Store
Dining
21,405 visits/mo
0.5 miles
Demographics for 75402, TX
18,983
Population
8,024
Households
2.4
Avg Household Size
41
Median Age
32%
College-Educated
93%
High-School Grad
90.8 sq mi
ZIP Area
209
Density / Sq Mi
$77,602
Median Household Income
$46,076
Median Earnings
$1,414
Median Rent
$252,500
Median Home Value
Check the figures for this property
Cap Rate, Value Estimation, Potential NOI and more
View Realmo Analytics
Market
Vacancy Rate% for Retail in South region







Similar Off Market Nearby
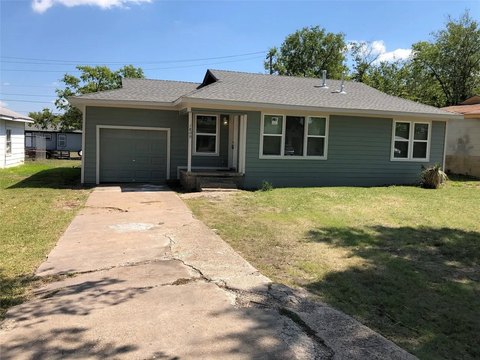
- English Color Paint & Supply — 2702 Rodeo Dr, Greenville, TX 75402
- Clark's Wheeled Sports — 8705 Wesley St, Greenville, TX 75402
- Greenville Muffler & Radiator — 8401 wesley st, greenville, tx 75402
- Greenville Exhaust & Auto Repair Service — 2605 Halifax St, Greenville, TX 75402
- The Tint Shop — 8409 Wesley St, Greenville, TX 75402
Frequently Asked Questions
What type of property is this?
Auto shop - Metal auto service building with fenced rear area, paved parking, and separate office, break room, bath, and parts storage.
Where is this auto shop located?
The property is located at 7903 Traders Circle Greenville, TX.
What is the asking price?
The asking price for this property is $750,000.
What are key features of this property?
This property features: 2,925‑square‑foot auto repair building on 0.776 acres; Six 10 x 10 bay doors; Includes 7,000 lb lift and 9,000 lb lift


