Hunting Land with Metal
For Sale
$725,000
790 NW 42 Terrace, Chiefland, FL 32626
Acres of hunting-recreation land with shooting houses and ponds plus a metal building with roll-up doors and living quarters.
Property Size5,100 SF
Lot Size65.45 Acres
Price / SF$142.16
Days on Market103
Property Features for 790 NW 42 Terrace
General Information
Standard status
Active
Size
5,100 SF
Lot size
65.45 Acres
Property subtype
Vacant Land
Additional Details
Drive-In Doors
3
Listing Agency:
JIM KING REALTY, INC.
Listed By:
Melanie Hutchison · License #3144535
(352) 535-5129
Source:
Flflourish
Added: Jun 17
Changed: Sep 15
Last Checked: Sep 26 at 9:41AM
Displayed information is deemed reliable but is not guaranteed and should be independently verified. All listing content including descriptions, pricing, images are the copyrighted material of JIM KING REALTY, INC.
Investment Insights
Based on property information with market context.
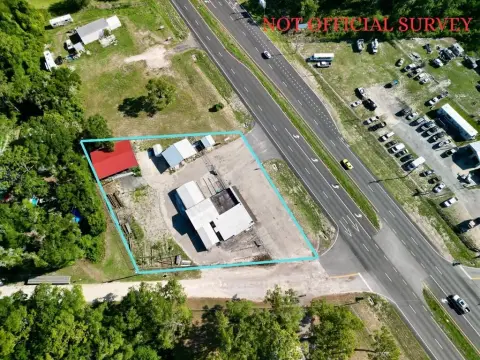
This property offers 65.45 acres of North Florida hunting and recreational land laid out as three separate 20+ acre parcels. Two of the parcels remain buildable for future homesites or family compounds. The grounds include seasonal ponds, established shooting houses, and multiple areas suitable for food plots to support native game. The property also contains mature cypress trees and was formerly operated as a cypress tree farm.
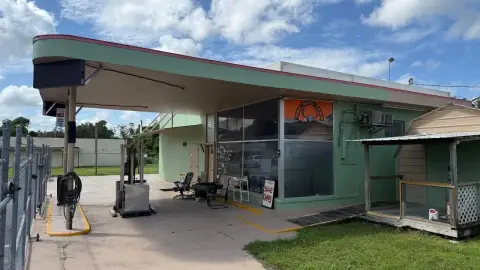
At the center is a 102' x 50' metal building with reinforced floors engineered to support heavy equipment. The building includes three roll-up doors, abundant storage space, and extensive shelving. Living quarters are built into the structure with two bedrooms, two bathrooms, a galley-style kitchen, a family room, and a wood-burning stove. Power is available, and the building is wired for both conventional electric service and solar power.
For tenants, buyers, or owners looking for a rural base for recreation and practical operations, the combination of buildable land, hunting improvements, and an equipment-capable metal structure supports flexible use. It also provides a self-contained on-site setup for weekend stays or off-grid-adjacent activities given the conventional power and solar wiring, while still being within about 15 minutes of schools, shopping, and everyday amenities and roughly 30 minutes from Cedar Key and coastal recreation.
At the center is a 102' x 50' metal building with reinforced floors engineered to support heavy equipment. The building includes three roll-up doors, abundant storage space, and extensive shelving. Living quarters are built into the structure with two bedrooms, two bathrooms, a galley-style kitchen, a family room, and a wood-burning stove. Power is available, and the building is wired for both conventional electric service and solar power.
For tenants, buyers, or owners looking for a rural base for recreation and practical operations, the combination of buildable land, hunting improvements, and an equipment-capable metal structure supports flexible use. It also provides a self-contained on-site setup for weekend stays or off-grid-adjacent activities given the conventional power and solar wiring, while still being within about 15 minutes of schools, shopping, and everyday amenities and roughly 30 minutes from Cedar Key and coastal recreation.
Key Highlights
- 65.45‑acre North Florida hunting and recreational property made up of three separate 20+ acre parcels
- Wildlife features include seasonal ponds, established shooting houses, and multiple areas suited for food plots for deer, turkey, and hogs
- Metal building centerpiece: 102' x 50' with reinforced floors for heavy equipment, three roll‑up doors, extensive storage, and shelving
Property Analytics
Unlock full access to Insights
Subscribe to Realmo Intelligence
Open Analytics
Current Use
Lease Details
3
Drive-in doors
Location Intelligence
Trade Area within ½ mile
9
Businesses Nearby
Explore this area
Business Placement
Demographics for 32626, FL
8,620
Population
4,358
Households
2
Avg Household Size
47
Median Age
13%
College-Educated
89%
High-School Grad
243.6 sq mi
ZIP Area
35
Density / Sq Mi
$49,643
Median Household Income
$34,057
Median Earnings
$844
Median Rent
$160,900
Median Home Value
Check the figures for this property
Cap Rate, Value Estimation, Potential NOI and more
View Realmo Analytics

Questions? Ask Rey
Realmo’s AI knows this listing — price, zoning, demand, history. Ask anything.




Frequently Asked Questions
What type of property is this?
Hunting land - Acres of hunting-recreation land with shooting houses and ponds plus a metal building with roll-up doors and living quarters.
Where is this hunting land located?
The property is located at 790 NW 42 Terrace Chiefland, FL.
What is the asking price?
The asking price for this property is $725,000.
What are key features of this property?
This property features: 65.45‑acre North Florida hunting and recreational property made up of three separate 20+ acre parcels; Wildlife features include seasonal ponds, established shooting houses, and multiple areas suited for food plots for deer, turkey, and hogs; Metal building centerpiece: 102' x 50' with reinforced floors for heavy equipment, three roll‑up doors, extensive storage, and shelving



