All-Brick Fourplex with
For Sale
$469,000
775 - 777 N Smith Rd, Bloomington, IN 47408
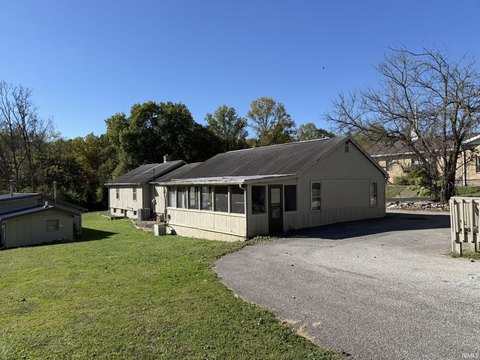
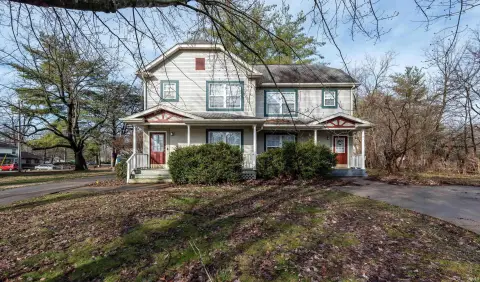
Four-unit rental property with recent building-system improvements, furnished interiors, and leases extending through 2027.
Property Size3,430 SF
Price / SF$136.73
Days on Market83
Property Features for 775 - 777 N Smith Rd
General Information
Standard status
Active
Size
3,430 SF
Property subtype
Multi-Family
Occupancy
100%
Additional Details
Public Transit
Yes
Multifamily Units
4
Building Details
Year Built
1960
Construction
all-brick
Tenancy
Multi
Listing Agency:
RE/MAX Acclaimed Properties
Listed By:
Janet Jin · License #RB17001414
(812) 325-9093
Source:
Kmsrealestategroup
Added: Jul 27
Changed: Oct 10
Last Checked: Oct 16 at 11:56AM
Displayed information is deemed reliable but is not guaranteed and should be independently verified. All listing content including descriptions, pricing, images are the copyrighted material of RE/MAX Acclaimed Properties

Ask AI about this property
Review the available facts, identify missing information and prepare questions for the agent.
Investment Insights
Based on property information with market context.
This 3,430-square-foot all-brick fourplex was built in 1960 and has received several recent improvements. The HVAC system was replaced in 2020, stone landscaping was added in 2023, and Unit 2 was fully remodeled and furnished that year. Units 2, 3, and 4 also have new sliding doors. Interior and exterior sewer systems were completely updated in 2025, with a 5-year Nuflow Plumbing Company warranty extending through 2030.
The property is located at 775 - 777 N Smith Rd in Bloomington, near East 10th Street. A campus bus stop is across the street, and an elementary school is located east of the Smith and 10th Street corner. The rental permit is secured through 9/19/2028. Units 1 and 2 are leased through 7/31/2027, while Units 3 and 4 are leased through 7/31/2026. The landlord currently covers water, sewer, trash, electricity, and gas.
The property is located at 775 - 777 N Smith Rd in Bloomington, near East 10th Street. A campus bus stop is across the street, and an elementary school is located east of the Smith and 10th Street corner. The rental permit is secured through 9/19/2028. Units 1 and 2 are leased through 7/31/2027, while Units 3 and 4 are leased through 7/31/2026. The landlord currently covers water, sewer, trash, electricity, and gas.
Key Highlights
- 3,430‑square‑foot all‑brick fourplex built in 1960
- HVAC replaced in 2020; stone landscaping and fully remodeled, furnished Unit 2 completed in 2023
- Interior and exterior sewer systems updated in 2025
Financial Insights
Estimated NOI and Cap Rate
NOI / Yr
$30,825
Cap Rate
6.57%
Suggested Prices Based on Cap Rates
Cap Rate 5%
$616,500
$616.5K
Cap Rate 7%
$440,357
$440.4K
Cap Rate 9%
$342,500
$342.5K
Market Conditions
NOI Build-Up for 3,430 SF
Gross rent
$46.5K $13.56/SF
− Vacancy
−$2.5K −$0.72/SF
EGI
$44.0K $12.84/SF
− OpEx
−$13.2K −$3.85/SF
NOI
$30.8K $8.99/SF
Area
Monroe County, IN
Vacancy
5.32%
Lease Rate
$13.56 /SF/Yr
Expense Ratio
30.00%
Simulate Cap Rate and NOI
Suggested Prices Based on Cap Rates
Cap Rate 5%
$616,500
Cap Rate 7%
$440,357
Cap Rate 9%
$342,500
Alternative Uses
Best Use
Multifamily LT 5
$440.4K
$385.3K – $513.8K
NOI $30,825 @ 7.0% cap · market cap 6.57%
Second Best
Apartment 5plus
$399.9K
$349.9K – $466.6K
NOI $27,995 @ 7.0% cap · market cap 5.97%
Theoretical Best
Office A
$670.3K
$586.6K – $782.1K
NOI $46,924 @ 7.0% cap · market cap 10.01%
Zoning and permitted uses should be independently verified with authorities.
How Realmo checks its estimates
Property Analytics
Unlock full access to Insights
Subscribe to Realmo Intelligence
Open Analytics
Current Use
Lease Details
4
Residential units
100%
Occupancy
Multi-tenant
Tenancy
Location Intelligence
Trade Area within ½ mile
416
Businesses Nearby
Explore this area
Business Placement
Demographics for 47408, IN
22,917
Population
10,456
Households
2.2
Avg Household Size
28
Median Age
59%
College-Educated
98%
High-School Grad
64.4 sq mi
ZIP Area
356
Density / Sq Mi
$45,584
Median Household Income
$15,819
Median Earnings
$1,177
Median Rent
$304,600
Median Home Value
Check the figures for this property
Cap Rate, Value Estimation, Potential NOI and more
View Realmo Analytics
Market
Vacancy Rate% for Multifamily in Midwest region





Frequently Asked Questions
What type of property is this?
Quadplex - Four-unit rental property with recent building-system improvements, furnished interiors, and leases extending through 2027.
Where is this quadplex located?
The property is located at 775 - 777 N Smith Rd Bloomington, IN.
What is the asking price?
The asking price for this property is $469,000.
What are key features of this property?
This property features: 3,430‑square‑foot all‑brick fourplex built in 1960; HVAC replaced in 2020; stone landscaping and fully remodeled, furnished Unit 2 completed in 2023; Interior and exterior sewer systems updated in 2025