Arts & Crafts
For Sale
$399,900
1231-1233 E Tylers Turn, Bloomington, IN 47401
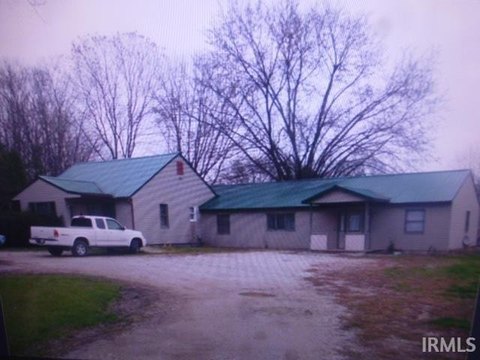
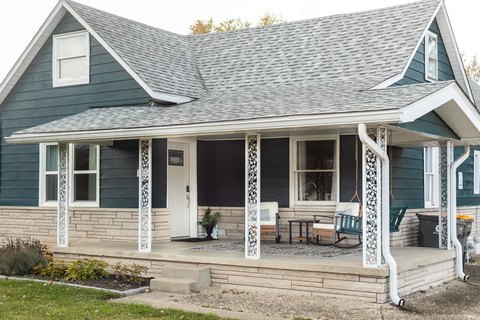
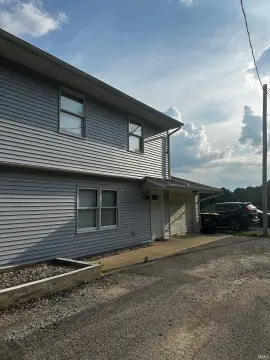
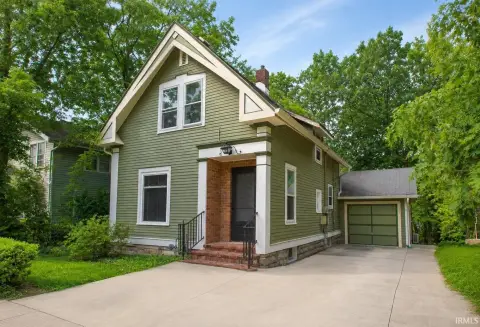
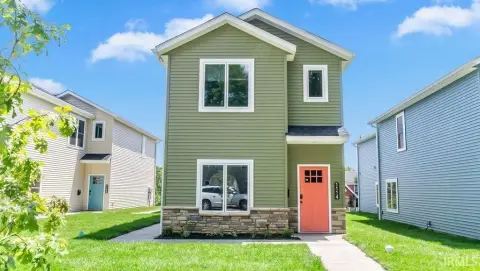
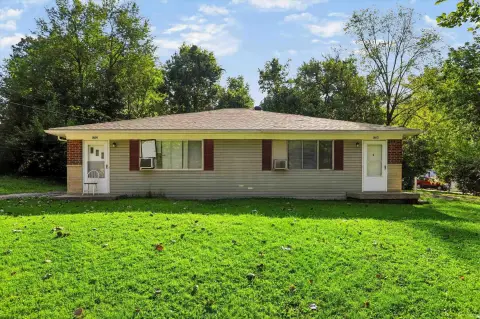
Townhome-style units offer three bedrooms and two baths per side in a quiet cul-de-sac setting.
Property Size2,440 SF
Price / SF$163.89
Days on Market90
Property Features for 1231-1233 E Tylers Turn
General Information
Standard status
Active
Size
2,440 SF
Property subtype
Multi-Family
Building Details
Year Built
1992
Listing Agency:
RE/MAX Acclaimed Properties
Listed By:
Gigi Larmour-Goldin · License #RB14005167
(812) 327-5608
Source:
Spencerchildersgroup
Added: Jul 19
Changed: Oct 9
Last Checked: Oct 16 at 10:30AM
Displayed information is deemed reliable but is not guaranteed and should be independently verified. All listing content including descriptions, pricing, images are the copyrighted material of RE/MAX Acclaimed Properties

Ask AI about this property
Review the available facts, identify missing information and prepare questions for the agent.
Investment Insights
Based on property information with market context.
Built in 1992, this 2,440-square-foot duplex pairs two townhome-style residences under one property. Each side includes three bedrooms and two baths, creating a consistent six-bedroom, four-bathroom configuration across the building. The Arts & Crafts design and quiet cul-de-sac setting add character and separation from through traffic.
The property is near Indiana University, Bloomington Parks & Trails, Winslow Sports Complex, the YMCA, downtown Bloomington, eastside shopping, and I-69. One of two adjacent duplexes available, it may be acquired alongside the neighboring property identified as MLS 202607561. The layout supports either continued rental use or an owner-occupant arrangement with one residence available for rental income.
The property is near Indiana University, Bloomington Parks & Trails, Winslow Sports Complex, the YMCA, downtown Bloomington, eastside shopping, and I-69. One of two adjacent duplexes available, it may be acquired alongside the neighboring property identified as MLS 202607561. The layout supports either continued rental use or an owner-occupant arrangement with one residence available for rental income.
Key Highlights
- 2,440‑square‑foot duplex built in 1992
- Two townhome‑style units, each with 3 bedrooms and 2 baths
- Arts & Crafts design on a quiet cul‑de‑sac
Financial Insights
Estimated NOI and Cap Rate
NOI / Yr
$21,928
Cap Rate
5.48%
Suggested Prices Based on Cap Rates
Cap Rate 5%
$438,560
$438.6K
Cap Rate 7%
$313,257
$313.3K
Cap Rate 9%
$243,644
$243.6K
Market Conditions
NOI Build-Up for 2,440 SF
Gross rent
$33.1K $13.56/SF
− Vacancy
−$1.8K −$0.72/SF
EGI
$31.3K $12.84/SF
− OpEx
−$9.4K −$3.85/SF
NOI
$21.9K $8.99/SF
Area
Monroe County, IN
Vacancy
5.32%
Lease Rate
$13.56 /SF/Yr
Expense Ratio
30.00%
Simulate Cap Rate and NOI
Suggested Prices Based on Cap Rates
Cap Rate 5%
$438,560
Cap Rate 7%
$313,257
Cap Rate 9%
$243,644
Alternative Uses
Best Use
Multifamily LT 5
$313.3K
$274.1K – $365.5K
NOI $21,928 @ 7.0% cap · market cap 5.48%
Second Best
Apartment 5plus
$284.5K
$248.9K – $331.9K
NOI $19,915 @ 7.0% cap · market cap 4.98%
Theoretical Best
Office A
$476.9K
$417.3K – $556.4K
NOI $33,381 @ 7.0% cap · market cap 8.35%
Zoning and permitted uses should be independently verified with authorities.
How Realmo checks its estimates
Property Analytics
Current Use
Location Intelligence
Trade Area within ½ mile
193
Businesses Nearby
Explore this area
Business Placement
Demographics for 47401, IN
41,225
Population
21,162
Households
1.9
Avg Household Size
35
Median Age
62%
College-Educated
95%
High-School Grad
82.6 sq mi
ZIP Area
499
Density / Sq Mi
$65,643
Median Household Income
$34,279
Median Earnings
$1,181
Median Rent
$333,100
Median Home Value
Market
Vacancy Rate% for Multifamily in Midwest region




Frequently Asked Questions
What type of property is this?
Duplex - Townhome-style units offer three bedrooms and two baths per side in a quiet cul-de-sac setting.
Where is this duplex located?
The property is located at 1231-1233 E Tylers Turn Bloomington, IN.
What is the asking price?
The asking price for this property is $399,900.
What are key features of this property?
This property features: 2,440‑square‑foot duplex built in 1992; Two townhome‑style units, each with 3 bedrooms and 2 baths; Arts & Crafts design on a quiet cul‑de‑sac


