Orlando Retail Center For
For Sale
Contact for pricing
7720 Turkey Lake Rd, Orlando, FL
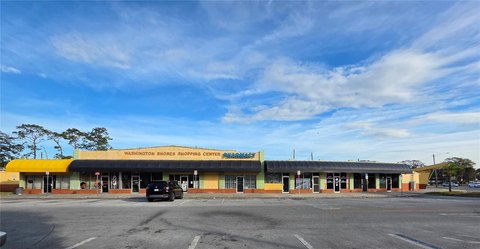
Fully leased retail center in Orlando's Dr. Phillips trade area.
Property Size19,213 SF
Lot Size1.82 Acres
Price / SF$580.86
Days on Market377
Property Features for 7720 Turkey Lake Rd
General Information
Standard status
Active
Size
19,213 SF
Lot size
1.82 Acres
Property subtype
RETAIL
Listing Agency:
Marcus & Millichap | Fort Lauderdale
(954) 245-3495
Listed By:
Douglas K. Mandel · License #SL3090637
(954) 245-3465
Source:
Moodyscre
Added: Oct 3, 2025
Changed: Aug 8
Last Checked: Apr 12 at 6:49PM
Displayed information is deemed reliable but is not guaranteed and should be independently verified. All listing content including descriptions, pricing, images are the copyrighted material of Marcus & Millichap | Fort Lauderdale
Investment Insights
Based on property information with market context.
The Shoppes at Turkey Lake is a fully leased, three-tenant retail center located in Orlando’s Dr. Phillips trade area. Constructed in 2014, the property has 19,213 square feet of space and is situated at 7720 Turkey Lake Road. The location provides visibility and direct access to traffic of 25,000 vehicles per day, and it is near Sand Lake Road (56,000 vehicles per day) and Interstate 4. The property is leased to Rokka’s Market, AYR Cannabis Dispensary, and Club Champion under NNN structures. The weighted average lease term is nearly seven years, providing stable occupancy and income. The property is surrounded by residential neighborhoods, large-scale development, and Orlando’s attractions, including Universal Orlando, SeaWorld, Epic Universe, Icon Park, and International Drive. The location benefits from permanent, daytime, and tourist traffic. Within a five-mile radius, there are 188,000 residents, and the one-mile average household income exceeds $113,000, with an annual growth rate of 8% over the past four years.
Key Highlights
- Fully leased three‑tenant NNN retail center, providing stable occupancy and predictable income.
- Located in the heart of Orlando’s Dr. Phillips trade area with excellent visibility and direct access to 25,000 VPD.
- Nearly seven‑year Weighted Average Lease Term (WALT) under NNN structures.
Financial Insights
Estimated NOI and Cap Rate
NOI / Yr
$377,283
Cap Rate
3.38%
Suggested Prices Based on Cap Rates
Cap Rate 5%
$7,545,660
$7.5M
Cap Rate 7%
$5,389,757
$5.4M
Cap Rate 9%
$4,192,033
$4.2M
Market Conditions
NOI Build-Up for 19,213 SF
Gross rent
$557.9K $29.04/SF
− Vacancy
−$19.0K −$0.99/SF
EGI
$539.0K $28.05/SF
− OpEx
−$161.7K −$8.42/SF
NOI
$377.3K $19.64/SF
Area
Orlando, FL
Vacancy
3.40%
Lease Rate
$29.04 /SF/Yr
Expense Ratio
30.00%
Simulate Cap Rate and NOI
Suggested Prices Based on Cap Rates
Cap Rate 5%
$7,545,660
Cap Rate 7%
$5,389,757
Cap Rate 9%
$4,192,033
Alternative Uses
Best Use
Retail
$5.39M
$4.72M – $6.29M
NOI $377,283 @ 7.0% cap · market cap 3.38%
Second Best
—
—
no second resolved use
Theoretical Best
Office A
$6.19M
$5.42M – $7.22M
NOI $433,242 @ 7.0% cap · market cap 3.88%
Zoning and permitted uses should be independently verified with authorities.
How Realmo checks its estimates
Property Analytics
Unlock full access to Insights
Subscribe to Realmo Intelligence
Open Analytics
Current Use
Location Intelligence
Trade Area within ½ mile
2,518
Businesses Nearby
301k
Monthly Visits Nearby
Well-served
Demand for This Use
Explore this area
Business Placement
Foot Traffic Nearby
Dining 55%
Shops & Services 14%
Apparel 13%
Hotels & Casinos 12%
Chick-fil-A
Dining
44,745 visits/mo
0.2 miles
7-Eleven
Shops & Services
26,073 visits/mo
0.1 miles
Ross Dress for Less
Apparel
24,112 visits/mo
0.2 miles
Sprouts Farmers Market
Groceries
18,492 visits/mo
0.1 miles
Cicis
Dining
18,250 visits/mo
0.5 miles
Check the figures for this property
Cap Rate, Value Estimation, Potential NOI and more
View Realmo Analytics
Market
Vacancy Rate% for Retail in Orlando, FL

Questions? Ask Rey
Realmo’s AI knows this listing — price, zoning, demand, history. Ask anything.




Similar Off Market Nearby
- TUTTI FRUITS — 8375 International Dr, Orlando, FL 32819
- Phillips Village — Orlando, FL 32819
- Plaza Venezia — 7488-7830 W Sand Lake Rd, Orlando, FL 32819
- IDRIVE ORLANDO (International Drive Orlando) — 8015 International Dr #8214, Orlando, FL 32819
- Clocktower of Marketplace at Dr. Phillips — Orlando, FL 32819
Frequently Asked Questions
What type of property is this?
Shopping center - Fully leased retail center in Orlando's Dr. Phillips trade area.
Where is this shopping center located?
The property is located at 7720 Turkey Lake Rd Orlando, FL.
What is the asking price?
The asking price for this property is $11,160,000.
What are key features of this property?
This property features: Fully leased three‑tenant NNN retail center, providing stable occupancy and predictable income.; Located in the heart of Orlando’s Dr. Phillips trade area with excellent visibility and direct access to 25,000 VPD.; Nearly seven‑year Weighted Average Lease Term (WALT) under NNN structures.


