Clear-Span Industrial Flex
For Sale
Contact for pricing
749 North Plano Street, Porterville, CA 93257
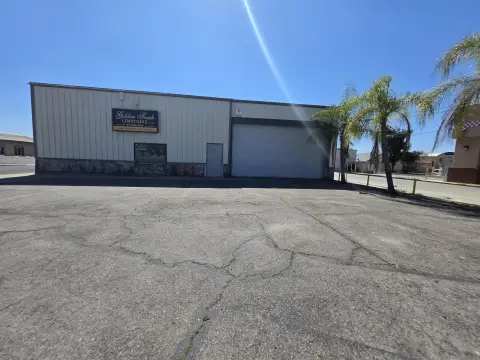
Freestanding industrial complex with clear-span shop space, roll-up doors, fenced paved yard, and an attached air-conditioned office.
Property Size14,160 SF
Price / SF$75.92
Days on Market172
Property Features for 749 North Plano Street
General Information
Standard status
Active
Size
14,160 SF
Property subtype
Retail, Mixed Use
Zoning
CG (General and Service Commercial)
Lease Type
Modified Gross
Building Details
Buildings
2
Units
2
Listing Agency:
C21 Commercial
Listed By:
Jared Ennis · License #CA
(559) 302-8698
Source:
Crexi
Added: May 7
Changed: Oct 1
Last Checked: Oct 24 at 3:26PM
Displayed information is deemed reliable but is not guaranteed and should be independently verified. All listing content including descriptions, pricing, images are the copyrighted material of C21 Commercial

Ask AI about this property
Review the available facts, identify missing information and prepare questions for the agent.
Investment Insights
Based on property information with market context.
This for-sale freestanding industrial flex complex offers available space between two clear-span buildings, ranging from approximately 4,160 SF to 14,160 SF. The configuration includes a built-in, about 1,000 SF air-conditioned/heated office, an open shop area, and fenced paved yard space suitable for storage or light operations.
The front building (A) totals approximately 10,000 SF and includes separate northeast and southeast portions with ceiling heights of about 17’ and 12’, respectively. Building A is equipped with heavy electrical capacity (600 Amps, 3-phase), oversized ground level roll-up doors, skylights, insulated ceiling, air vents, and restrooms. The detached rear building (B) is approximately 4,160 SF with ceiling heights ranging from about 12.5’ to 20’.
The site also includes approximately 1.49 additional acres of land available for $500/month, providing further opportunity for outdoor use alongside the existing fenced yard.
The front building (A) totals approximately 10,000 SF and includes separate northeast and southeast portions with ceiling heights of about 17’ and 12’, respectively. Building A is equipped with heavy electrical capacity (600 Amps, 3-phase), oversized ground level roll-up doors, skylights, insulated ceiling, air vents, and restrooms. The detached rear building (B) is approximately 4,160 SF with ceiling heights ranging from about 12.5’ to 20’.
The site also includes approximately 1.49 additional acres of land available for $500/month, providing further opportunity for outdoor use alongside the existing fenced yard.
Key Highlights
- Between 4,160 SF and 14,160 SF available in a freestanding clear‑span industrial complex near a high‑traffic area
- Front building (A) totals 10,000 SF: includes 7,250 SF with 17' ceiling height and 2,750 SF with 12' ceiling height
- Building A includes heavy power (600 Amps 3‑phase), oversized ground‑level roll‑up doors, skylights, insulated ceiling, air vents, and restrooms
Financial Insights
Estimated NOI and Cap Rate
NOI / Yr
$82,437
Cap Rate
7.67%
Suggested Prices Based on Cap Rates
Cap Rate 5%
$1,648,740
$1.6M
Cap Rate 7%
$1,177,671
$1.2M
Cap Rate 9%
$915,967
$916.0K
Market Conditions
NOI Build-Up for 14,160 SF
Gross rent
$127.4K $9.00/SF
− Vacancy
−$9.7K −$0.68/SF
EGI
$117.8K $8.32/SF
− OpEx
−$35.3K −$2.50/SF
NOI
$82.4K $5.82/SF
Area
Tulare County, CA
Vacancy
7.59%
Lease Rate
$9.00 /SF/Yr
Expense Ratio
30.00%
Simulate Cap Rate and NOI
Suggested Prices Based on Cap Rates
Cap Rate 5%
$1,648,740
Cap Rate 7%
$1,177,671
Cap Rate 9%
$915,967
Alternative Uses
Best Use
Flex RnD
$1.78M
$1.56M – $2.07M
NOI $124,453 @ 7.0% cap · market cap 11.58%
Second Best
Industrial
$1.18M
$1.03M – $1.37M
NOI $82,437 @ 7.0% cap · market cap 7.67%
Theoretical Best
Specialty Retail
$4.30M
$3.76M – $5.02M
NOI $301,077 @ 7.0% cap · market cap 28.01%
Zoning and permitted uses should be independently verified with authorities.
How Realmo checks its estimates
Property Analytics
Who owns this building?
See the owner, sales and loan history
Open Analytics
Current Use
Location Intelligence
Trade Area within ½ mile
277
Businesses Nearby
Under-served
Demand for This Use
Explore this area
Business Placement
Demographics for 93257, CA
79,569
Population
25,020
Households
3.2
Avg Household Size
31
Median Age
15%
College-Educated
69%
High-School Grad
378.9 sq mi
ZIP Area
210
Density / Sq Mi
$58,261
Median Household Income
$30,344
Median Earnings
$1,086
Median Rent
$276,400
Median Home Value
Check the figures for this property
Cap Rate, Value Estimation, Potential NOI and more
View Realmo Analytics
Market
Vacancy Rate% for Industrial in West region








Similar Off Market Nearby
- Freddie Q Catering — 748 N Main St, Porterville, CA 93257
Frequently Asked Questions
What type of property is this?
Flex space - Freestanding industrial complex with clear-span shop space, roll-up doors, fenced paved yard, and an attached air-conditioned office.
Where is this flex space located?
The property is located at 749 North Plano Street Porterville, CA.
What is the asking price?
The asking price for this property is $1,075,000.
What are key features of this property?
This property features: Between 4,160 SF and 14,160 SF available in a freestanding clear‑span industrial complex near a high‑traffic area; Front building (A) totals 10,000 SF: includes 7,250 SF with 17' ceiling height and 2,750 SF with 12' ceiling height; Building A includes heavy power (600 Amps 3‑phase), oversized ground‑level roll‑up doors, skylights, insulated ceiling, air vents, and restrooms


