Corner Single-Story Retail
For Sale
Contact for pricing
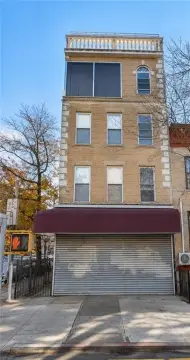
746 UTICA AVE, Brooklyn, NY 11203
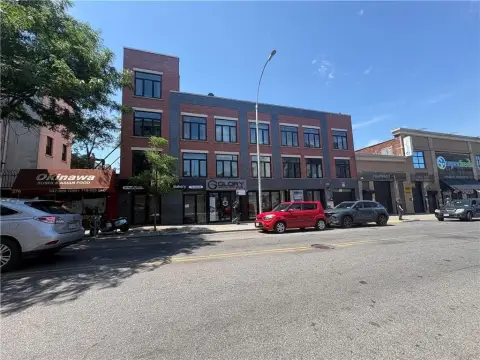
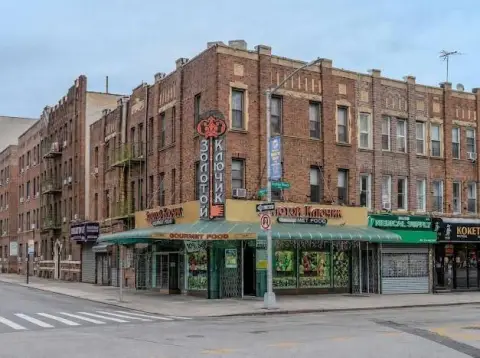
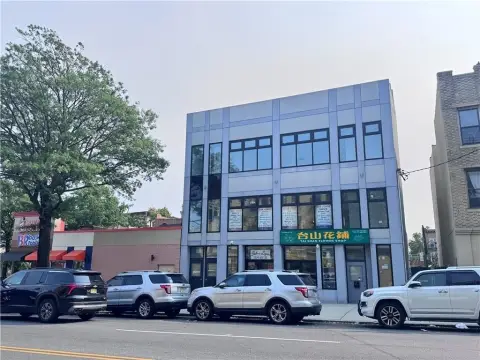
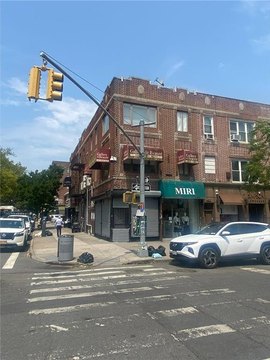
Fully leased corner storefront building with eight tenants and tenant-paid utilities for reduced landlord expenses.
Property Size6,300 SF
Lot Size0.19 Acres
Price / SF$579.37
Days on Market120
Property Features for 746 UTICA AVE
General Information
Standard status
Active
Size
6,300 SF
Lot size
0.19 Acres
Property subtype
Retail, Office
Zoning
C8-1
Occupancy
100%
Net Operating Income
$216,503
Building Details
Year Built
1931
Stories
1
Units
8
Tenancy
Multi
Listing Agency:
Commercial Acquisitions
Listed By:
Vadim Atbashyan · License #NY
(516) 852-1601
Source:
Crexi
Added: Jun 9
Changed: Sep 24
Last Checked: Oct 5 at 6:19PM
Displayed information is deemed reliable but is not guaranteed and should be independently verified. All listing content including descriptions, pricing, images are the copyrighted material of Commercial Acquisitions
Investment Insights
Based on property information with market context.
746 Utica Ave is a corner, single-story retail building designed for storefront occupancy. The property is fully occupied by eight tenants, all paying, providing an in-place revenue stream. The building sits on a full lot of approximately 81 by 100 feet, with a building footprint of approximately 81 by 96 feet, supporting a straightforward retail layout.
The asset is located at 746 Utica Ave in Brooklyn, New York. As a corner property, it benefits from storefront presentation and visibility to the street, which can be helpful for retail businesses seeking direct customer access.
For buyers and tenants evaluating retail space, the current occupancy and tenant-paid utilities are key operational considerations. With utilities handled directly by tenants, the building’s expense structure is streamlined relative to ownership models where the landlord covers utilities. The size and corner configuration also make the property worth reviewing for retail operators that value established, multi-tenant storefront exposure.
The asset is located at 746 Utica Ave in Brooklyn, New York. As a corner property, it benefits from storefront presentation and visibility to the street, which can be helpful for retail businesses seeking direct customer access.
For buyers and tenants evaluating retail space, the current occupancy and tenant-paid utilities are key operational considerations. With utilities handled directly by tenants, the building’s expense structure is streamlined relative to ownership models where the landlord covers utilities. The size and corner configuration also make the property worth reviewing for retail operators that value established, multi-tenant storefront exposure.
Key Highlights
- Corner, single‑story retail building built in 1931
- Fully occupied with 8 tenants all paying
- Full‑lot site of approx. 81x100 ft with building footprint of ~81x96 ft
Financial Insights
Estimated NOI and Cap Rate
NOI / Yr
$302,114
Cap Rate
8.28%
Suggested Prices Based on Cap Rates
Cap Rate 5%
$6,042,280
$6.0M
Cap Rate 7%
$4,315,914
$4.3M
Cap Rate 9%
$3,356,822
$3.4M
Market Conditions
NOI Build-Up for 6,300 SF
Gross rent
$489.9K $77.76/SF
− Vacancy
−$58.3K −$9.25/SF
EGI
$431.6K $68.51/SF
− OpEx
−$129.5K −$20.55/SF
NOI
$302.1K $47.95/SF
Area
Brooklyn, NY
Vacancy
11.90%
Lease Rate
$77.76 /SF/Yr
Expense Ratio
30.00%
Simulate Cap Rate and NOI
Suggested Prices Based on Cap Rates
Cap Rate 5%
$6,042,280
Cap Rate 7%
$4,315,914
Cap Rate 9%
$3,356,822
Alternative Uses
Best Use
Retail
$4.32M
$3.78M – $5.04M
NOI $302,114 @ 7.0% cap · market cap 8.28%
Second Best
—
—
no second resolved use
Theoretical Best
Specialty Retail
$5.22M
$4.56M – $6.09M
NOI $365,148 @ 7.0% cap · market cap 10.00%
Zoning and permitted uses should be independently verified with authorities.
Property Analytics
Unlock full access to Insights
Subscribe to Realmo Intelligence
Open Analytics
Current Use
Location Intelligence
Trade Area within ½ mile
3,393
Businesses Nearby
163k
Monthly Visits Nearby
Explore this area
Business Placement
Foot Traffic Nearby
Dining 48%
Shops & Services 43%
Groceries 4%
Home Improvements & Furnishings 3%
McDonald's
Dining
29,356 visits/mo
0.4 miles
BP
Shops & Services
24,242 visits/mo
0.5 miles
Wendy's
Dining
22,854 visits/mo
0.5 miles
Capital One Bank
Shops & Services
19,243 visits/mo
0.2 miles
Popeyes Louisiana Kitchen
Dining
16,468 visits/mo
0.1 miles
Demographics for 11203, NY
81,824
Population
33,434
Households
2.4
Avg Household Size
41
Median Age
26%
College-Educated
88%
High-School Grad
2.1 sq mi
ZIP Area
38,964
Density / Sq Mi
$68,028
Median Household Income
$47,302
Median Earnings
$1,566
Median Rent
$677,700
Median Home Value
Check the figures for this property
Cap Rate, Value Estimation, Potential NOI and more
View Realmo Analytics
Market
Vacancy Rate% for Retail in Northeast region

Questions? Ask Rey
Realmo’s AI knows this listing — price, zoning, demand, history. Ask anything.



Frequently Asked Questions
What type of property is this?
Retail space - Fully leased corner storefront building with eight tenants and tenant-paid utilities for reduced landlord expenses.
Where is this retail space located?
The property is located at 746 UTICA AVE Brooklyn, NY.
What is the asking price?
The asking price for this property is $3,650,000.
What are key features of this property?
This property features: Corner, single‑story retail building built in 1931; Fully occupied with 8 tenants all paying; Full‑lot site of approx. 81x100 ft with building footprint of ~81x96 ft



