Mixed-Use Building with
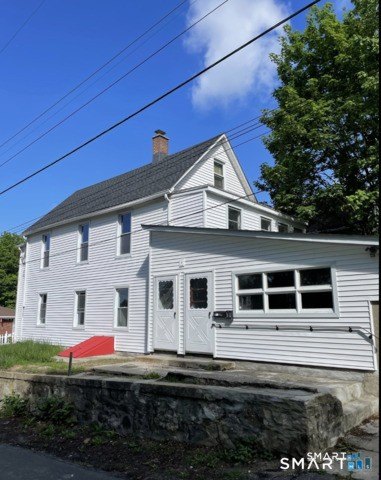
For Sale
$1,449,000
734 E Main Street, Waterbury, CT 06702
Commercial For Sale, Waterbury, CT
Property Size7,284 SF
Lot Size0.08 Acres
Price / SF$198.93
Days on Market47
Property Features for 734 E Main Street
General Information
Property type
Commercial Sale
Property subtype
Other
Zoning
CG
Bathrooms
6
Full bathrooms
4
Half bathrooms
2
Rooms
Bathroom 4, Bathroom 6, Bathroom 3, Bathroom 2, Bathroom 1, Bathroom 5
Directions
From 84 W Exit 22, straight on Brass Mill Dr, right on East Main
Subdivision
East End
Standard status
Active
Size
7,284 SF
Lot size
0.08 Acres
Taxes and HOA fees
Tax Year
2027
Tax Annual Amount
9629
Utilities
Sewer type
Public Sewer
Heating system
Hot Water(Heating)
Water source
Public
Building Details
Year built
1926
Listing Agency:
CENTURY 21 Shutters & Sails · Century 21 Real Estate
(860) 331-1510
Listed By:
Eileen Godburn
(860) 235-6111
Added: Aug 31
Changed: Oct 4
Last Checked: Oct 16 at 2:06AM
MLS# 24202087
Copyright © 2026 SmartMLS, Inc. All rights reserved. All information provided by the listing agent/broker is deemed reliable but is not guaranteed and should be independently verified.

Ask AI about this property
Review the available facts, identify missing information and prepare questions for the agent.
Investment Insights
Based on property information with market context.
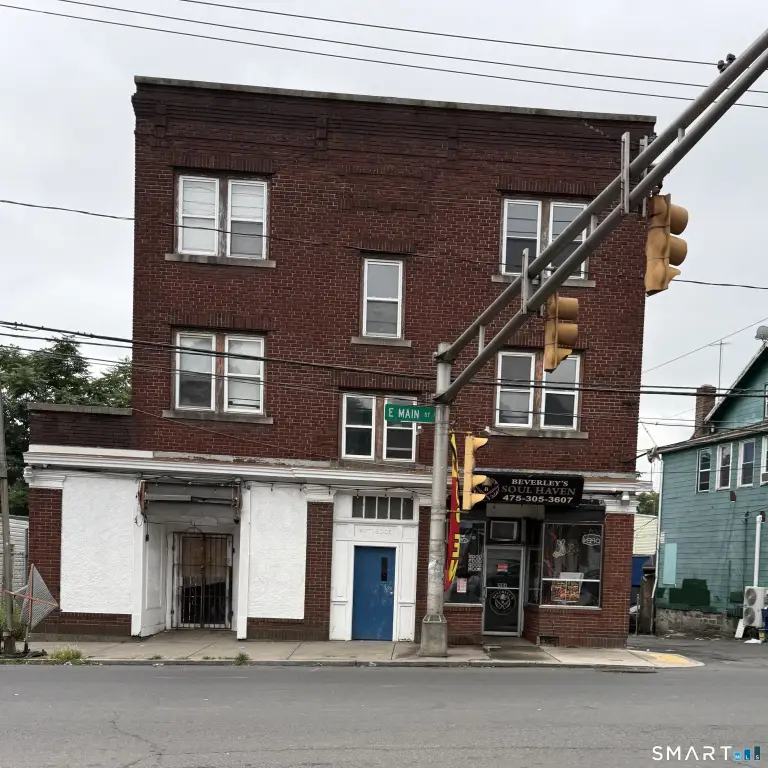
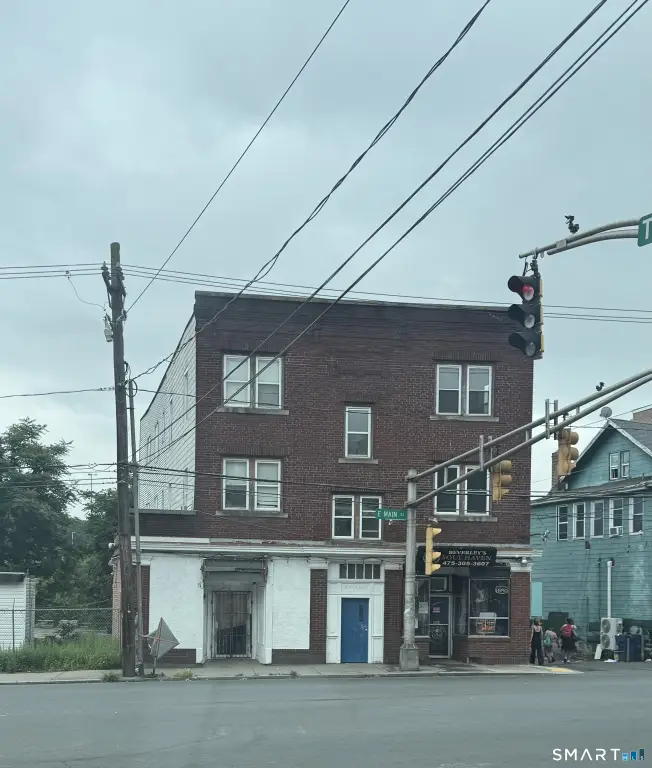
Located at 734 E Main Street in Waterbury, this 7,284-square-foot mixed-use property combines four apartments with two commercial spaces. One commercial unit remains leased following restaurant use, while the second storefront is vacant. Two apartments are leased and two are vacant. Constructed in 1926, the property occupies 0.08 acres and is zoned CG.
The building has public water and public sewer service, with hot-water heating. The property is offered as part of a larger portfolio that also includes assets in Waterbury and Meriden, and all properties are to be sold together. Portfolio terms and property details should be independently reviewed during due diligence.
The building has public water and public sewer service, with hot-water heating. The property is offered as part of a larger portfolio that also includes assets in Waterbury and Meriden, and all properties are to be sold together. Portfolio terms and property details should be independently reviewed during due diligence.
Key Highlights
- 7,284‑square‑foot mixed‑use property on 0.08 acres
- Four apartments positioned above two commercial spaces
- One commercial space is leased following restaurant use
Financial Insights
Estimated NOI and Cap Rate
NOI / Yr
$88,501
Cap Rate
6.11%
Suggested Prices Based on Cap Rates
Cap Rate 5%
$1,770,020
$1.8M
Cap Rate 7%
$1,264,300
$1.3M
Cap Rate 9%
$983,344
$983.3K
Market Conditions
NOI Build-Up for 7,284 SF
Gross rent
$157.3K $21.60/SF
− Vacancy
−$15.7K −$2.16/SF
EGI
$141.6K $19.44/SF
− OpEx
−$53.1K −$7.29/SF
NOI
$88.5K $12.15/SF
Area
Waterbury, CT
Vacancy
10.00%
Lease Rate
$21.60 /SF/Yr
Expense Ratio
37.50%
Simulate Cap Rate and NOI
Suggested Prices Based on Cap Rates
Cap Rate 5%
$1,770,020
Cap Rate 7%
$1,264,300
Cap Rate 9%
$983,344
Alternative Uses
Best Use
Mixed Use
$1.26M
$1.11M – $1.48M
NOI $88,501 @ 7.0% cap · market cap 6.11%
Second Best
Apartment 5plus
$1.06M
$924.1K – $1.23M
NOI $73,929 @ 7.0% cap · market cap 5.10%
Theoretical Best
Office A
$1.93M
$1.69M – $2.26M
NOI $135,308 @ 7.0% cap · market cap 9.34%
Zoning and permitted uses should be independently verified with authorities.
How Realmo checks its estimates
Property Analytics
Unlock full access to Insights
Subscribe to Realmo Intelligence
Open Analytics
Current Use
Lease Details
Multi-tenant
Tenancy
Location Intelligence
Trade Area within ½ mile
1,681
Businesses Nearby
Explore this area
Business Placement
Demographics for 06702, CT
3,882
Population
1,910
Households
2
Avg Household Size
45
Median Age
8%
College-Educated
69%
High-School Grad
0.7 sq mi
ZIP Area
5,546
Density / Sq Mi
$16,198
Median Household Income
$15,833
Median Earnings
$720
Median Rent
Check the figures for this property
Cap Rate, Value Estimation, Potential NOI and more
View Realmo Analytics
Market
Vacancy Rate% for Multifamily in Northeast region


Frequently Asked Questions
What type of property is this?
Mixed-use property - Four apartments sit above two commercial spaces, including one leased restaurant space and one vacant storefront.
Where is this mixed-use property located?
The property is located at 734 E Main Street Waterbury, CT.
What is the asking price?
The asking price for this property is $1,449,000.
What are key features of this property?
This property features: 7,284‑square‑foot mixed‑use property on 0.08 acres; Four apartments positioned above two commercial spaces; One commercial space is leased following restaurant use


