Two-Building Flex
For Sale
Contact for pricing
Pending
7320 E 86th Street, Indianapolis, IN 46256
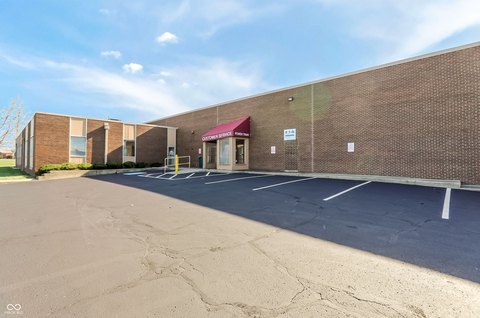
Two-building flex property totaling 51,948 square feet on approximately 4.75 acres, fully occupied with tenant mix.
Property Size51,948 SF
Lot Size4.75 Acres
Days on Market94
Property Features for 7320 E 86th Street
General Information
Standard status
Pending
Size
51,948 SF
Class
B
Total Parking Spaces
164
Lot size
4.75 Acres
Property subtype
Office
Zoning
Special Commercial
Occupancy
100%
Investment Type
Stabilized
Net Operating Income
$568,837
Site & Location
Traffic Count
162,311 vehicles/day
Highway Access
Yes
Building Details
Year Built
2001
Year Renovated
2018
Buildings
2
Units
5
Tenancy
Multi
Listing Agency:
Marcus & Millichap - Indianapolis
Listed By:
Forest Bender · License #IN AB21405968
(317) 218-5346
Source:
Crexi
Added: Jul 13
Changed: Sep 29
Last Checked: Oct 12 at 7:14PM
Displayed information is deemed reliable but is not guaranteed and should be independently verified. All listing content including descriptions, pricing, images are the copyrighted material of Marcus & Millichap - Indianapolis
Investment Insights
Based on property information with market context.
Marcus & Millichap presents the 86th Street Business Park, a two-building flex asset totaling 51,948 square feet situated on approximately 4.75 acres on the northeast side of Indianapolis. The property is 100% occupied by a diverse mix of national, regional, and local tenants and has maintained high historical occupancy.
The business park offers direct access to I-69, the primary corridor connecting northern and southern Indiana to downtown Indianapolis, with over 162,311 vehicles per day. It also benefits from dual interstate connectivity via I-69 and I-465, providing metro-wide accessibility from multiple directions.
The park is adjacent to Fishers, Indiana, a fast-growing community supporting sustained demand for professional flex and office space in this corridor. The development is also about 4.5 miles from The Yard at Fishers District, which is anchored by IKEA, Portillo’s, Shake Shack, and the Fishers Event Center.
The business park offers direct access to I-69, the primary corridor connecting northern and southern Indiana to downtown Indianapolis, with over 162,311 vehicles per day. It also benefits from dual interstate connectivity via I-69 and I-465, providing metro-wide accessibility from multiple directions.
The park is adjacent to Fishers, Indiana, a fast-growing community supporting sustained demand for professional flex and office space in this corridor. The development is also about 4.5 miles from The Yard at Fishers District, which is anchored by IKEA, Portillo’s, Shake Shack, and the Fishers Event Center.
Key Highlights
- Two‑building flex property totaling 51,948 SF on approximately 4.75 acres
- Year built 2001
- 100% occupied by a diverse mix of national, regional, and local tenants
Financial Insights
Estimated NOI and Cap Rate
NOI / Yr
$510,545
Cap Rate
7.43%
Suggested Prices Based on Cap Rates
Cap Rate 5%
$10,210,900
$10.2M
Cap Rate 7%
$7,293,500
$7.3M
Cap Rate 9%
$5,672,722
$5.7M
Market Conditions
NOI Build-Up for 51,948 SF
Gross rent
$872.7K $16.80/SF
− Vacancy
−$87.3K −$1.68/SF
EGI
$785.5K $15.12/SF
− OpEx
−$274.9K −$5.29/SF
NOI
$510.5K $9.83/SF
Area
Indianapolis, IN
Vacancy
10.00%
Lease Rate
$16.80 /SF/Yr
Expense Ratio
35.00%
Simulate Cap Rate and NOI
Suggested Prices Based on Cap Rates
Cap Rate 5%
$10,210,900
Cap Rate 7%
$7,293,500
Cap Rate 9%
$5,672,722
Alternative Uses
Best Use
Office B
$9.80M
$8.57M – $11.43M
NOI $685,869 @ 7.0% cap · market cap 9.97%
Second Best
Flex RnD
$7.29M
$6.38M – $8.51M
NOI $510,545 @ 7.0% cap · market cap 7.43%
Theoretical Best
Office A
$12.93M
$11.31M – $15.09M
NOI $905,142 @ 7.0% cap · market cap 13.16%
Zoning and permitted uses should be independently verified with authorities.
How Realmo checks its estimates
Property Analytics
Unlock full access to Insights
Subscribe to Realmo Intelligence
Open Analytics
Current Use
Lease Details
162,311 VPD
Traffic count
Yes
Highway access
Location Intelligence
Trade Area within ½ mile
717
Businesses Nearby
Balanced
Demand for This Use
Explore this area
Business Placement
Demographics for 46256, IN
22,598
Population
10,118
Households
2.2
Avg Household Size
43
Median Age
57%
College-Educated
96%
High-School Grad
11.1 sq mi
ZIP Area
2,036
Density / Sq Mi
$86,529
Median Household Income
$55,021
Median Earnings
$1,136
Median Rent
$277,800
Median Home Value
Check the figures for this property
Cap Rate, Value Estimation, Potential NOI and more
View Realmo Analytics
Market
Vacancy Rate% for Office in Indianapolis, IN

Questions? Ask Rey
Realmo’s AI knows this listing — price, zoning, demand, history. Ask anything.


Similar Off Market Nearby
- International Food Catering Service — 6816 E 82nd St, Indianapolis, IN 46250
- Paco's Taqueria - Food Truck — 6816 E 82nd St, Indianapolis, IN 46250
Frequently Asked Questions
What type of property is this?
Flex space - Two-building flex property totaling 51,948 square feet on approximately 4.75 acres, fully occupied with tenant mix.
Where is this flex space located?
The property is located at 7320 E 86th Street Indianapolis, IN.
What is the asking price?
The asking price for this property is $6,876,000.
What are key features of this property?
This property features: Two‑building flex property totaling 51,948 SF on approximately 4.75 acres; Year built 2001; 100% occupied by a diverse mix of national, regional, and local tenants


