Indianapolis Industrial Investment
For Sale
$3,900,000
2121 Hillside Ave, Indianapolis, IN 46218
40,000 sq ft building on 5.5 acres with long-term tenant.
Property Size43,000 SF
Lot Size5.50 Acres
Price / SF$90.70
Days on Market263
Property Features for 2121 Hillside Ave
General Information
Standard status
Active
Size
43,000 SF
Lot size
5.50 Acres
Building Details
Year Built
1973
Listing Agency:
United Real Estate Indpls
Listed By:
Randall Reichmann · License #RB17001517
(317) 331-3364
Source:
Mcwatersrealestate
Added: Jan 26
Changed: Oct 15
Last Checked: Oct 7 at 1:56PM
Displayed information is deemed reliable but is not guaranteed and should be independently verified. All listing content including descriptions, pricing, images are the copyrighted material of United Real Estate Indpls

Ask AI about this property
Review the available facts, identify missing information and prepare questions for the agent.
Investment Insights
Based on property information with market context.
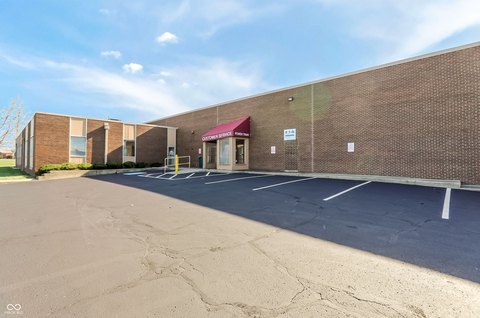
This 40,000 sq ft industrial building is situated on 5.5 acres near downtown Indianapolis. The property is currently leased to a financially strong manufacturing company with a 5-year lease and a 5-year extension option. The base rent is $20,833 per month, with a 3% annual increase. The tenant is responsible for insurance, while the landlord is responsible for the roof and taxes. The property includes over 1200 sq ft of heated and cooled office space with separate bathrooms. The site is completely fenced with chainlink. Previously an industrial dry-cleaning facility from the 1960s until 2003, the property was classified as a "Brownfield Site" and maintains a Sub-Slab Depressurization system. As of July 24, 2020, the IDEM indicated all corrective action was complete. The property has been meticulously maintained.
Key Highlights
- High‑value investment property with a long‑term lease in place.
- Financially strong tenant** with a 5‑year lease and a 5‑year extension option.
- Substantial monthly rental income of $20,833 with a 3% annual increase.
Financial Insights
Estimated NOI and Cap Rate
NOI / Yr
$214,354
Cap Rate
5.50%
Suggested Prices Based on Cap Rates
Cap Rate 5%
$4,287,080
$4.3M
Cap Rate 7%
$3,062,200
$3.1M
Cap Rate 9%
$2,381,711
$2.4M
Market Conditions
NOI Build-Up for 43,000 SF
Gross rent
$335.4K $7.80/SF
− Vacancy
−$29.2K −$0.68/SF
EGI
$306.2K $7.12/SF
− OpEx
−$91.9K −$2.14/SF
NOI
$214.4K $4.98/SF
Area
Indianapolis, IN
Vacancy
8.70%
Lease Rate
$7.80 /SF/Yr
Expense Ratio
30.00%
Simulate Cap Rate and NOI
Suggested Prices Based on Cap Rates
Cap Rate 5%
$4,287,080
Cap Rate 7%
$3,062,200
Cap Rate 9%
$2,381,711
Alternative Uses
Best Use
Office B
$8.11M
$7.10M – $9.46M
NOI $567,729 @ 7.0% cap · market cap 14.56%
Second Best
Industrial
$3.06M
$2.68M – $3.57M
NOI $214,354 @ 7.0% cap · market cap 5.50%
Theoretical Best
Office A
$10.70M
$9.37M – $12.49M
NOI $749,232 @ 7.0% cap · market cap 19.21%
Zoning and permitted uses should be independently verified with authorities.
How Realmo checks its estimates
Property Analytics
Unlock full access to Insights
Subscribe to Realmo Intelligence
Open Analytics
Current Use
Location Intelligence
Trade Area within ½ mile
434
Businesses Nearby
Explore this area
Business Placement
Demographics for 46218, IN
30,400
Population
15,343
Households
2
Avg Household Size
36
Median Age
11%
College-Educated
80%
High-School Grad
9.5 sq mi
ZIP Area
3,200
Density / Sq Mi
$34,635
Median Household Income
$29,745
Median Earnings
$1,056
Median Rent
$90,200
Median Home Value
Check the figures for this property
Cap Rate, Value Estimation, Potential NOI and more
View Realmo Analytics
Market
Vacancy Rate% for Office in Indianapolis, IN


Frequently Asked Questions
What type of property is this?
Industrial property - 40,000 sq ft building on 5.5 acres with long-term tenant.
Where is this industrial property located?
The property is located at 2121 Hillside Ave Indianapolis, IN.
What is the asking price?
The asking price for this property is $3,900,000.
What are key features of this property?
This property features: High‑value investment property with a long‑term lease in place.; Financially strong tenant** with a 5‑year lease and a 5‑year extension option.; Substantial monthly rental income of $20,833 with a 3% annual increase.


