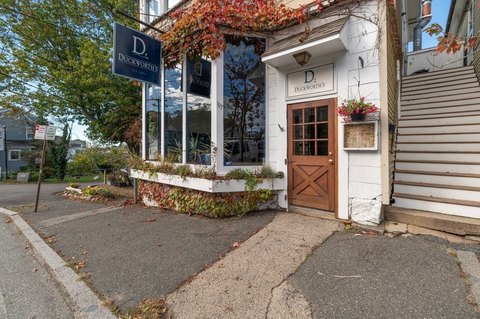
Iconic Waterfront Restaurant
For Sale
$1,500,000
73 Rocky Neck Ave. #1, Gloucester, MA 01930
Established waterfront restaurant in historic Rocky Neck art colony.
Property Size3,085 SF
Price / SF$486.22
Days on Market543
Property Features for 73 Rocky Neck Ave. #1
General Information
Standard status
Active
Size
3,085 SF
Taxes and HOA fees
Annual Taxes
$10,398
Building Details
Year Built
2010
Listing Agency:
Engel & Volkers By the Sea
Listed By:
Barbara Dugan
Source:
Corcoran
Added: Apr 21, 2025
Changed: Mar 16
Last Checked: Mar 16 at 9:09AM
Displayed information is deemed reliable but is not guaranteed and should be independently verified. All listing content including descriptions, pricing, images are the copyrighted material of Engel & Volkers By the Sea
Investment Insights
Based on property information with market context.
This is a rare opportunity to own an established restaurant in the heart of Rocky Neck, one of the oldest working art colonies in America. The restaurant has been serving locals and tourists for over 60 years. Rebuilt in 2010, it offers a blend of history, charm, and modern amenities. The fully furnished and stocked restaurant includes 5 deep-water boat slips, allowing diners to dock and enjoy their meals on Smith Cove. The property size is 3085 square feet. This waterfront location offers potential for operating a thriving business.
Key Highlights
- Iconic waterfront restaurant in the heart of Rocky Neck, a historic art colony.
- Established business with a 60+ year history and enduring reputation.
- Includes 5 deep‑water boat slips for customer access.
Financial Insights
Estimated NOI and Cap Rate
NOI / Yr
$57,024
Cap Rate
3.80%
Suggested Prices Based on Cap Rates
Cap Rate 5%
$1,140,480
$1.1M
Cap Rate 7%
$814,629
$814.6K
Cap Rate 9%
$633,600
$633.6K
Market Conditions
NOI Build-Up for 3,085 SF
Gross rent
$77.7K $25.20/SF
− Vacancy
−$1.7K −$0.55/SF
EGI
$76.0K $24.65/SF
− OpEx
−$19.0K −$6.16/SF
NOI
$57.0K $18.48/SF
Area
Essex County, MA
Vacancy
2.20%
Lease Rate
$25.20 /SF/Yr
Expense Ratio
25.00%
Simulate Cap Rate and NOI
Suggested Prices Based on Cap Rates
Cap Rate 5%
$1,140,480
Cap Rate 7%
$814,629
Cap Rate 9%
$633,600
Alternative Uses
Best Use
Specialty Retail
$814.6K
$712.8K – $950.4K
NOI $57,024 @ 7.0% cap · market cap 3.80%
Second Best
Retail
$724.1K
$633.6K – $844.8K
NOI $50,688 @ 7.0% cap · market cap 3.38%
Theoretical Best
Office A
$1.83M
$1.60M – $2.13M
NOI $127,842 @ 7.0% cap · market cap 8.52%
Zoning and permitted uses should be independently verified with authorities.
How Realmo checks its estimates
Property Analytics
Unlock full access to Insights
Subscribe to Realmo Intelligence
Open Analytics
Current Use
Location Intelligence
Trade Area within ½ mile
945
Businesses Nearby
Under-served
Demand for This Use
Explore this area
Business Placement
Demographics for 01930, MA
29,729
Population
14,630
Households
2
Avg Household Size
50
Median Age
39%
College-Educated
94%
High-School Grad
26.2 sq mi
ZIP Area
1,135
Density / Sq Mi
$87,898
Median Household Income
$49,580
Median Earnings
$1,395
Median Rent
$587,800
Median Home Value
Check the figures for this property
Cap Rate, Value Estimation, Potential NOI and more
View Realmo Analytics
Market
Vacancy Rate% for Retail in Northeast region

Questions? Ask Rey
Realmo’s AI knows this listing — price, zoning, demand, history. Ask anything.




Similar Off Market Nearby
- Del Rio's Cafe & Catering — 18 Rogers St, Gloucester, MA 01930
- Rhea Pizzeria Napoletana — Corner of Roger st &, Harbor Loop, Gloucester, MA 01930
Frequently Asked Questions
What type of property is this?
Restaurant - Established waterfront restaurant in historic Rocky Neck art colony.
Where is this restaurant located?
The property is located at 73 Rocky Neck Ave. #1 Gloucester, MA.
What is the asking price?
The asking price for this property is $1,500,000.
What are key features of this property?
This property features: Iconic waterfront restaurant in the heart of Rocky Neck, a historic art colony.; Established business with a 60+ year history and enduring reputation.; Includes **5 deep‑water boat slips** for customer access.


