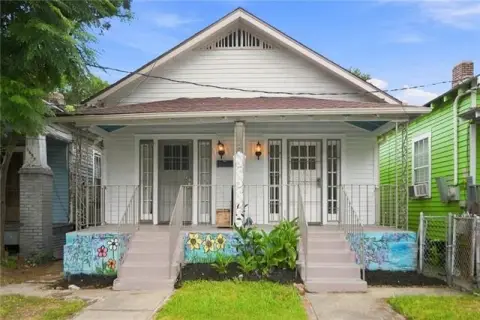
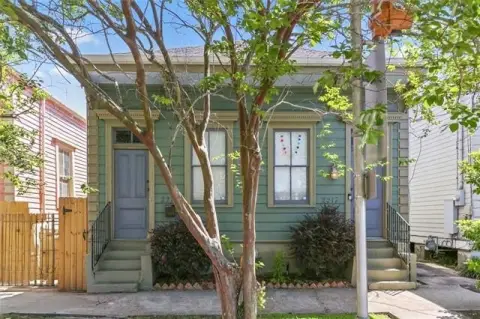
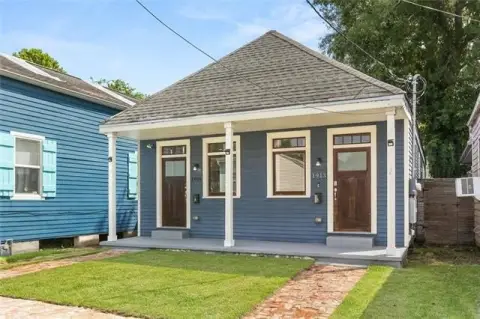
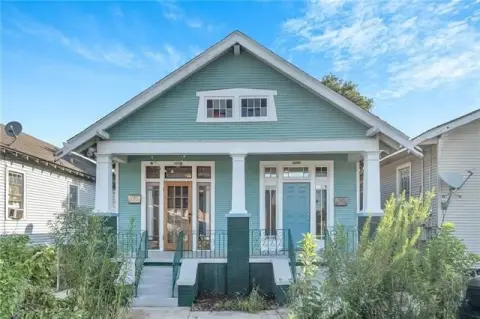
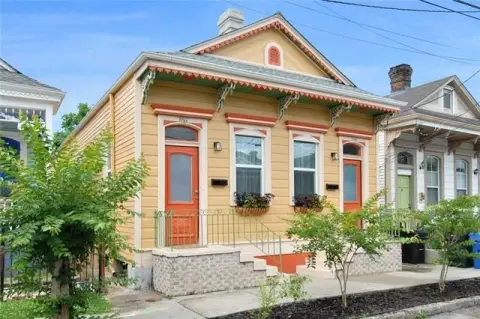
Two-Unit Duplex with
For Sale
$379,900
729-731 Amelia St, New Orleans, LA 70115
Each residence includes a private washer/dryer, laminate flooring, and high ceilings.
Property Size1,300 SF
Price / SF$292.23
Days on Market82
Property Features for 729-731 Amelia St
General Information
Standard status
Active
Size
1,300 SF
Property subtype
Multi-Family
Units
Unit Mix
2 x 1BR/1BA
Multifamily Units
2
Amenities
laminate floors
high ceilings
private washer/dryer
back courtyard
Building Details
Year Built
1902
Buildings
1
Listing Agency:
WayMaker Realty, LLC
Listed By:
Angel Parfait · License #995703338
(504) 650-3327
Source:
Fiorellaavenue
Added: Jul 30
Changed: Oct 12
Last Checked: Oct 7 at 3:14PM
Displayed information is deemed reliable but is not guaranteed and should be independently verified. All listing content including descriptions, pricing, images are the copyrighted material of WayMaker Realty, LLC

Ask AI about this property
Review the available facts, identify missing information and prepare questions for the agent.
Investment Insights
Based on property information with market context.
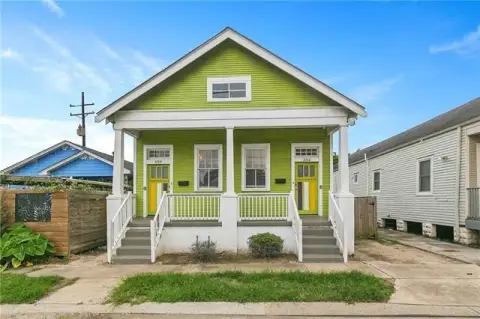
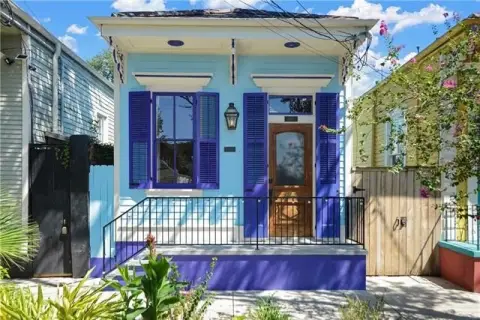
Built in 1902, this New Orleans duplex contains two separate residences, each arranged with one bedroom and one bathroom. Both units feature laminate flooring, elevated ceilings, and private washer/dryer appliances. A shared rear courtyard provides outdoor space for use by the occupants.
The property is located at 729-731 Amelia St, within one block of Tchoupitoulas and near Magazine Street’s dining, retail, nightlife, and local businesses. The location also offers a direct route to downtown and Audubon Park. The configuration supports separate occupancy of both units or owner residence in one unit with the other available for rent.
The property is located at 729-731 Amelia St, within one block of Tchoupitoulas and near Magazine Street’s dining, retail, nightlife, and local businesses. The location also offers a direct route to downtown and Audubon Park. The configuration supports separate occupancy of both units or owner residence in one unit with the other available for rent.
Key Highlights
- Two‑unit duplex with one bedroom and one bathroom in each residence
- Private washer/dryer provided in both units
- Laminate flooring and high ceilings throughout the residences
Financial Insights
Estimated NOI and Cap Rate
NOI / Yr
$11,174
Cap Rate
2.94%
Suggested Prices Based on Cap Rates
Cap Rate 5%
$223,480
$223.5K
Cap Rate 7%
$159,629
$159.6K
Cap Rate 9%
$124,156
$124.2K
Market Conditions
NOI Build-Up for 1,300 SF
Gross rent
$17.5K $13.44/SF
− Vacancy
−$1.5K −$1.16/SF
EGI
$16.0K $12.28/SF
− OpEx
−$4.8K −$3.68/SF
NOI
$11.2K $8.60/SF
Area
ZIP 70115
Vacancy
8.64%
Lease Rate
$13.44 /SF/Yr
Expense Ratio
30.00%
Simulate Cap Rate and NOI
Suggested Prices Based on Cap Rates
Cap Rate 5%
$223,480
Cap Rate 7%
$159,629
Cap Rate 9%
$124,156
Alternative Uses
Best Use
Multifamily LT 5
$159.6K
$139.7K – $186.2K
NOI $11,174 @ 7.0% cap · market cap 2.94%
Second Best
Apartment 5plus
$141.5K
$123.8K – $165.1K
NOI $9,905 @ 7.0% cap · market cap 2.61%
Theoretical Best
Office A
$343.0K
$300.1K – $400.1K
NOI $24,008 @ 7.0% cap · market cap 6.32%
Zoning and permitted uses should be independently verified with authorities.
How Realmo checks its estimates
Property Analytics
Lease Details
2
Residential units
Location Intelligence
Trade Area within ½ mile
1,829
Businesses Nearby
Explore this area
Business Placement
Demographics for 70115, LA
31,736
Population
18,134
Households
1.8
Avg Household Size
38
Median Age
64%
College-Educated
95%
High-School Grad
3.8 sq mi
ZIP Area
8,352
Density / Sq Mi
$94,181
Median Household Income
$57,242
Median Earnings
$1,442
Median Rent
$616,600
Median Home Value
Market
Vacancy Rate% for Multifamily in South region


Frequently Asked Questions
What type of property is this?
Duplex - Each residence includes a private washer/dryer, laminate flooring, and high ceilings.
Where is this duplex located?
The property is located at 729-731 Amelia St New Orleans, LA.
What is the asking price?
The asking price for this property is $379,900.
What are key features of this property?
This property features: Two‑unit duplex with one bedroom and one bathroom in each residence; Private washer/dryer provided in both units; Laminate flooring and high ceilings throughout the residences