Updated Two-Unit
For Sale
$259,900
7231 MARSDEN STREET, Philadelphia, PA 19135
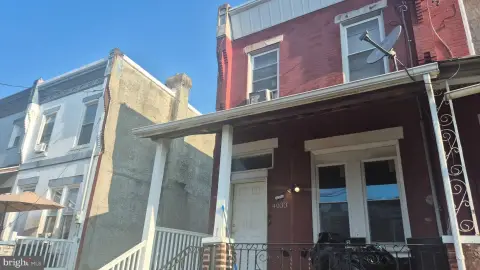
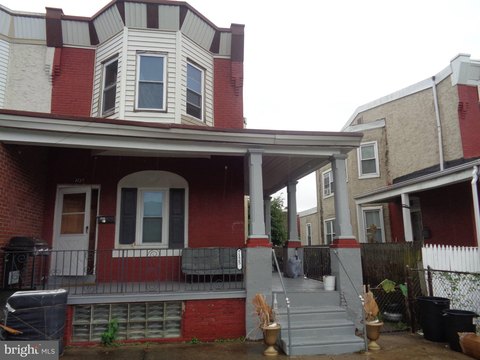
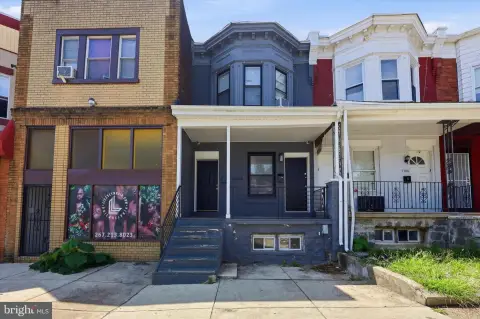
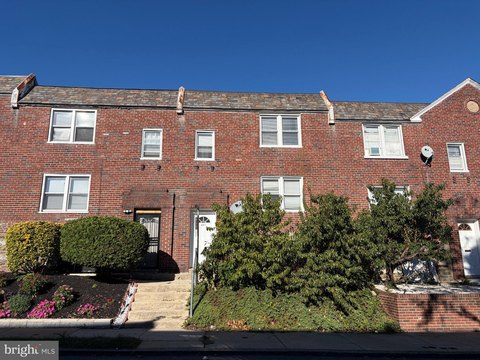
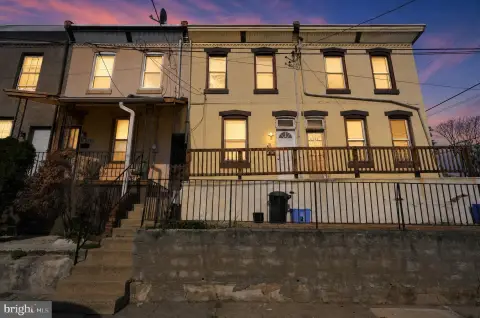
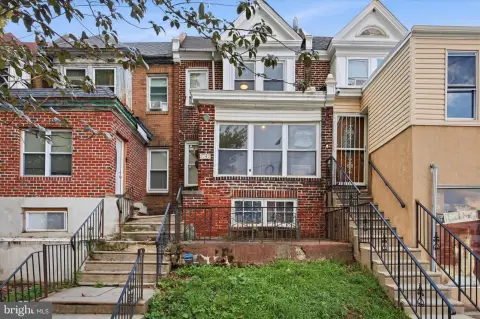
Two-bedroom apartments with recent interior improvements and direct access to regional transit connections.
Property Size1,440 SF
Days on Market64
Property Features for 7231 MARSDEN STREET
General Information
Standard status
Active
Size
1,440 SF
Property subtype
Duplex
Site & Location
Highway Access
Yes
Public Transit
Yes
Units
Unit Mix
2 x 2BR
Multifamily Units
2
Taxes and HOA fees
Annual Taxes
$3,591
Building Details
Building Size
1,440 SF
Year Built
1955
Buildings
1
Listing Agency:
Roc Hous Real Estate LLC
Listed By:
christopher j nugent · License #rs348251
(267) 334-5590
Source:
Lizclarkrealestate
Added: Aug 8
Changed: Oct 8
Last Checked: Oct 10 at 12:50AM
Displayed information is deemed reliable but is not guaranteed and should be independently verified. All listing content including descriptions, pricing, images are the copyrighted material of Roc Hous Real Estate LLC
Investment Insights
Based on property information with market context.
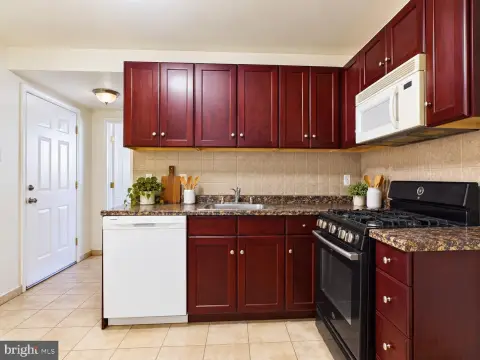
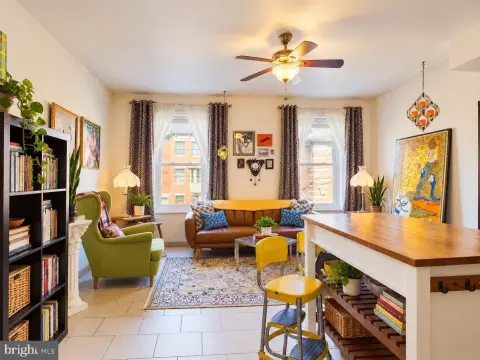
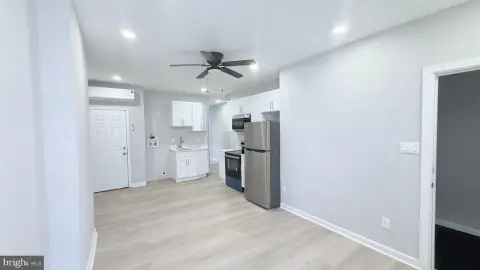
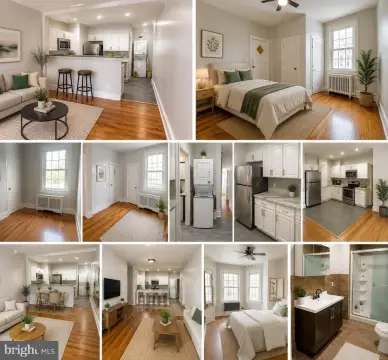
This duplex contains two separate 2-bedroom apartments, providing a straightforward two-unit configuration. Both residences have refreshed flooring and carpeting, while the upper-level apartment also includes new windows. The property was built in 1955, and a roof replacement was completed in July 2026.
Located in Tacony, the property sits one block from the Tacony SEPTA Transportation Center, with access to bus routes and Regional Rail service. I-95 is a few blocks away, connecting the area with Philadelphia, New Jersey, and Delaware. Nearby shops, restaurants, parks, and the Delaware River waterfront add to the surrounding neighborhood amenities.
Located in Tacony, the property sits one block from the Tacony SEPTA Transportation Center, with access to bus routes and Regional Rail service. I-95 is a few blocks away, connecting the area with Philadelphia, New Jersey, and Delaware. Nearby shops, restaurants, parks, and the Delaware River waterfront add to the surrounding neighborhood amenities.
Key Highlights
- Two 2‑bedroom units in a duplex configuration
- Updated flooring and carpeting in both apartments
- Second‑floor unit has brand‑new windows
Financial Insights
Estimated NOI and Cap Rate
NOI / Yr
$22,651
Cap Rate
8.72%
Suggested Prices Based on Cap Rates
Cap Rate 5%
$453,020
$453.0K
Cap Rate 7%
$323,586
$323.6K
Cap Rate 9%
$251,678
$251.7K
Market Conditions
NOI Build-Up for 1,440 SF
Gross rent
$43.7K $30.36/SF
− Vacancy
−$2.5K −$1.76/SF
EGI
$41.2K $28.60/SF
− OpEx
−$18.5K −$12.87/SF
NOI
$22.7K $15.73/SF
Area
Philadelphia, PA
Vacancy
5.80%
Lease Rate
$30.36 /SF/Yr
Expense Ratio
45.00%
Simulate Cap Rate and NOI
Suggested Prices Based on Cap Rates
Cap Rate 5%
$453,020
Cap Rate 7%
$323,586
Cap Rate 9%
$251,678
Alternative Uses
Best Use
Multifamily LT 5
$351.0K
$307.2K – $409.6K
NOI $24,573 @ 7.0% cap · market cap 9.45%
Second Best
Apartment 5plus
$323.6K
$283.1K – $377.5K
NOI $22,651 @ 7.0% cap · market cap 8.72%
Theoretical Best
—
—
same as Best Use
Zoning and permitted uses should be independently verified with authorities.
Property Analytics
Unlock full access to Insights
Subscribe to Realmo Intelligence
Open Analytics
Current Use
Lease Details
2
Residential units
Yes
Highway access
Location Intelligence
Trade Area within ½ mile
1,627
Businesses Nearby
Explore this area
Business Placement
Demographics for 19135, PA
35,422
Population
14,323
Households
2.5
Avg Household Size
34
Median Age
16%
College-Educated
82%
High-School Grad
2.3 sq mi
ZIP Area
15,401
Density / Sq Mi
$51,817
Median Household Income
$38,673
Median Earnings
$1,197
Median Rent
$182,900
Median Home Value
Check the figures for this property
Cap Rate, Value Estimation, Potential NOI and more
View Realmo Analytics
Market
Vacancy Rate% for Multifamily in Northeast region

Questions? Ask Rey
Realmo’s AI knows this listing — price, zoning, demand, history. Ask anything.


Frequently Asked Questions
What type of property is this?
Duplex - Two-bedroom apartments with recent interior improvements and direct access to regional transit connections.
Where is this duplex located?
The property is located at 7231 MARSDEN STREET Philadelphia, PA.
What is the asking price?
The asking price for this property is $259,900.
What are key features of this property?
This property features: Two 2‑bedroom units in a duplex configuration; Updated flooring and carpeting in both apartments; Second‑floor unit has brand‑new windows


