Two-Unit Duplex with Separate
For Sale
$629,900
716 Lawrence St., Lowell, MA 01852
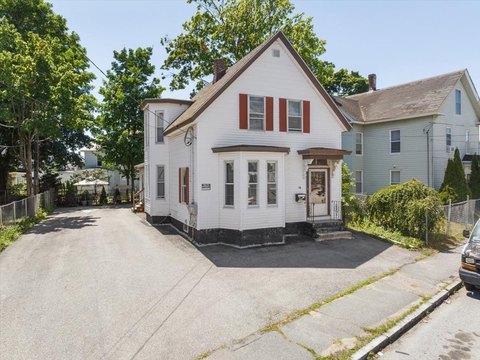
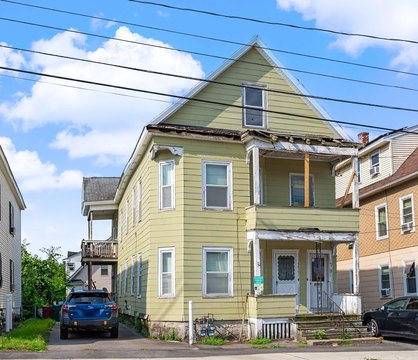
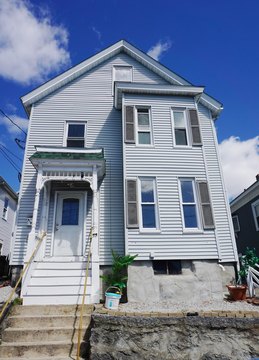
Distinct three- and four-bedroom layouts feature granite kitchens, wood-floored living rooms, and a walk-out basement.
Property Size2,585 SF
Price / SF$243.68
Days on Market135
Property Features for 716 Lawrence St.
General Information
Standard status
Active
Size
2,585 SF
Total Parking Spaces
1
Property subtype
Multi-Family
Zoning
TMU
Net Operating Income
$60,600
Units
Unit Mix
1 x 3BR/1BA, 1 x 4BR/1BA
Multifamily Units
2
Additional Details
Gross Income
$60,600
Taxes and HOA fees
Annual Taxes
$6,041
Amenities
back deck
back yard
Building Details
Building Size
2,585 SF
Year Built
1900
Buildings
1
Stories
2
Tenancy
Multi
Listing Agency:
Century 21 North East
(978) 635-3400
Listed By:
Karen J. Dame
(978) 502-3109
Source:
Churchillprop
Added: Jun 4
Changed: Oct 6
Last Checked: Oct 14 at 8:00PM
Displayed information is deemed reliable but is not guaranteed and should be independently verified. All listing content including descriptions, pricing, images are the copyrighted material of Century 21 North East

Ask AI about this property
Review the available facts, identify missing information and prepare questions for the agent.
Investment Insights
Based on property information with market context.
Built in 1900, this two-unit duplex at 716 Lawrence St. in Lowell includes distinct residential layouts with practical interior finishes. Unit 1 offers 3 bedrooms, a kitchen with granite counters, a living room with wood flooring, and a full bathroom. Unit 2 provides 4 bedrooms, a granite-counter kitchen, a wood-floored living room, a full bath, attic pull-down access, and a private back deck.
The property has vinyl siding, a backyard, one permitted parking space, and additional on-street parking. A full walk-out dirt basement provides storage space. Unit 1 has a Lead Certificate of Maintained Compliance, while both apartments have compliance certificates from Lowell Inspectional Services. Existing tenants would like to remain; the Unit 1 lease ends October 1, 2026, and the Unit 2 lease ends February, 2027.
The property has vinyl siding, a backyard, one permitted parking space, and additional on-street parking. A full walk-out dirt basement provides storage space. Unit 1 has a Lead Certificate of Maintained Compliance, while both apartments have compliance certificates from Lowell Inspectional Services. Existing tenants would like to remain; the Unit 1 lease ends October 1, 2026, and the Unit 2 lease ends February, 2027.
Key Highlights
- Two‑unit duplex at 716 Lawrence St., Lowell, MA 01852
- Unit 1 includes 3 bedrooms; Unit 2 includes 4 bedrooms
- Granite‑counter kitchens and wood flooring in both living rooms
Financial Insights
Estimated NOI and Cap Rate
NOI / Yr
$51,218
Cap Rate
8.13%
Suggested Prices Based on Cap Rates
Cap Rate 5%
$1,024,360
$1.0M
Cap Rate 7%
$731,686
$731.7K
Cap Rate 9%
$569,089
$569.1K
Market Conditions
NOI Build-Up for 2,585 SF
Gross rent
$79.1K $30.60/SF
− Vacancy
−$5.9K −$2.30/SF
EGI
$73.2K $28.31/SF
− OpEx
−$22.0K −$8.49/SF
NOI
$51.2K $19.81/SF
Area
Lowell, MA
Vacancy
7.50%
Lease Rate
$30.60 /SF/Yr
Expense Ratio
30.00%
Simulate Cap Rate and NOI
Suggested Prices Based on Cap Rates
Cap Rate 5%
$1,024,360
Cap Rate 7%
$731,686
Cap Rate 9%
$569,089
Alternative Uses
Best Use
Multifamily LT 5
$731.7K
$640.2K – $853.6K
NOI $51,218 @ 7.0% cap · market cap 8.13%
Second Best
Apartment 5plus
$658.7K
$576.4K – $768.5K
NOI $46,112 @ 7.0% cap · market cap 7.32%
Theoretical Best
Office A
$909.8K
$796.1K – $1.06M
NOI $63,688 @ 7.0% cap · market cap 10.11%
Zoning and permitted uses should be independently verified with authorities.
How Realmo checks its estimates
Property Analytics
Unlock full access to Insights
Subscribe to Realmo Intelligence
Open Analytics
Current Use
Lease Details
2
Residential units
Multi-tenant
Tenancy
Location Intelligence
Trade Area within ½ mile
951
Businesses Nearby
Explore this area
Business Placement
Demographics for 01852, MA
36,708
Population
15,363
Households
2.4
Avg Household Size
37
Median Age
33%
College-Educated
86%
High-School Grad
5.0 sq mi
ZIP Area
7,342
Density / Sq Mi
$77,058
Median Household Income
$48,976
Median Earnings
$1,567
Median Rent
$397,200
Median Home Value
Check the figures for this property
Cap Rate, Value Estimation, Potential NOI and more
View Realmo Analytics
Market
Vacancy Rate% for Multifamily in Northeast region


Frequently Asked Questions
What type of property is this?
Duplex - Distinct three- and four-bedroom layouts feature granite kitchens, wood-floored living rooms, and a walk-out basement.
Where is this duplex located?
The property is located at 716 Lawrence St. Lowell, MA.
What is the asking price?
The asking price for this property is $629,900.
What are key features of this property?
This property features: Two‑unit duplex at 716 Lawrence St., Lowell, MA 01852; Unit 1 includes 3 bedrooms; Unit 2 includes 4 bedrooms; Granite‑counter kitchens and wood flooring in both living rooms