Residential Income Property with
For Sale
$374,900
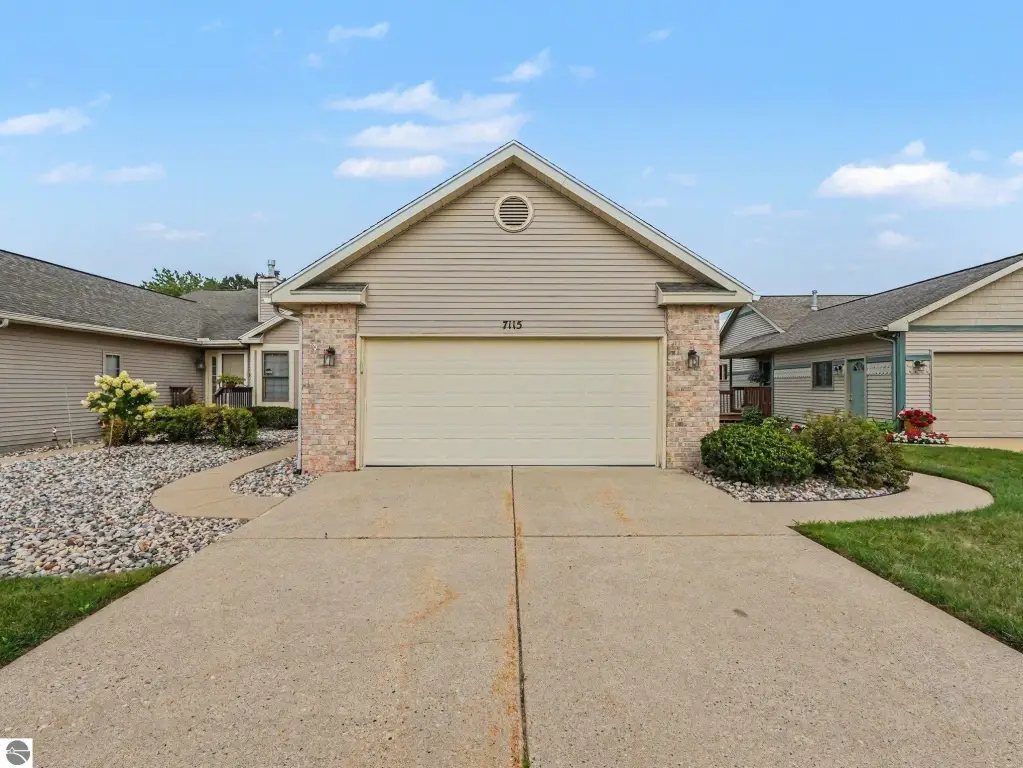
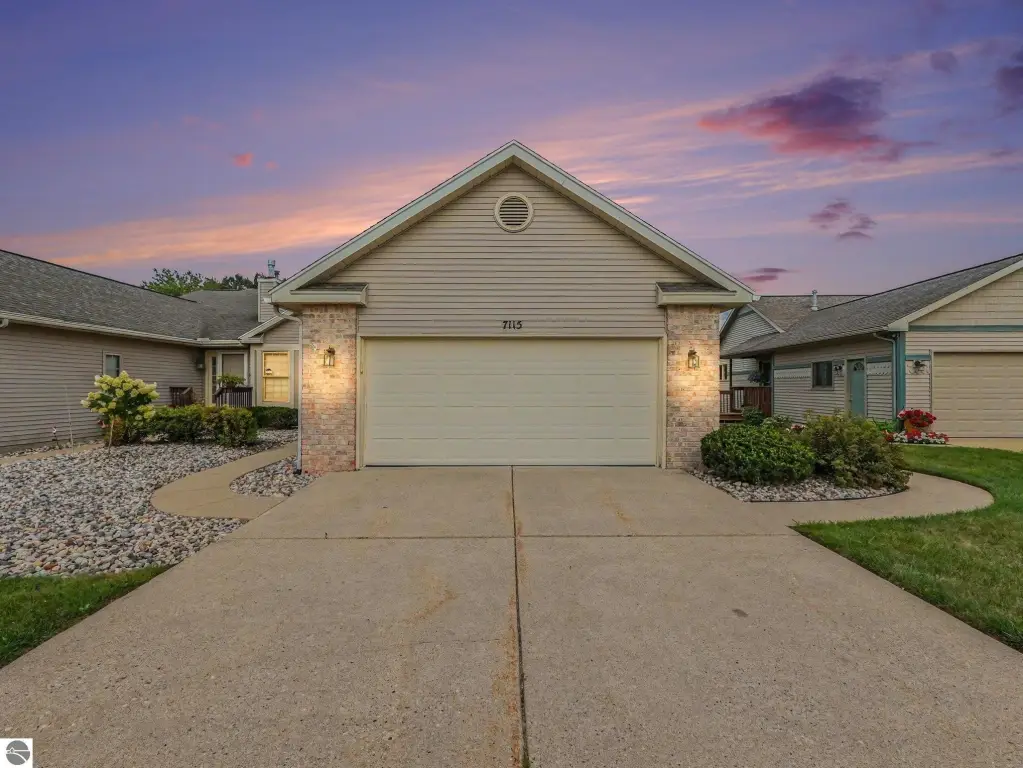
7115 Glen Terra Drive, Lansing, MI 48917
Single Family, Duplex, Lansing, MI
Property Size3,179 SF
Price / SF$117.93
Days on Market49
Property Features for 7115 Glen Terra Drive
General Information
Property type
Residential
Property subtype
Duplex
Zoning
Residential
Zoning description
Residential
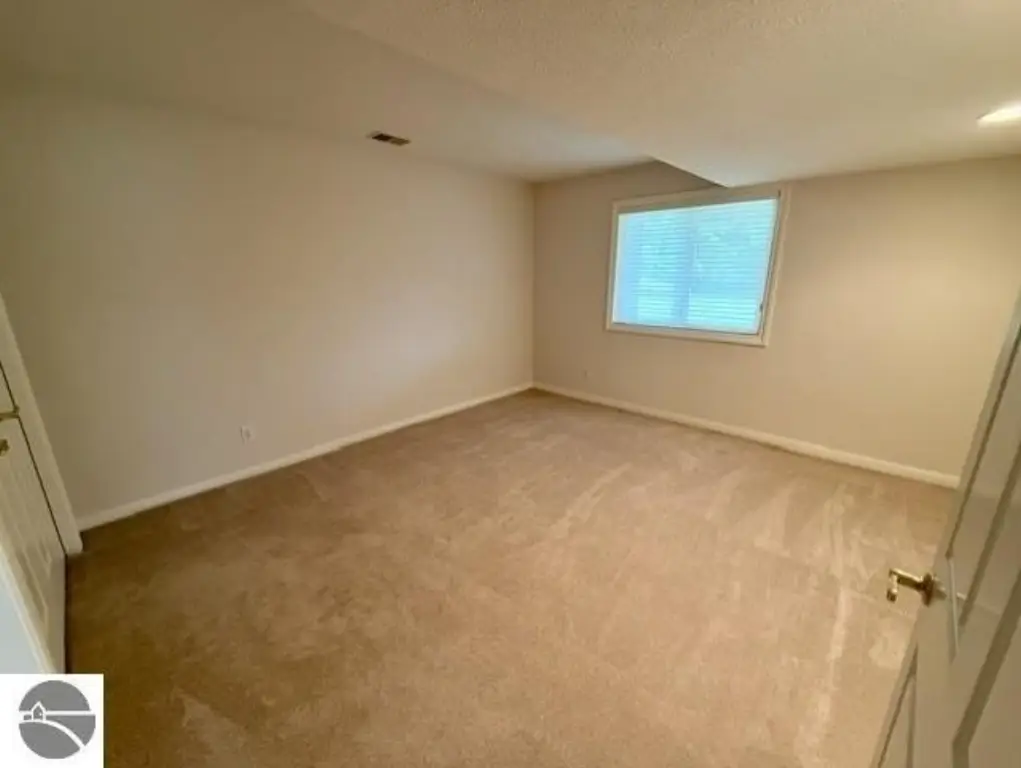
Bedrooms
2
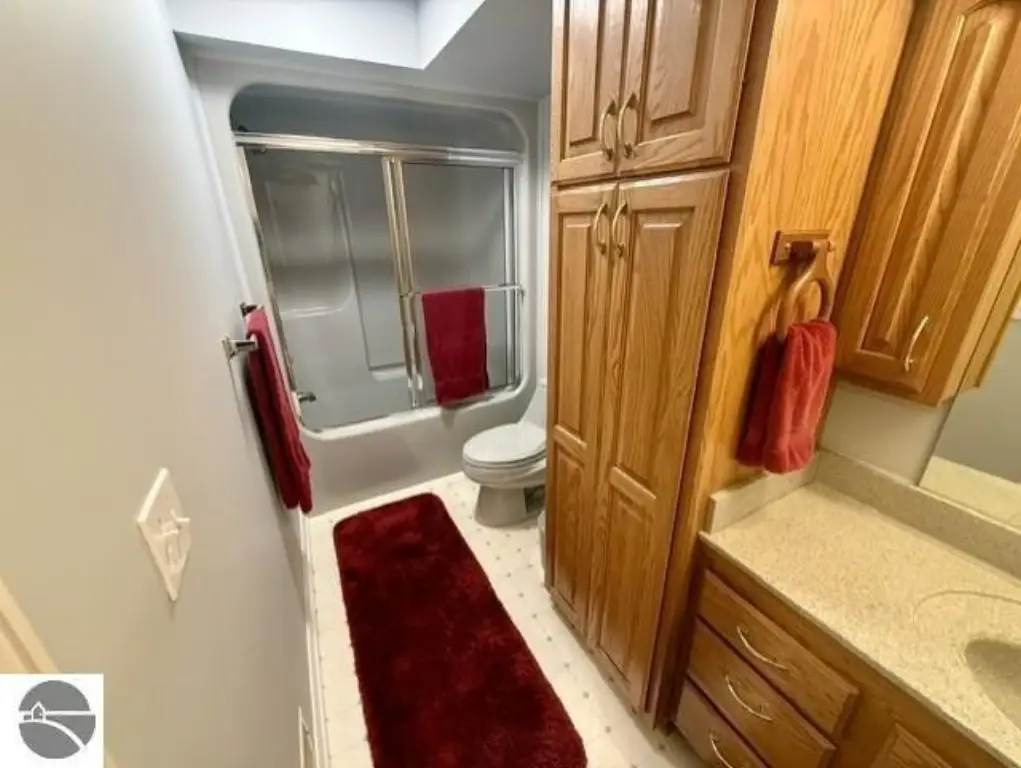
Bathrooms
3
Full bathrooms
3
Rooms
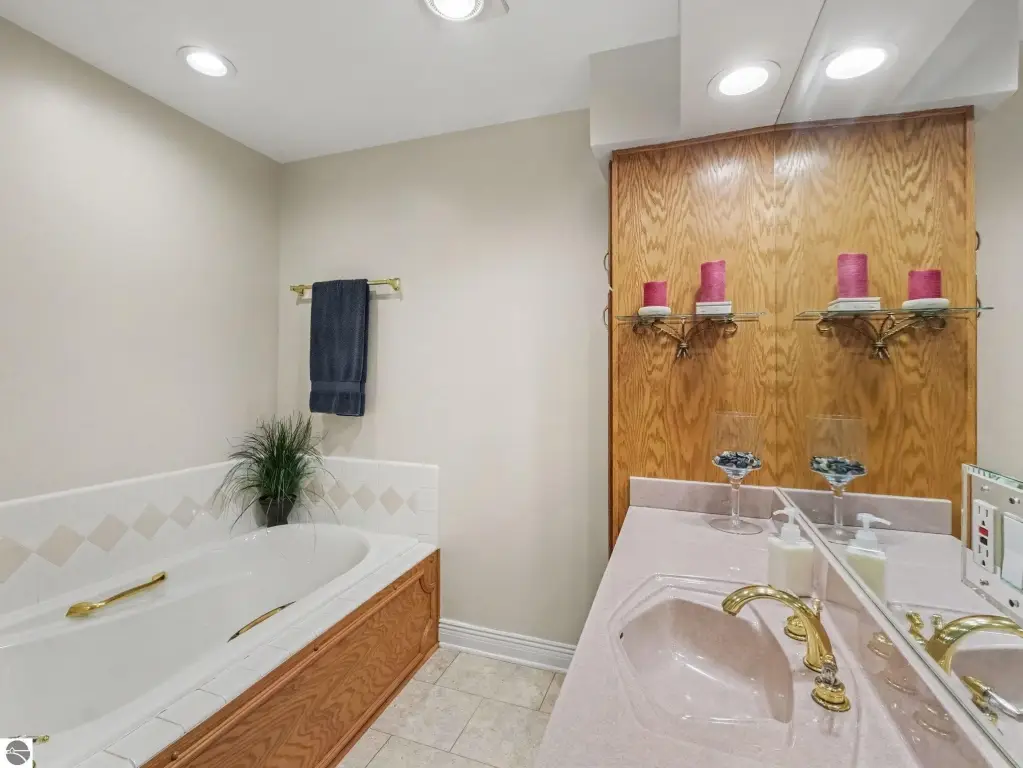
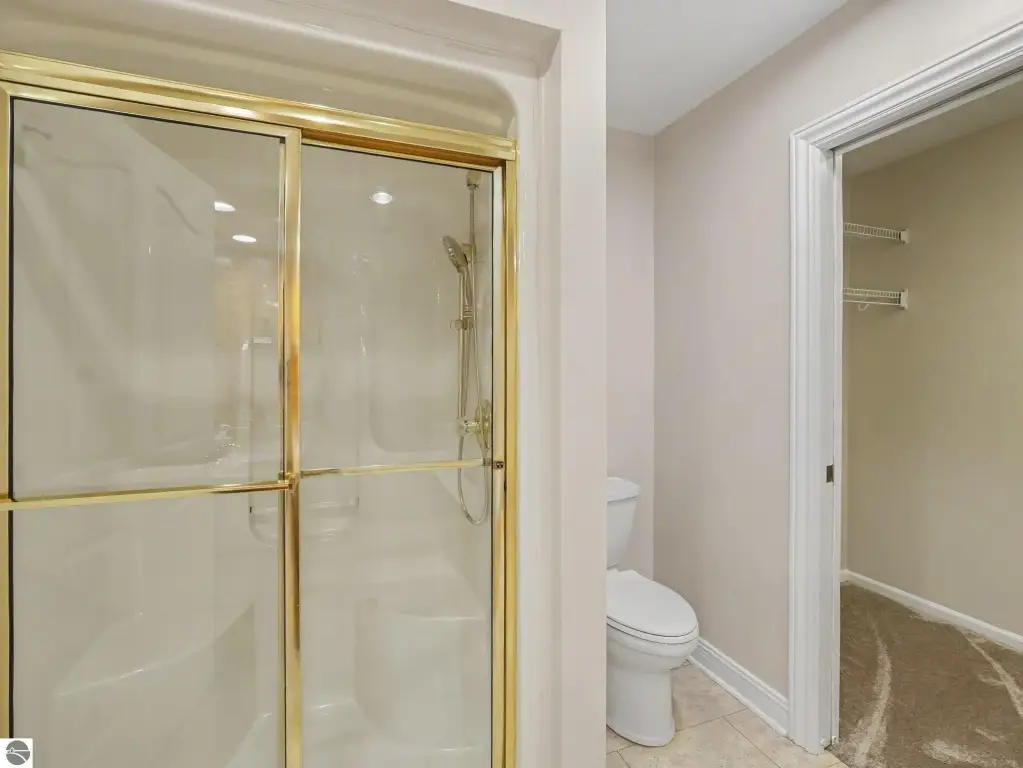
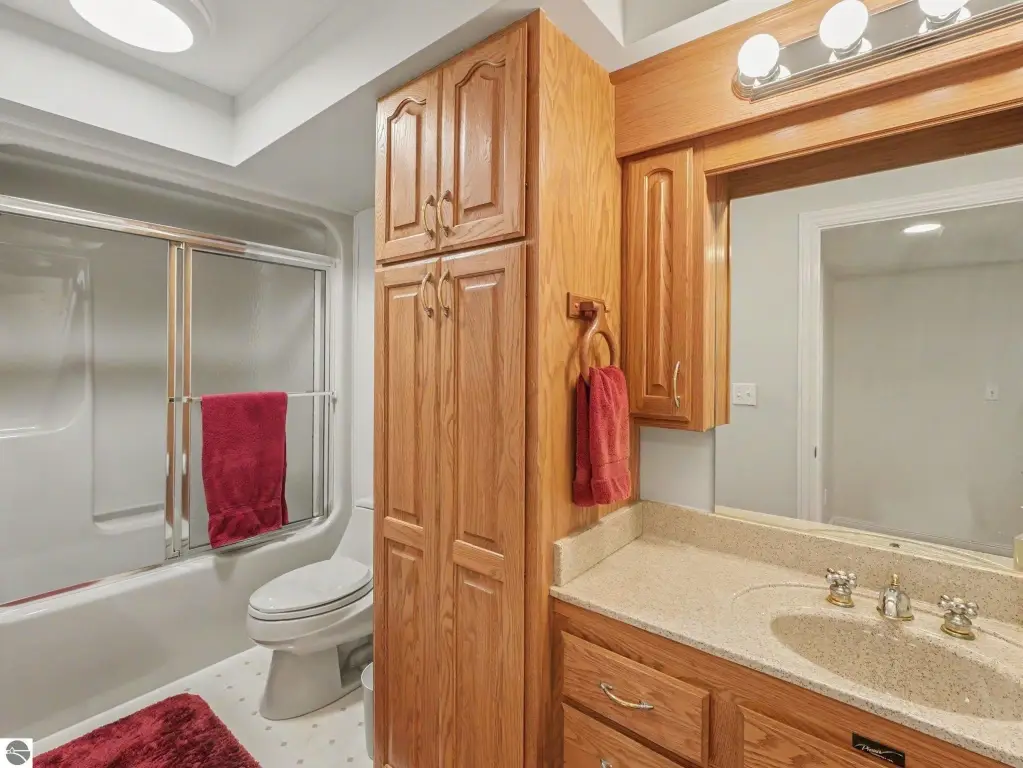
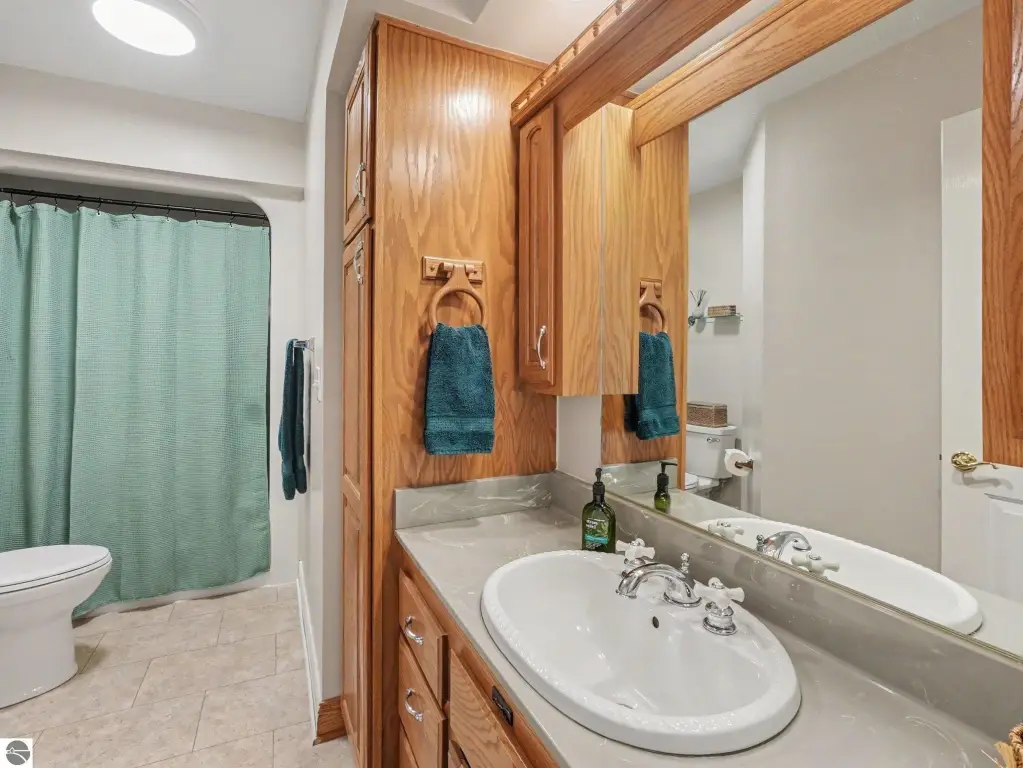
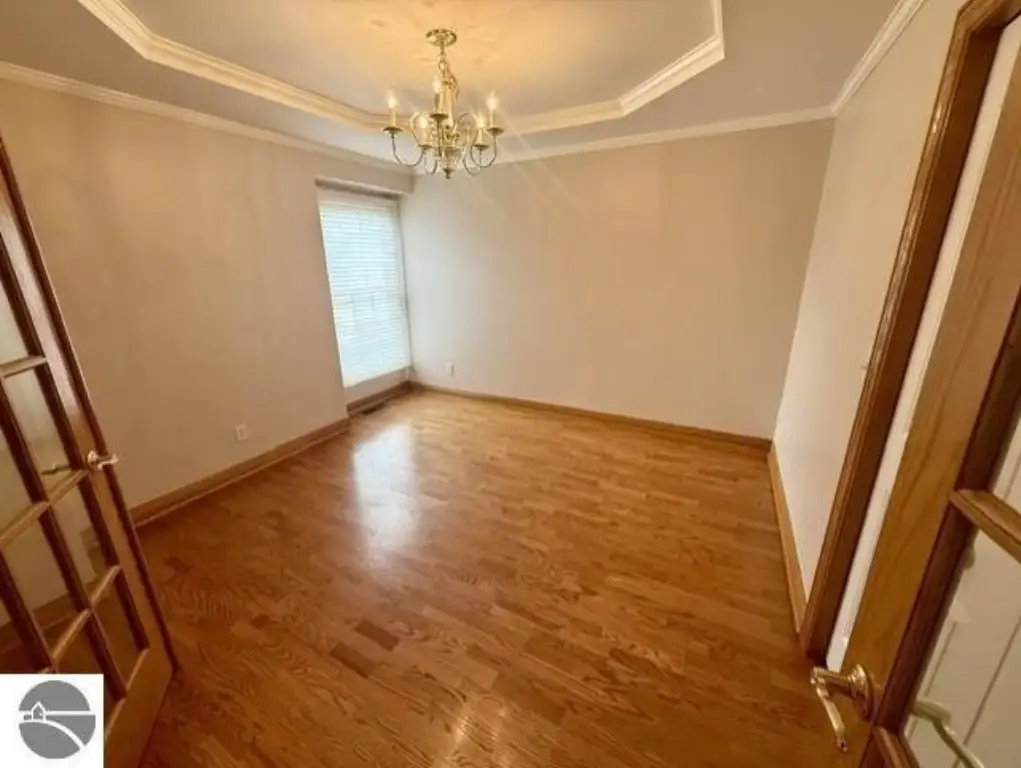
Bedroom 1, Bedroom 2, Family Room, Bathroom 2, Bathroom 3, Bathroom 1, Dining Room
Patio and Porch features
Patio
Interior features
Foyer Entrance, Wet Bar, Pantry, Island Kitchen, Formal Dining Room, Vaulted Ceilings, Drywall
Exterior features
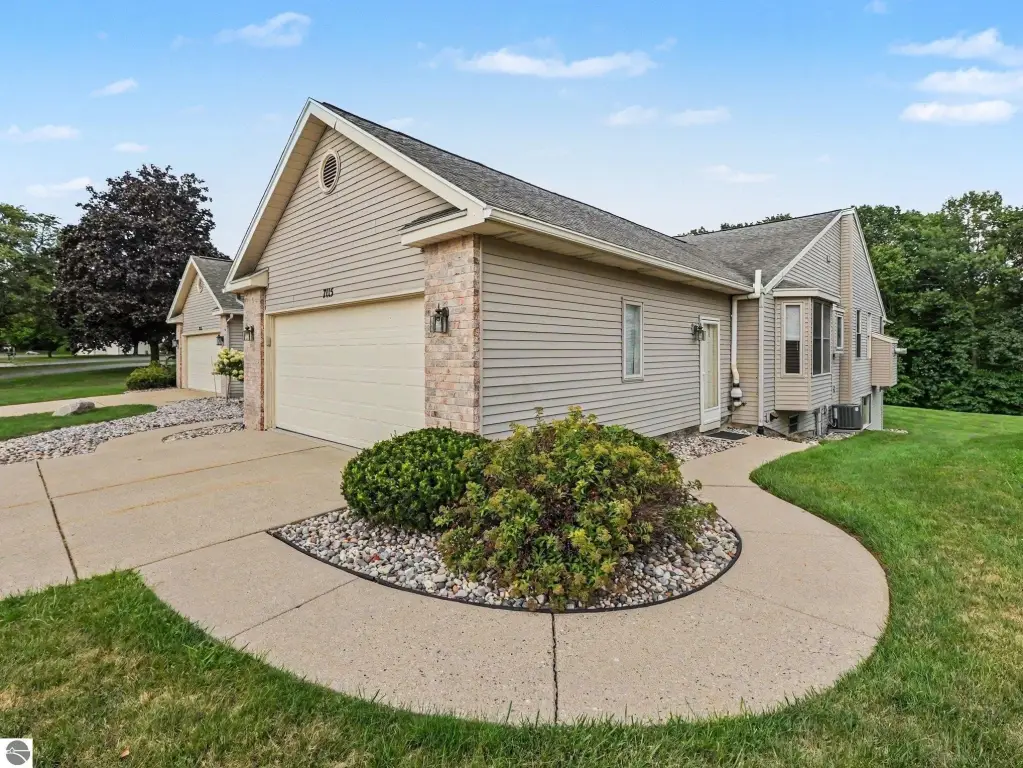
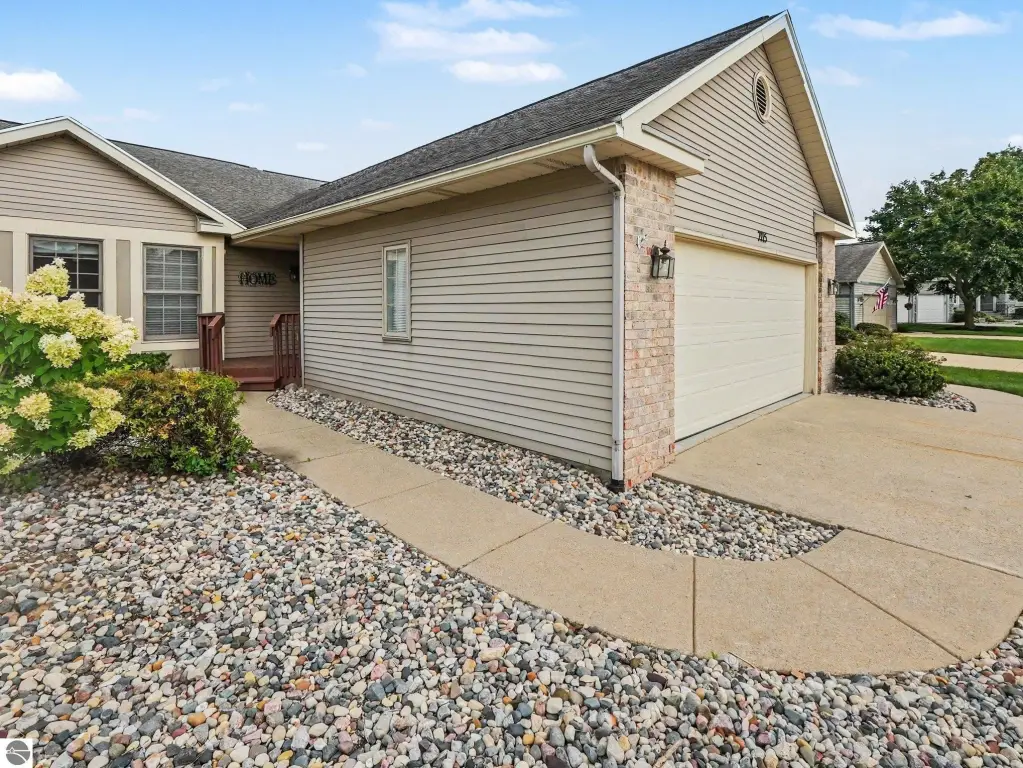
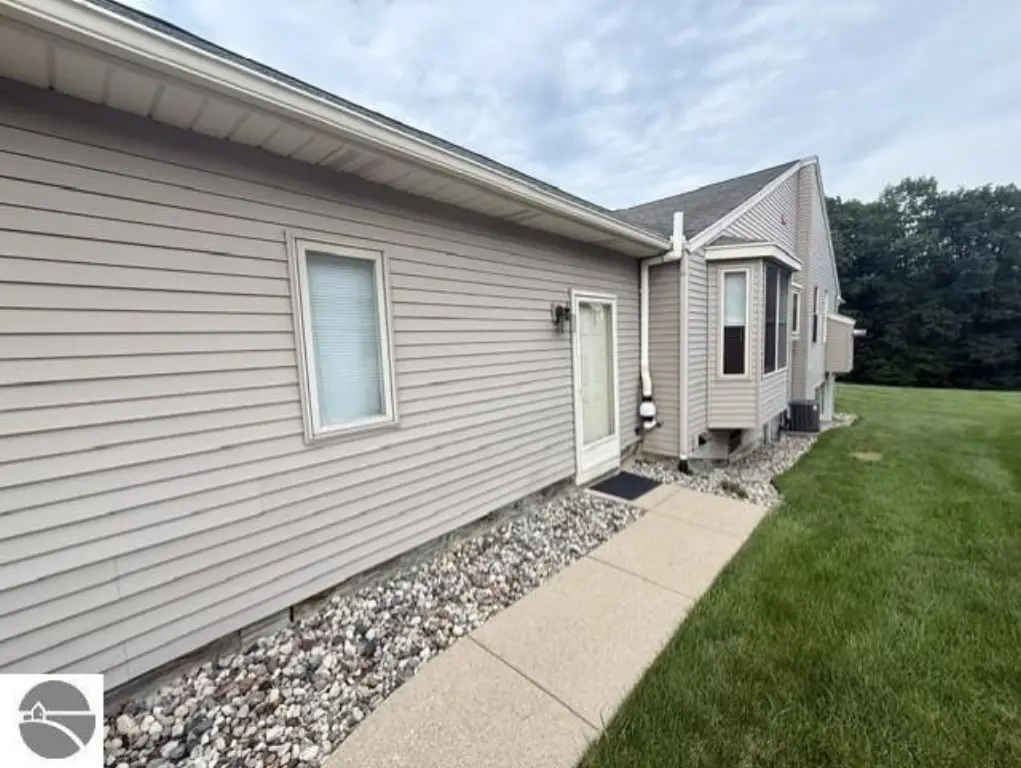
Patio, Sidewalk, Landscaped
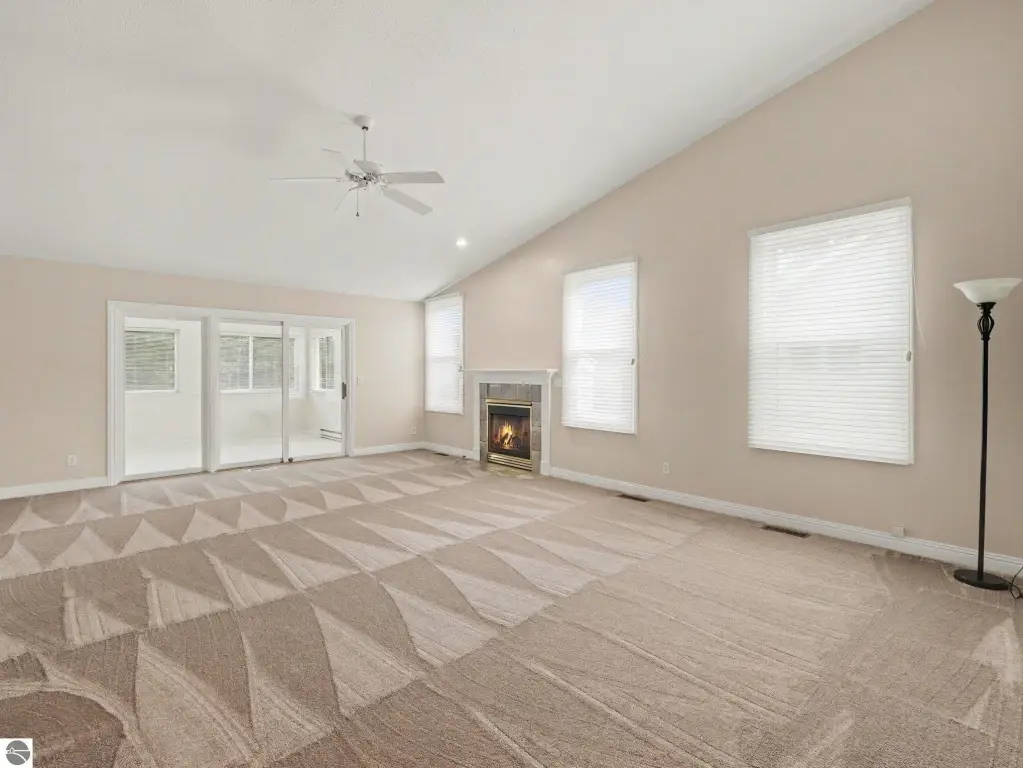
Fireplace
1
Appliances
Disposal, Dishwasher, Wall Oven, Cook Top
Lot features
Condo/ None, Sloping
Elementary school district
Grand Ledge Public Schools
Middle school district
Grand Ledge Public Schools
High school district
Grand Ledge Public Schools
Directions
Canal to Glen Terra
Subdivision
Forrest Glen Condominiums
Standard status
Active
Size
3,179 SF
Taxes and HOA fees
Tax Description
UNIT 71. FOREST GLEN CONDOMINIUMS, T4N,R3W, DELTA TWP 1995
Tax Annual Amount
5452
HOA Fee
$540 Monthly
Legal Description
UNIT 71. FOREST GLEN CONDOMINIUMS, T4N,R3W, DELTA TWP 1995
Building Details
Year built
1995
Building materials
Frame
Roof type
Asphalt
Architectural style
Other
Listing Agency:
CENTURY 21 LEE-MAC REALTY
(989) 463-6085
Listed By:
Adam Vibber · License #6506046950
(989) 560-3069
Added: Aug 19
Changed: Sep 15
Last Checked: Oct 6 at 4:06AM
MLS# 1949566
Copyright © 2026 Northern Great Lakes Realtors MLS. All rights reserved. All information provided by the listing agent/broker is deemed reliable but is not guaranteed and should be independently verified.
Investment Insights
Based on property information with market context.
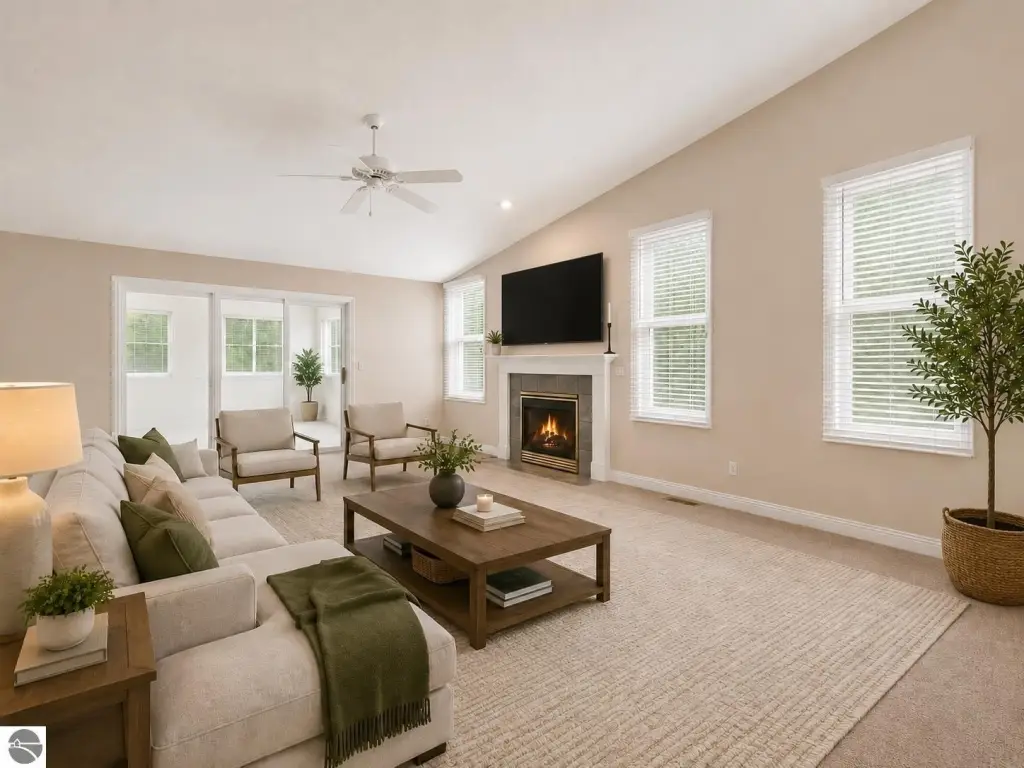
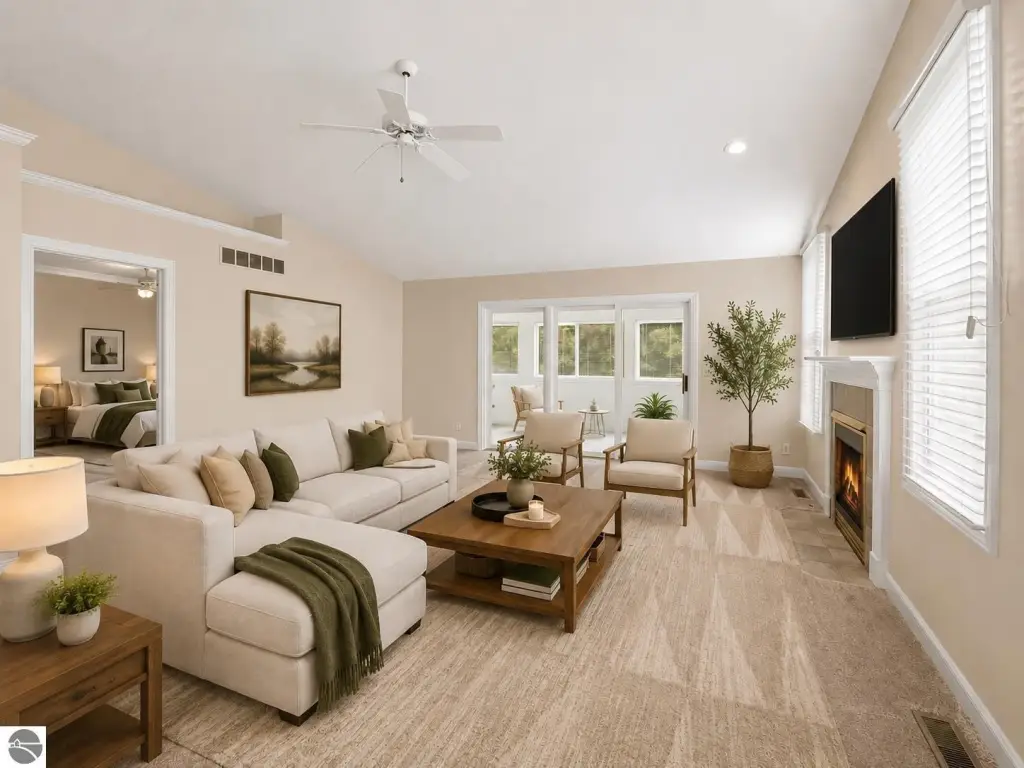
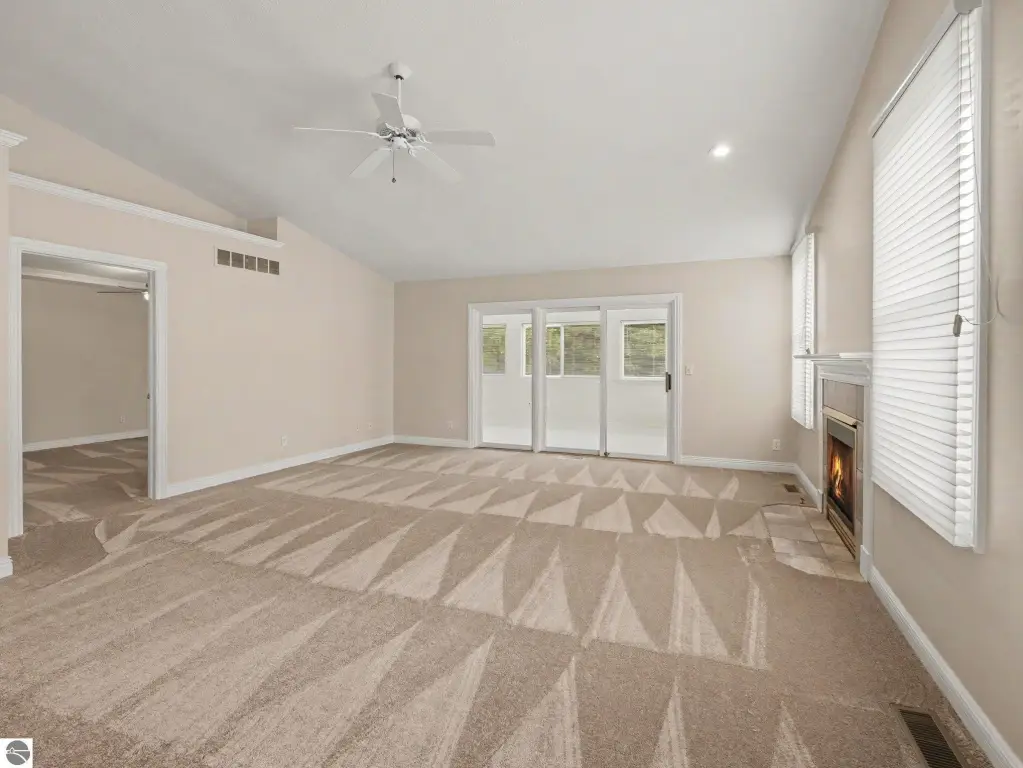
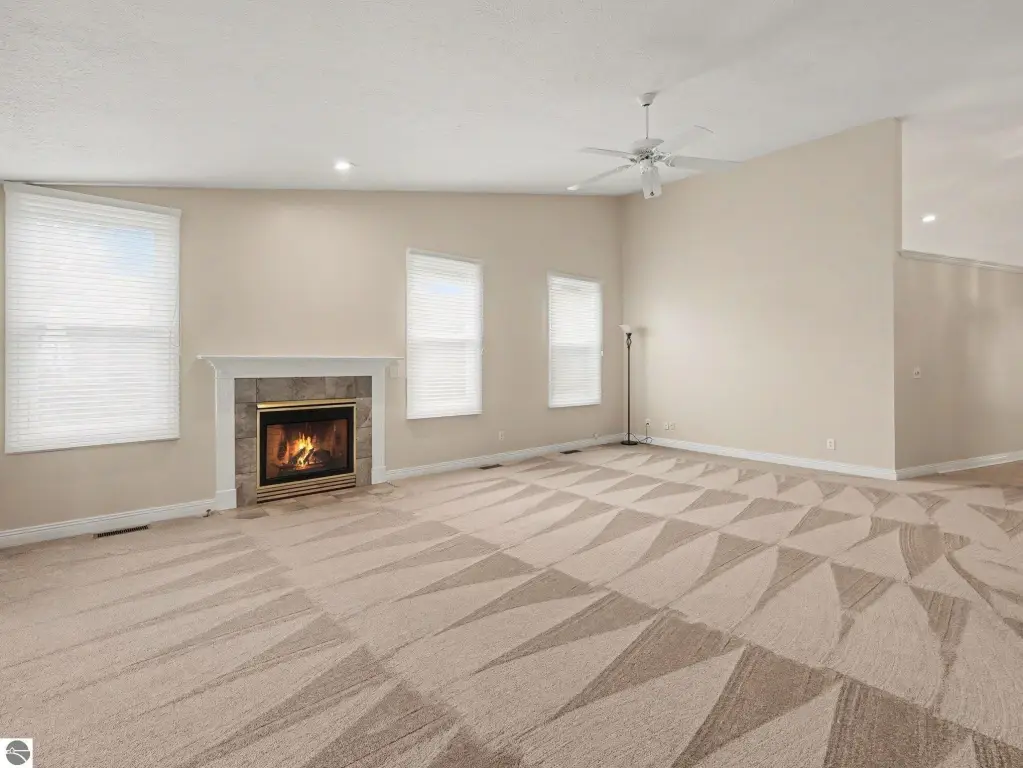
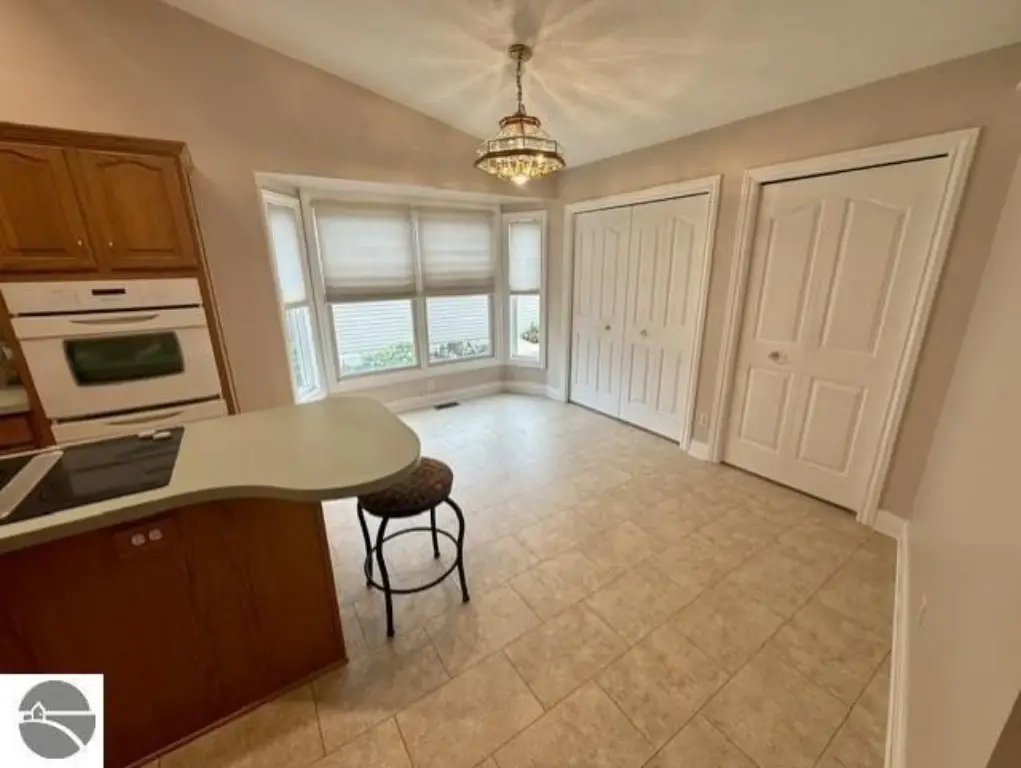
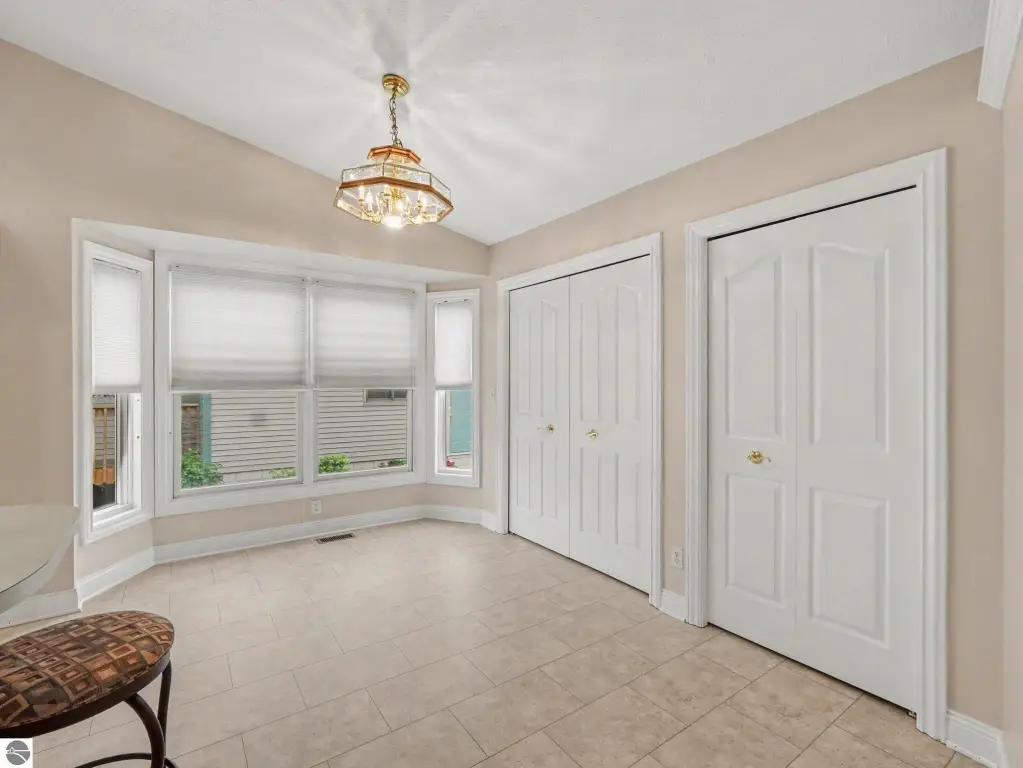
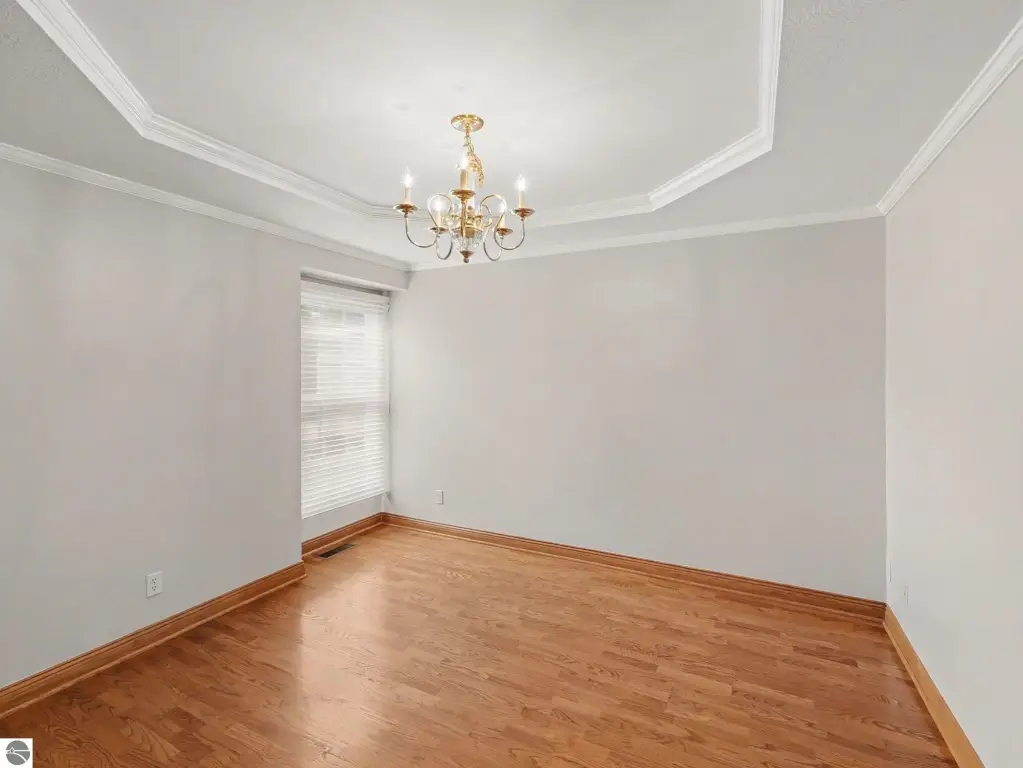
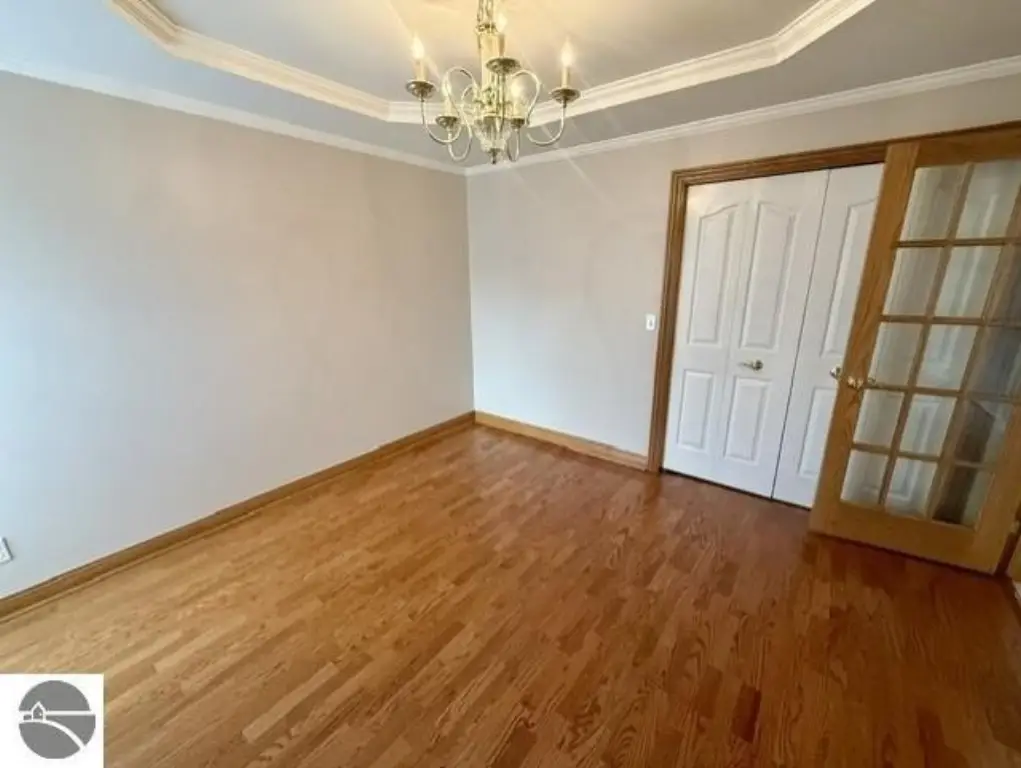
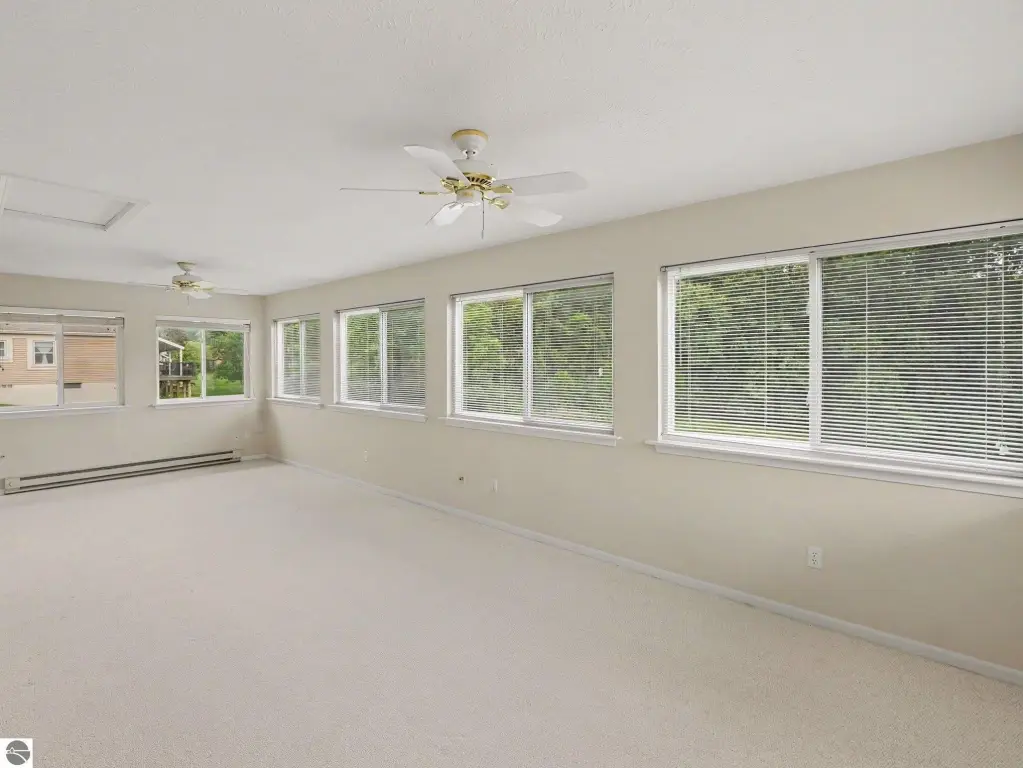
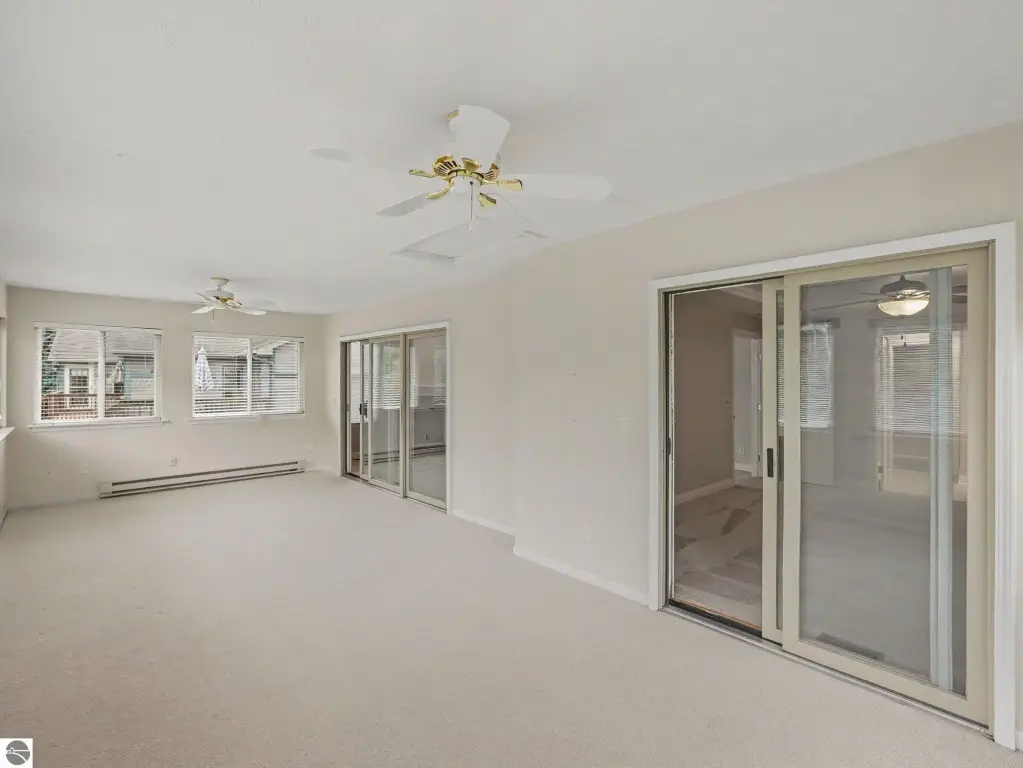
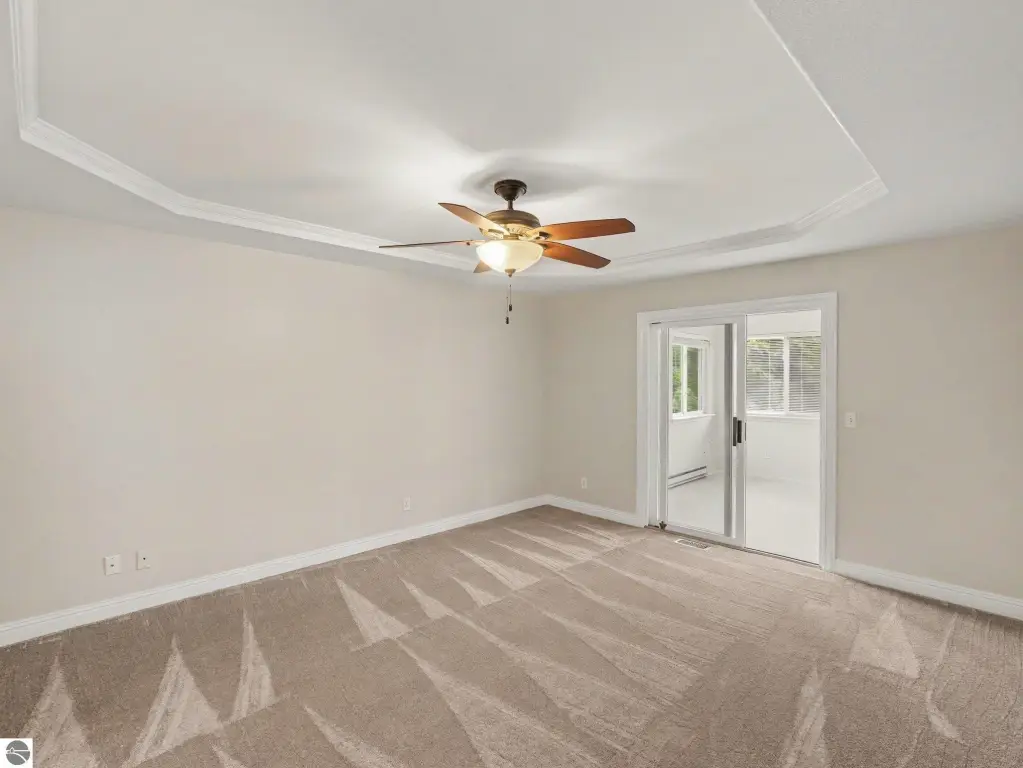
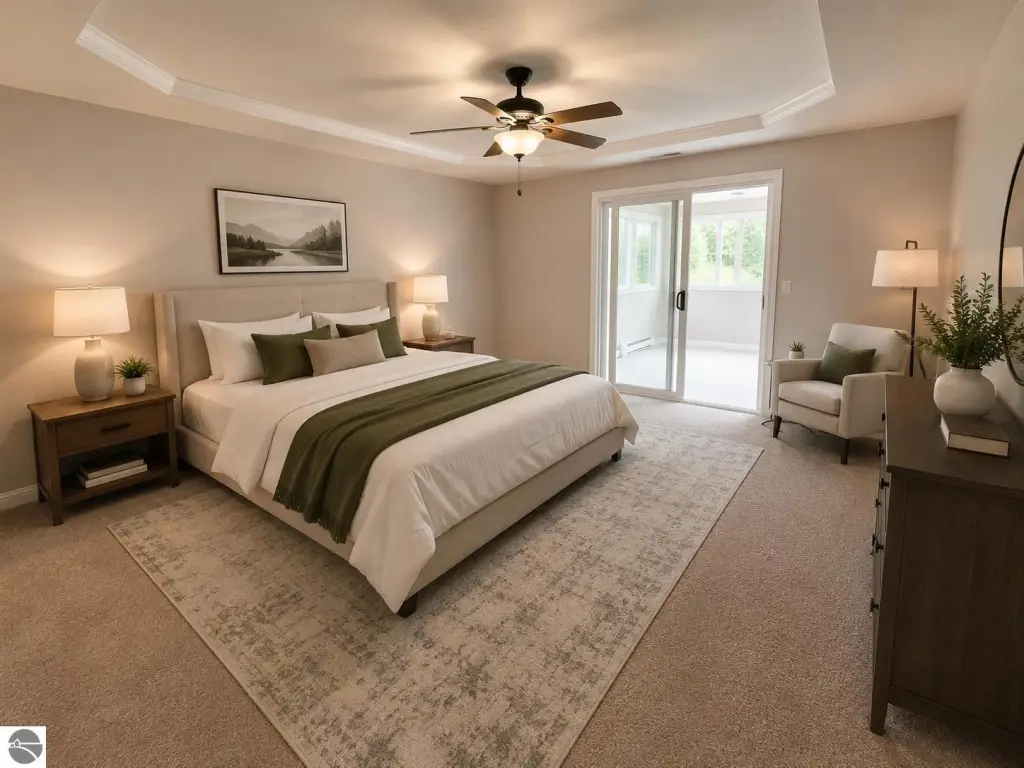
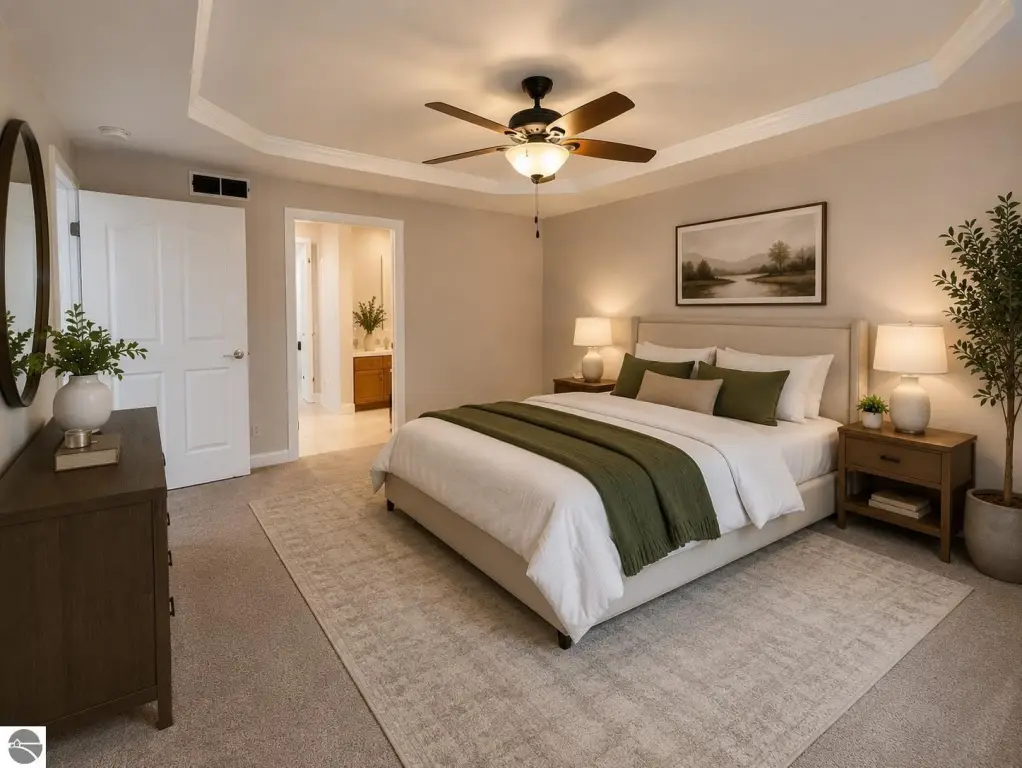
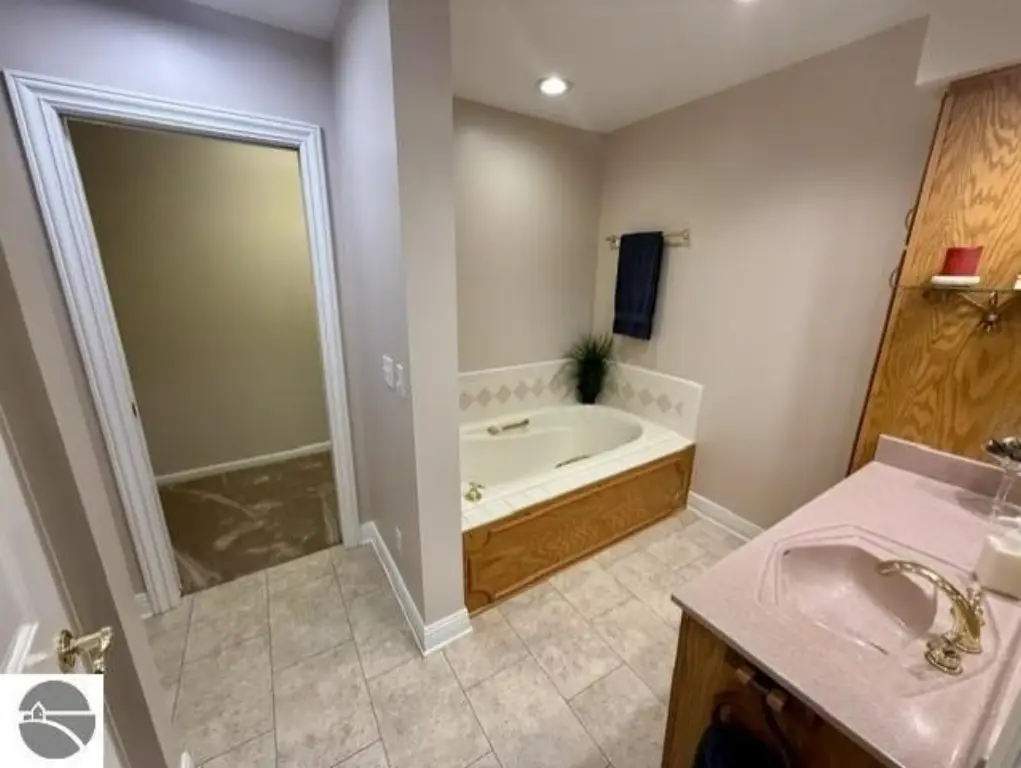
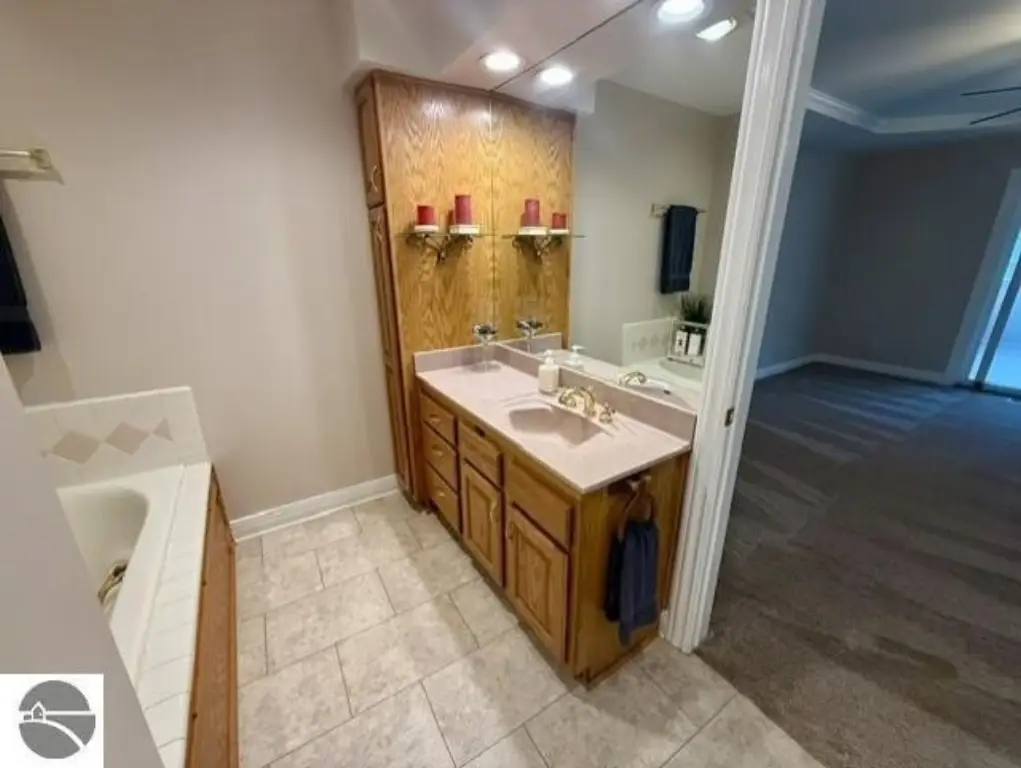
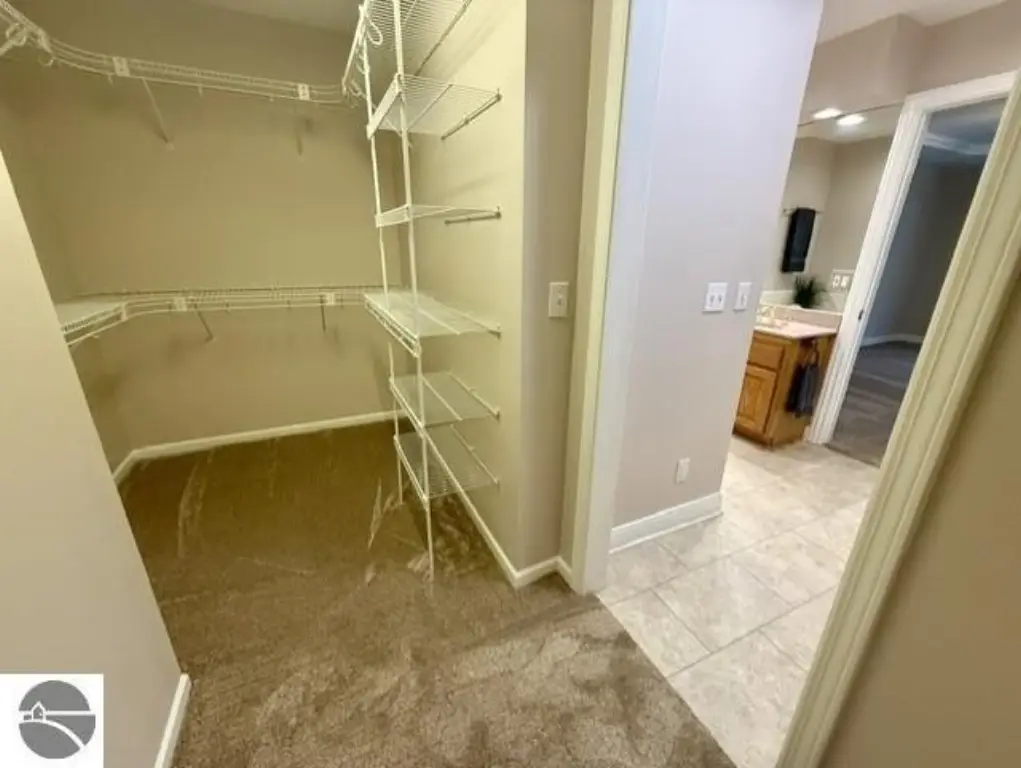
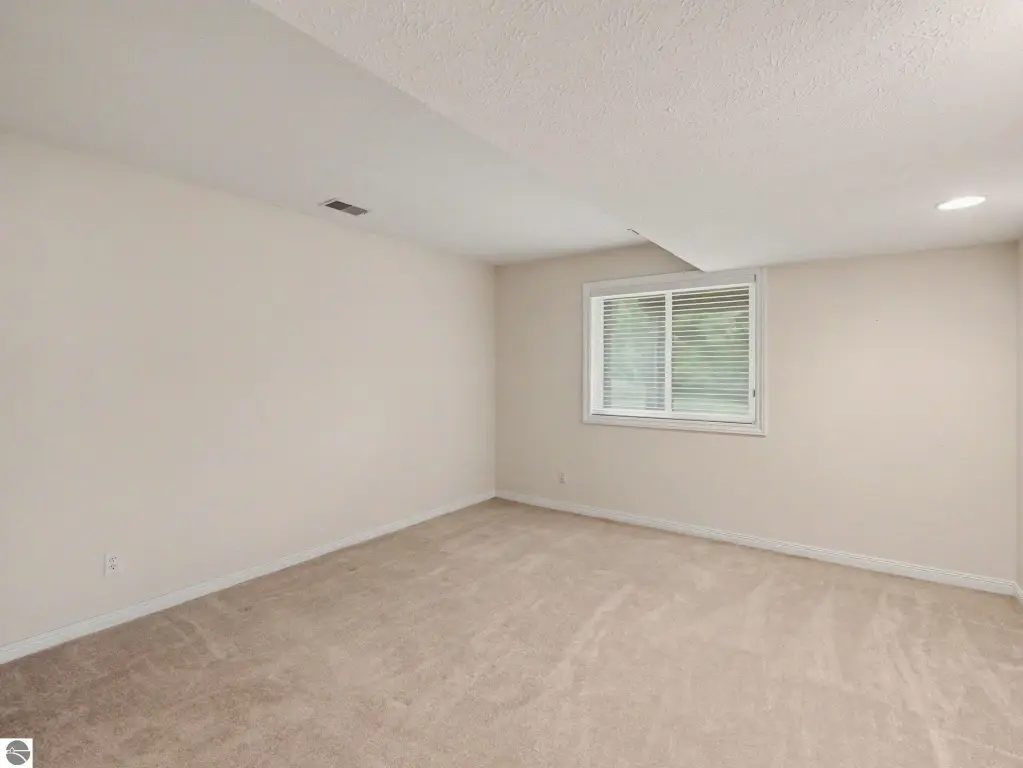
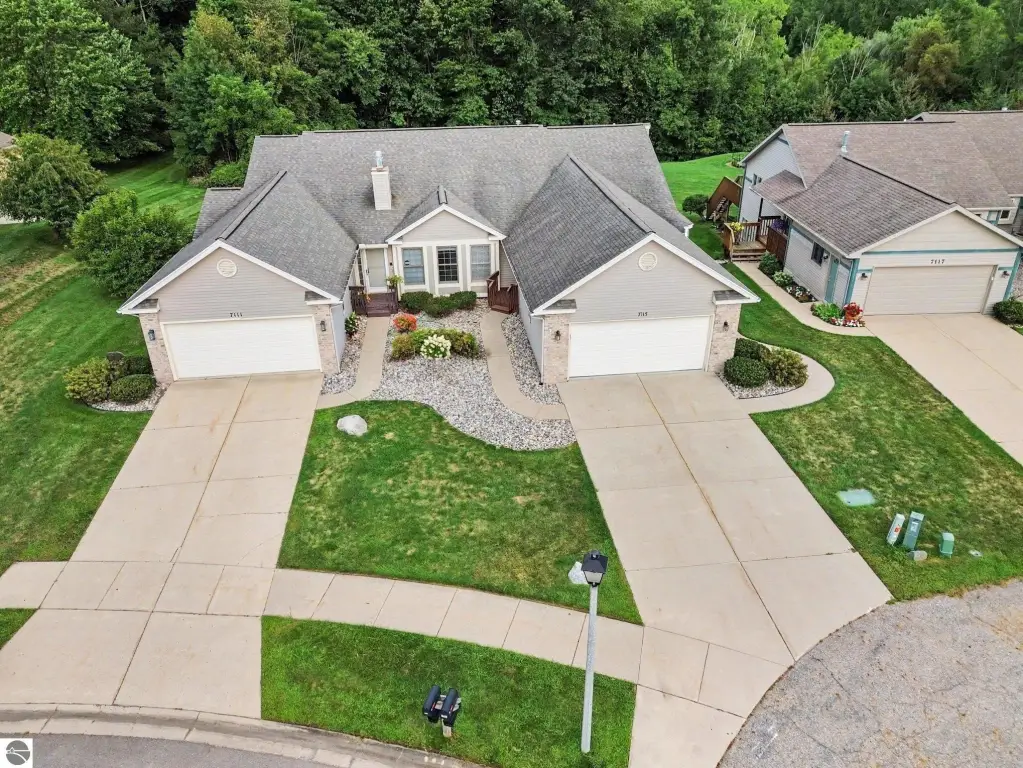
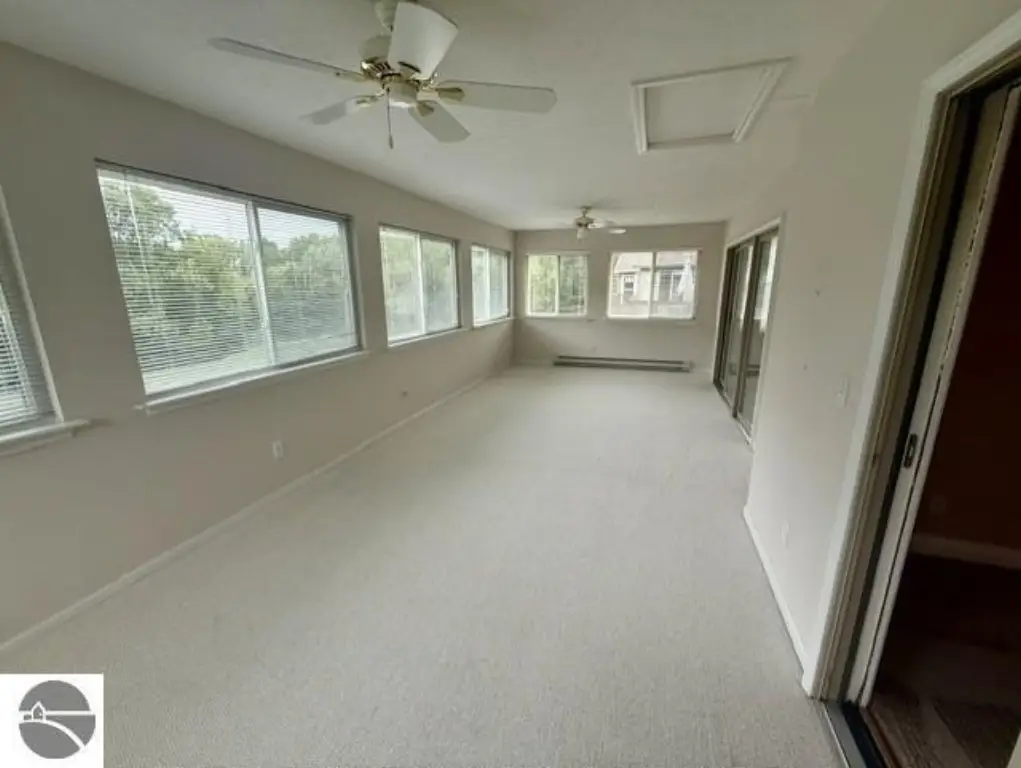
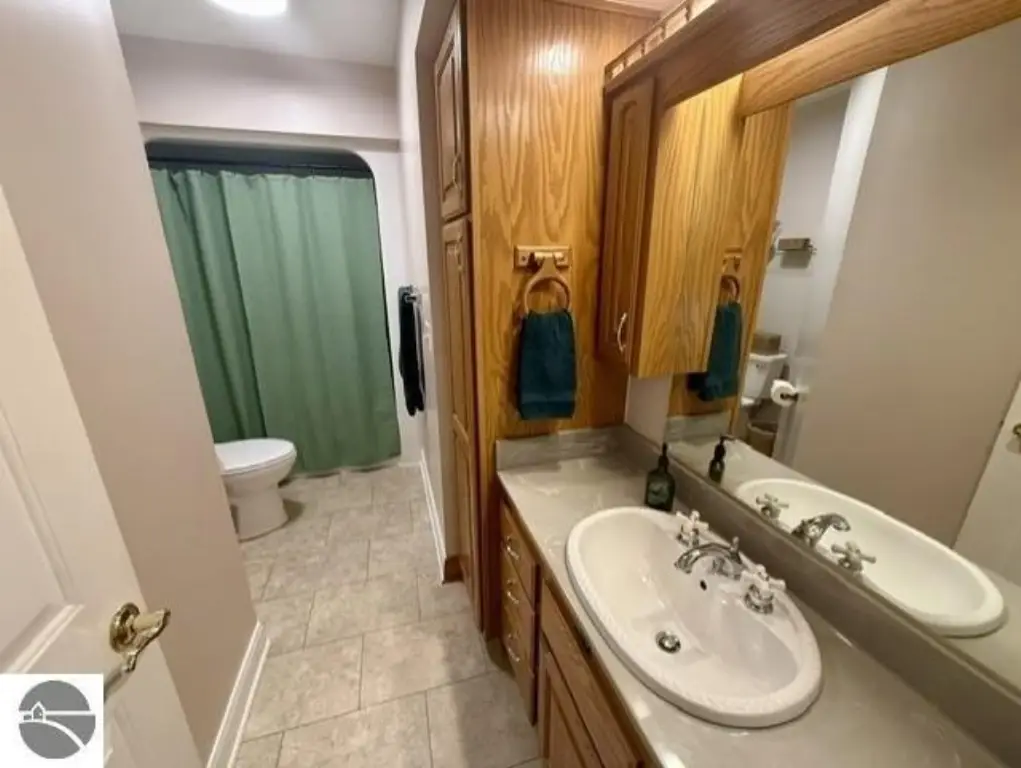
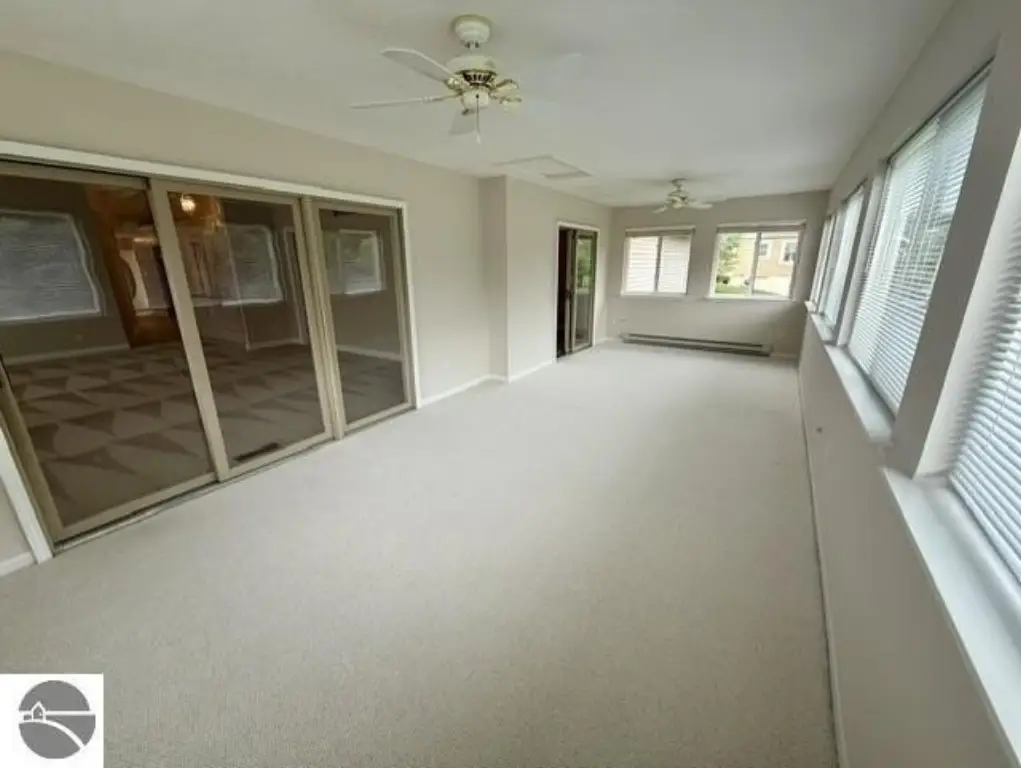
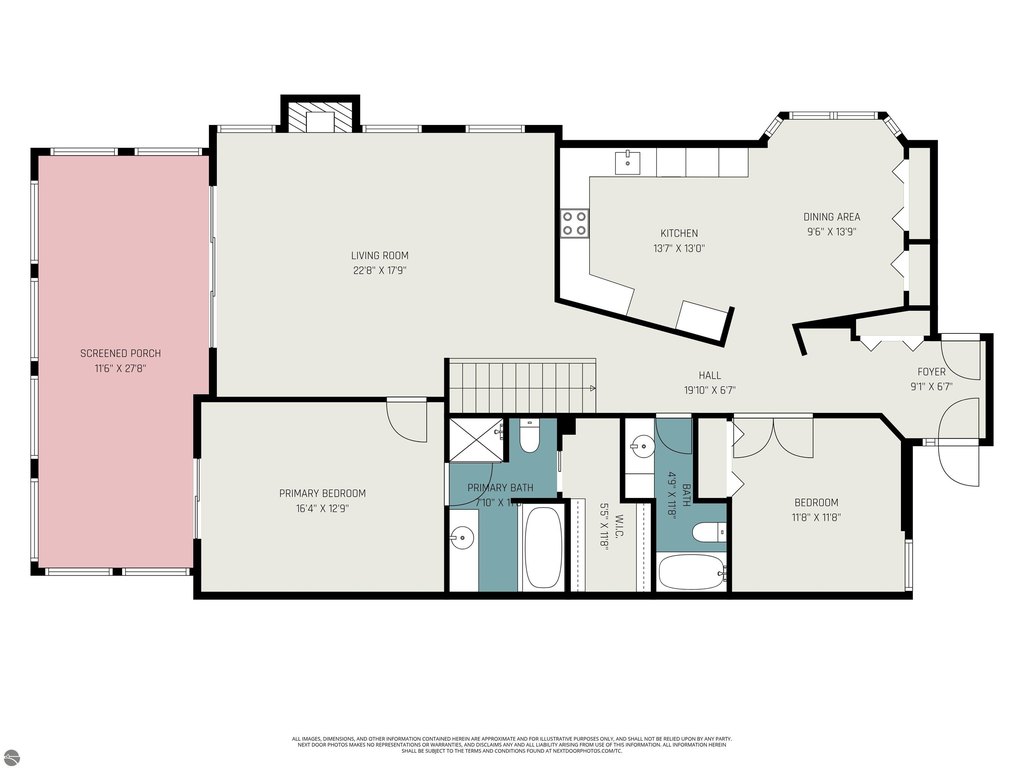
This residential income property offers 3,179 square feet of finished space in a condo-style residence built in 1995. The two-bedroom, three-bath layout includes a flexible main-floor room, open kitchen and living areas, vaulted ceilings, formal dining space, first-floor laundry, and a four-season room. The primary suite includes an ensuite bath and walk-in closet. Recent interior updates include fresh paint, new carpet, and luxury vinyl tile flooring.
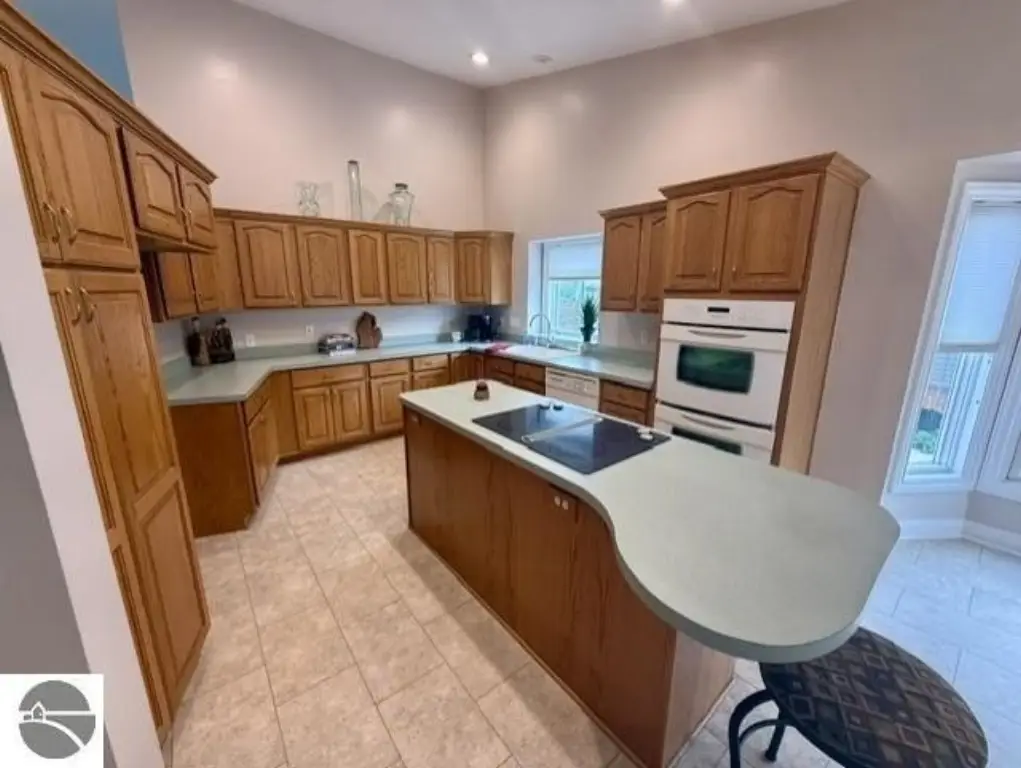
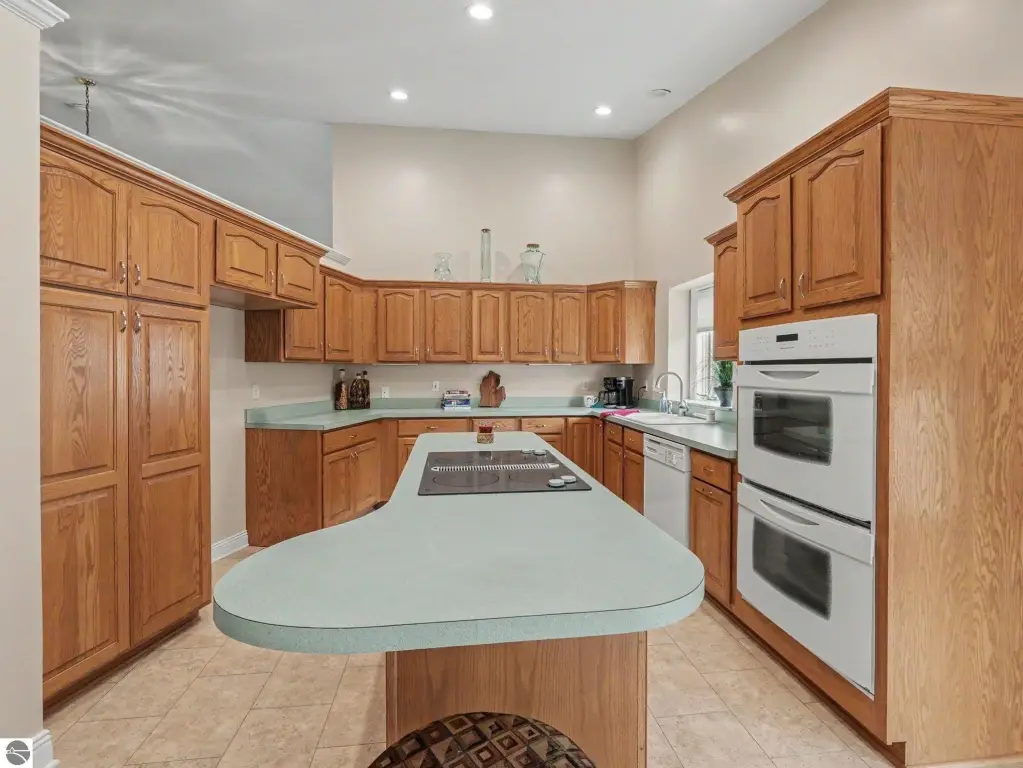
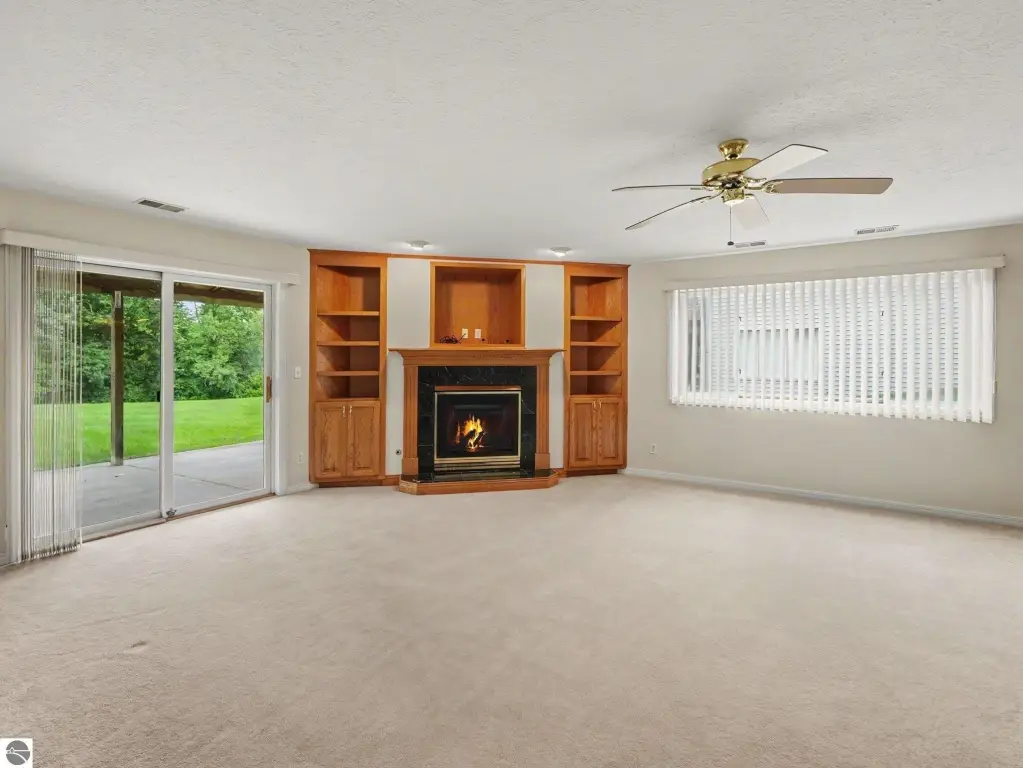
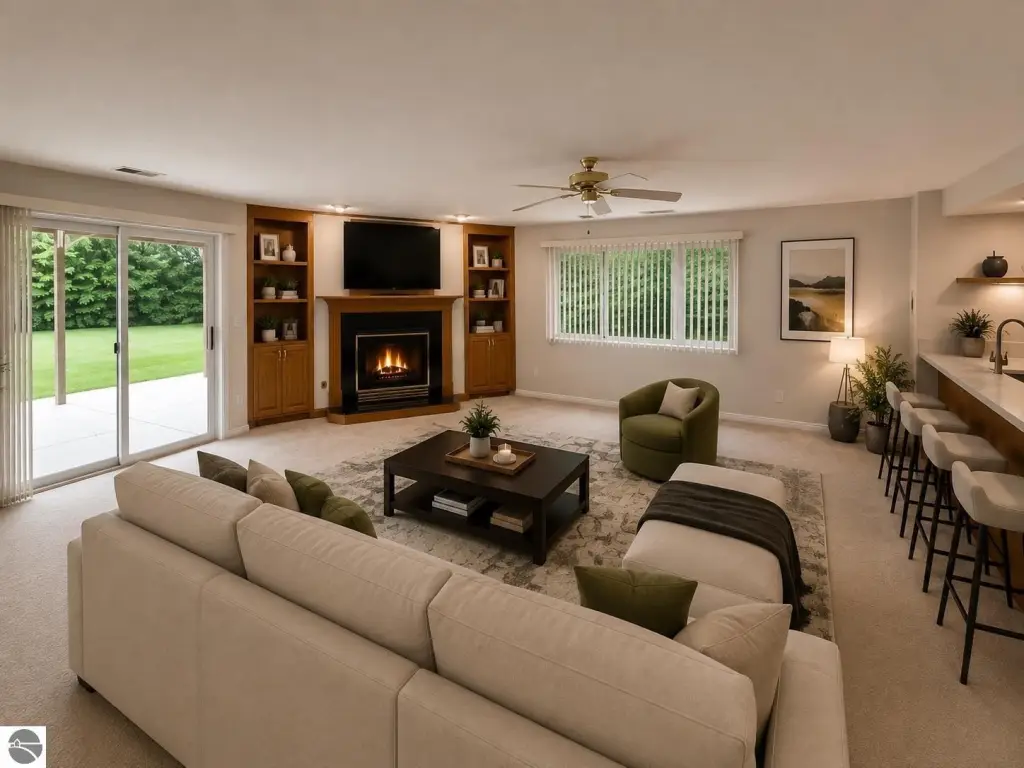
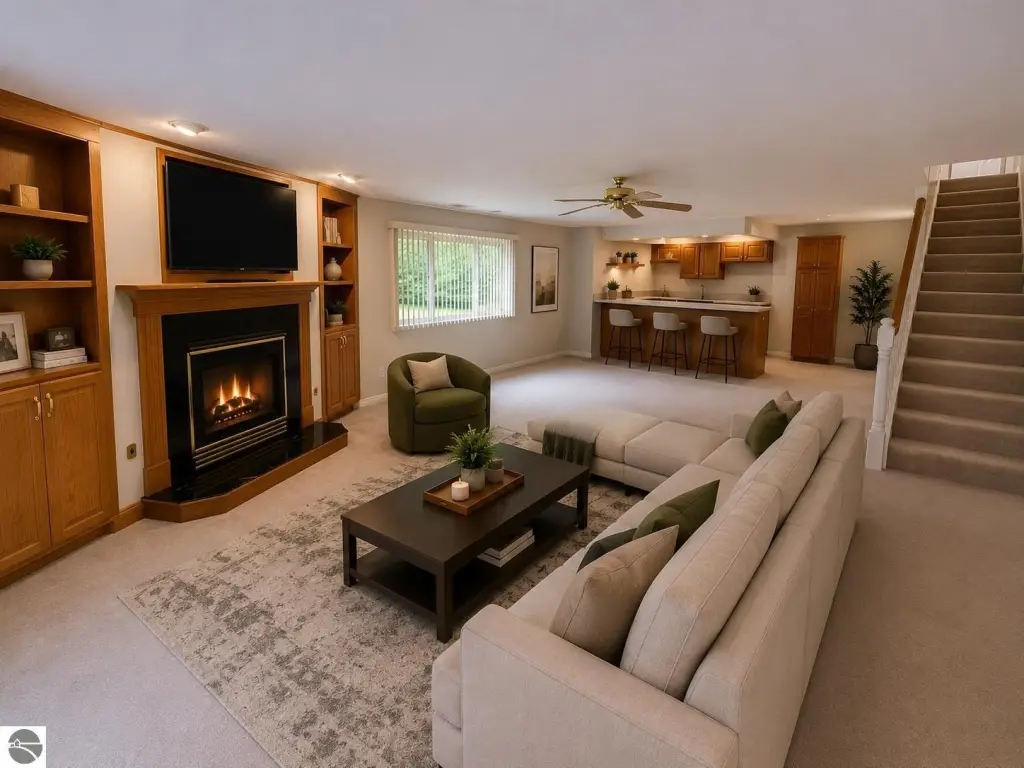
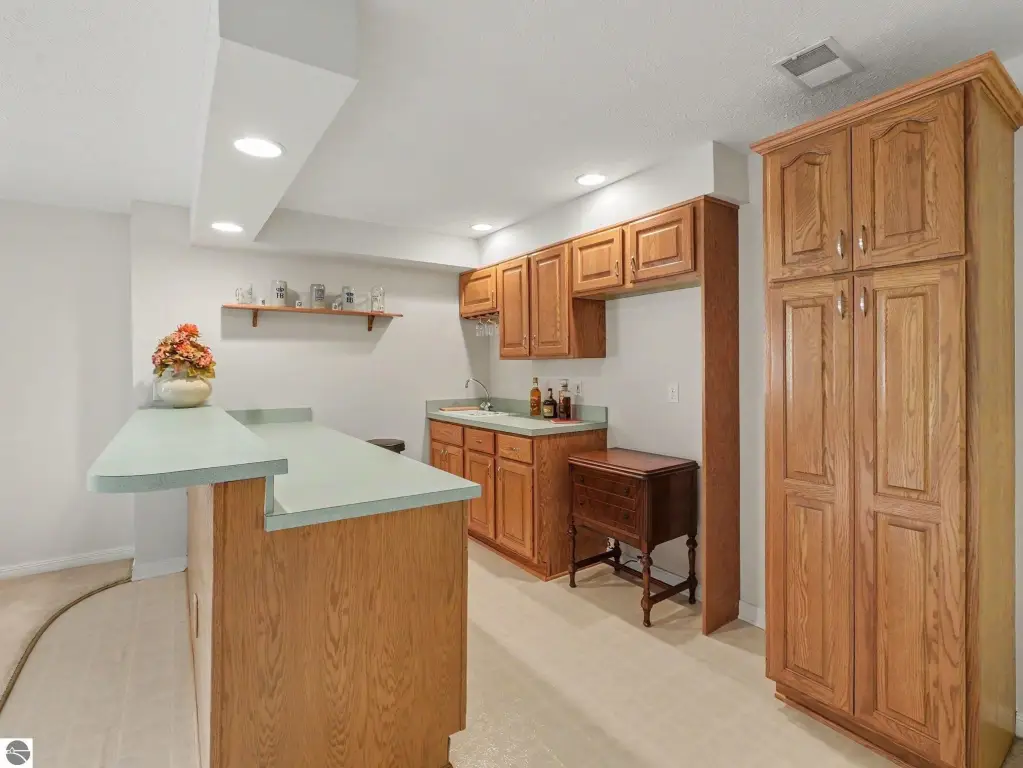
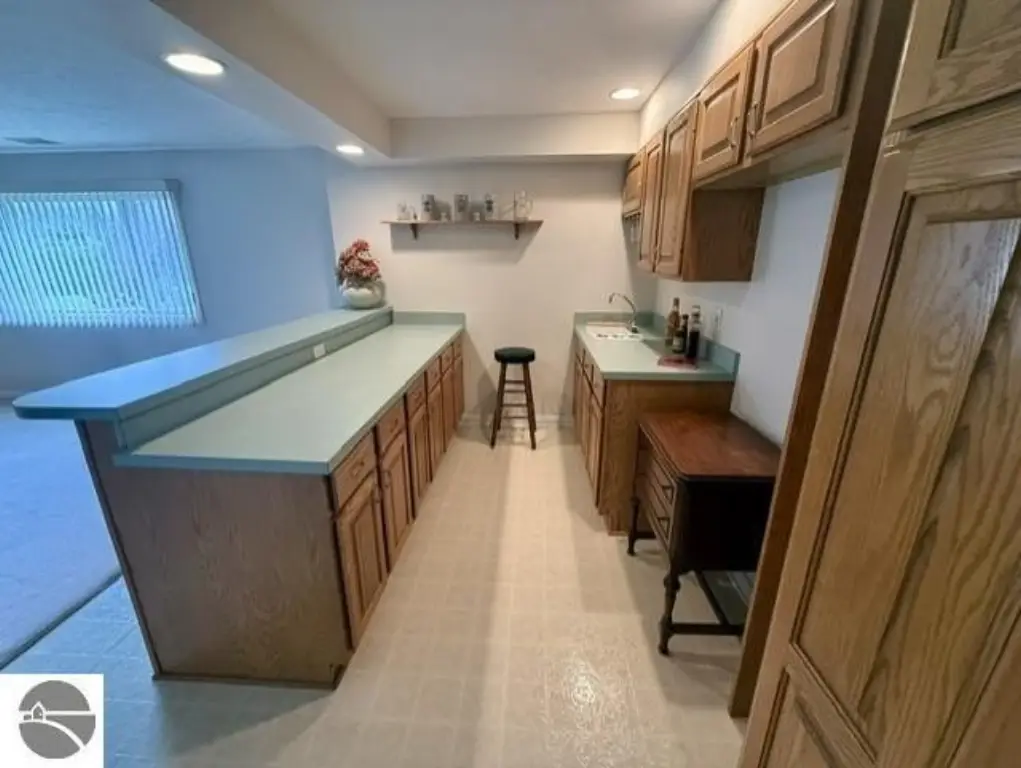
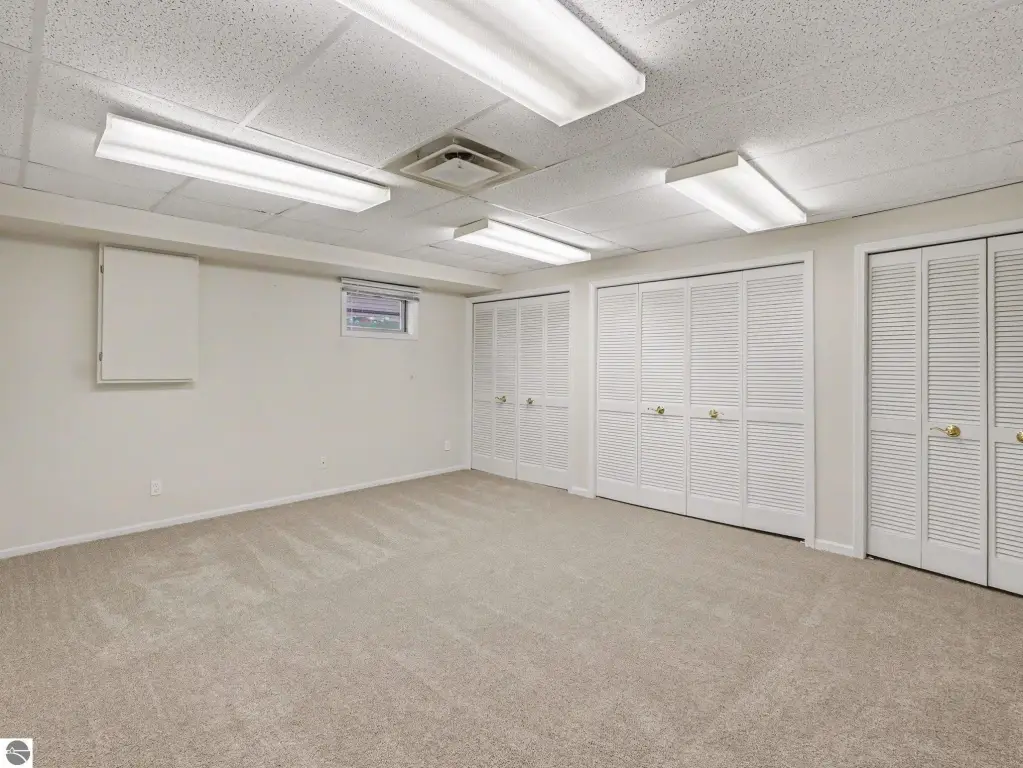
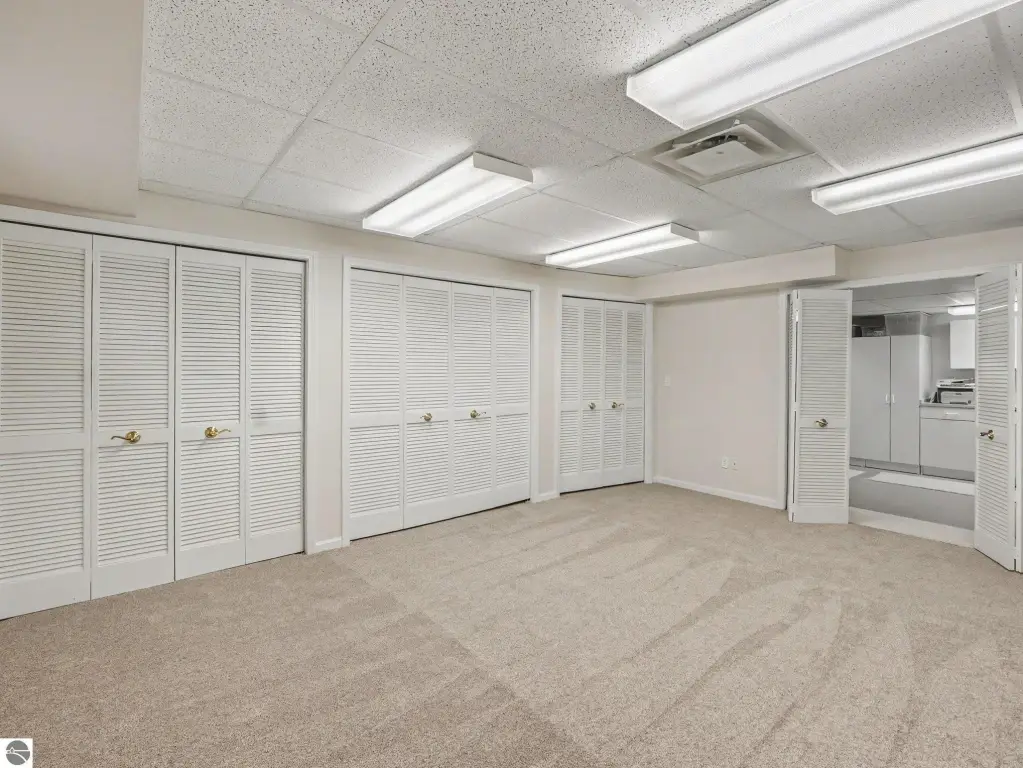
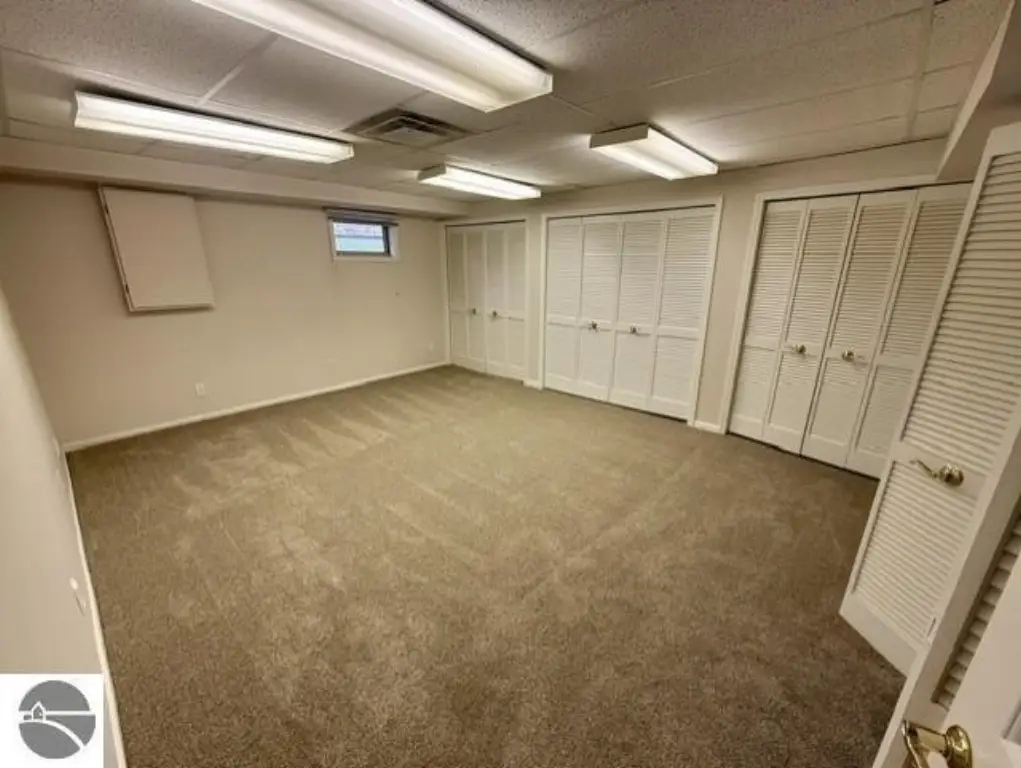
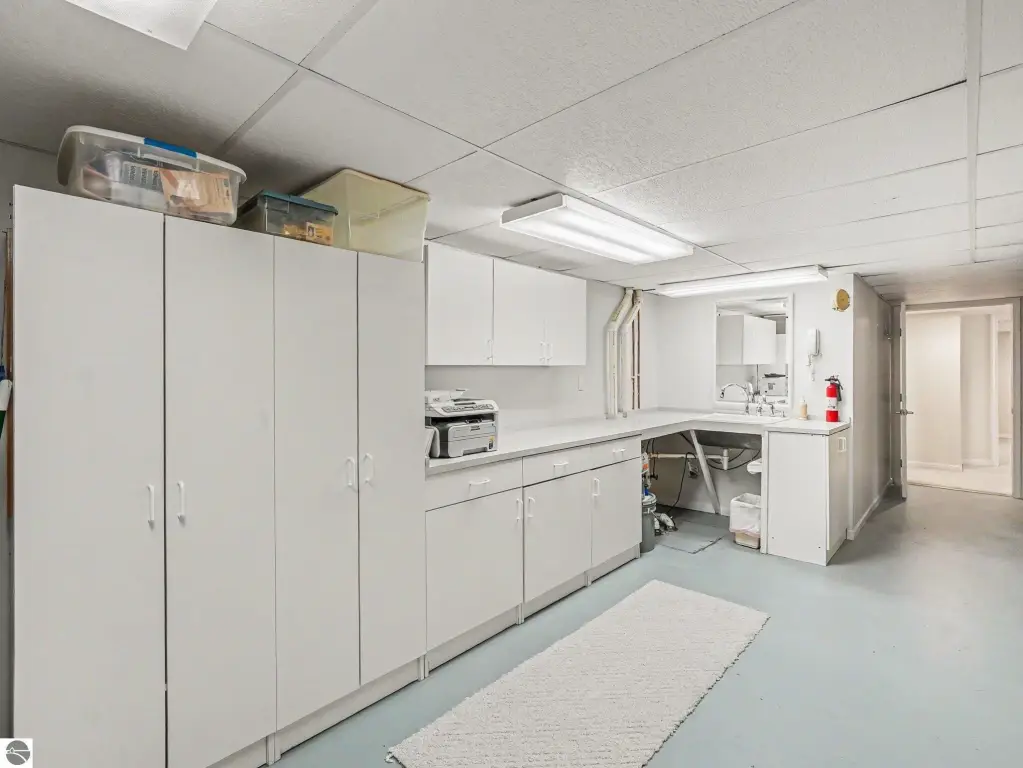
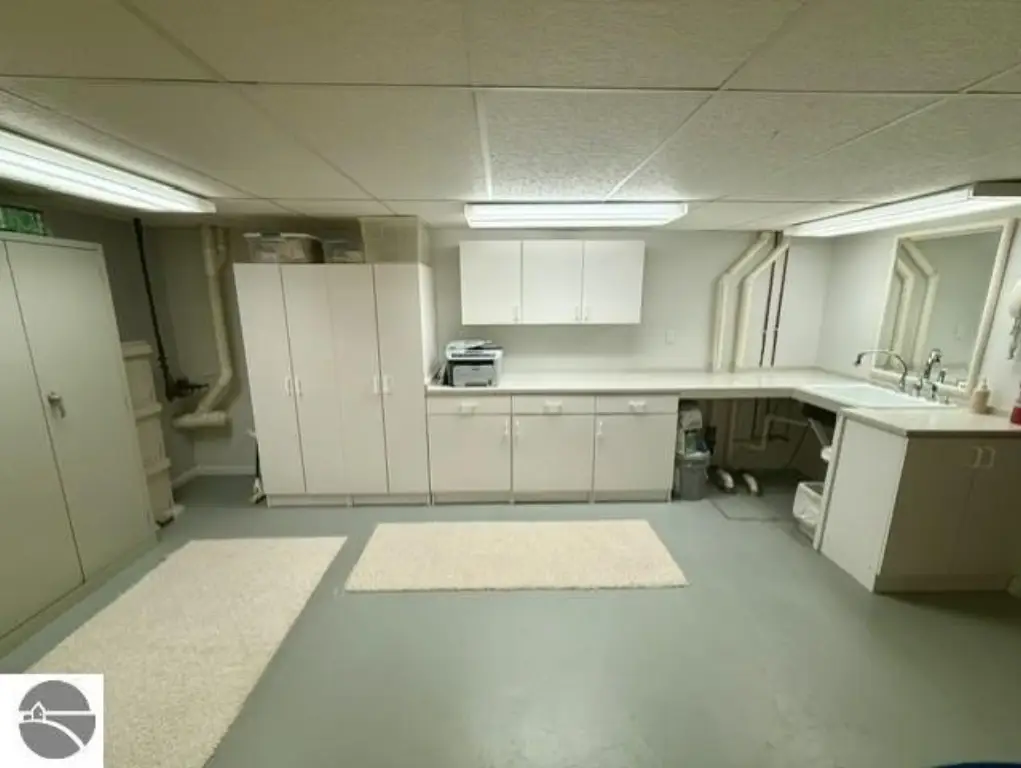
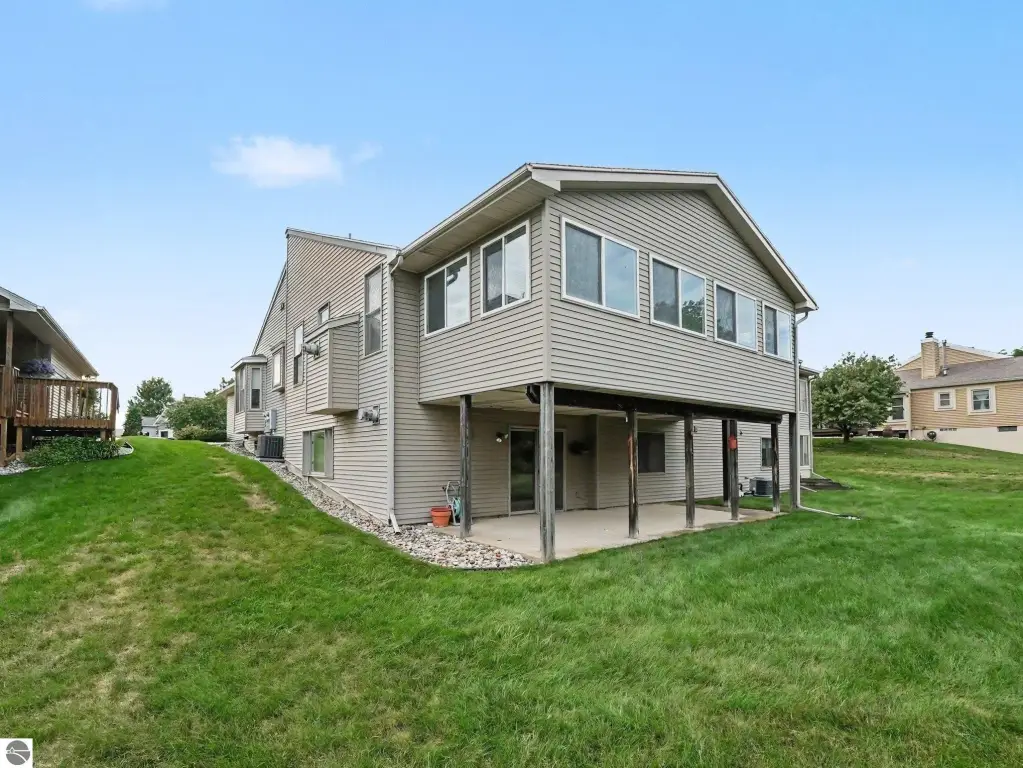
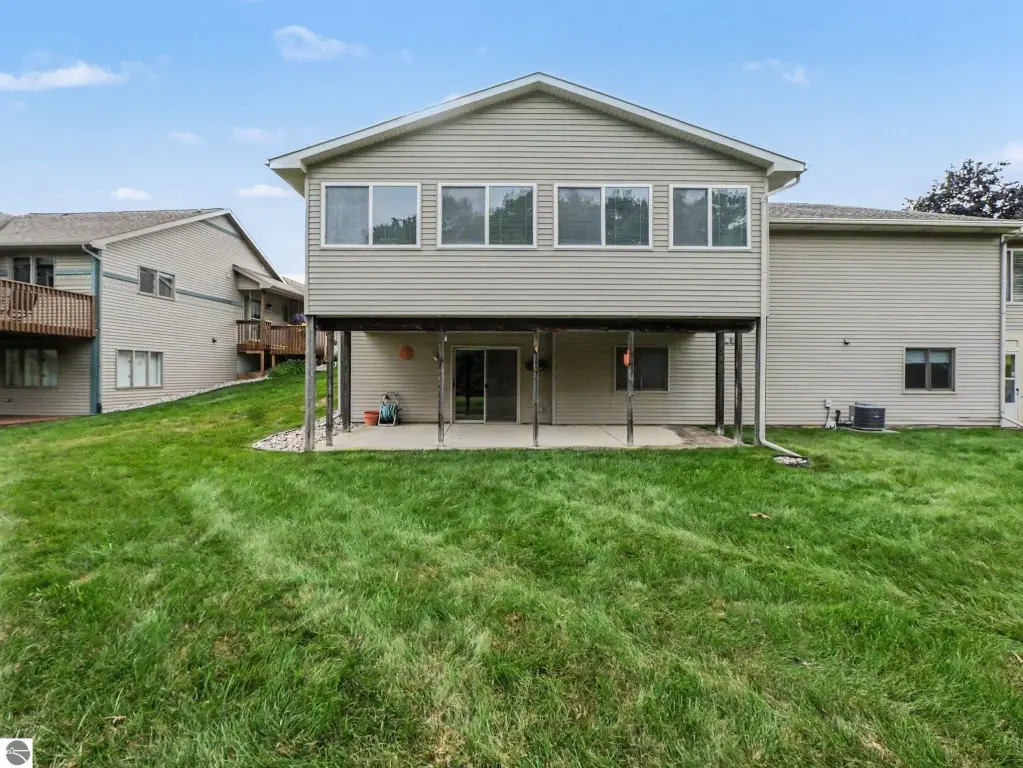
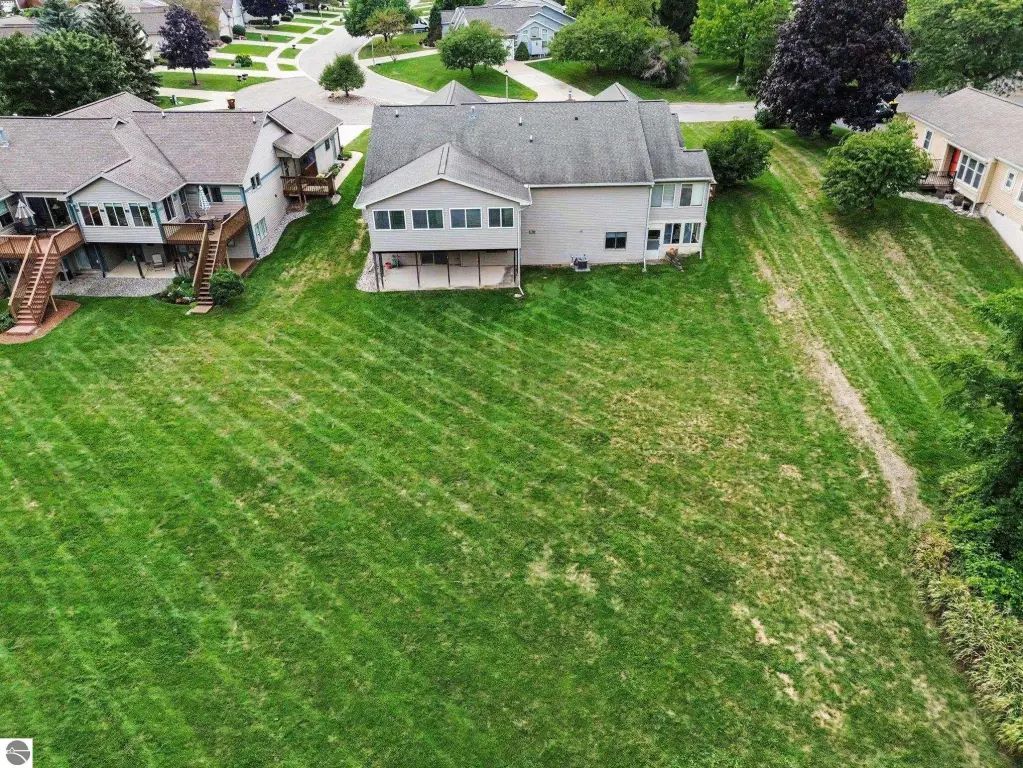
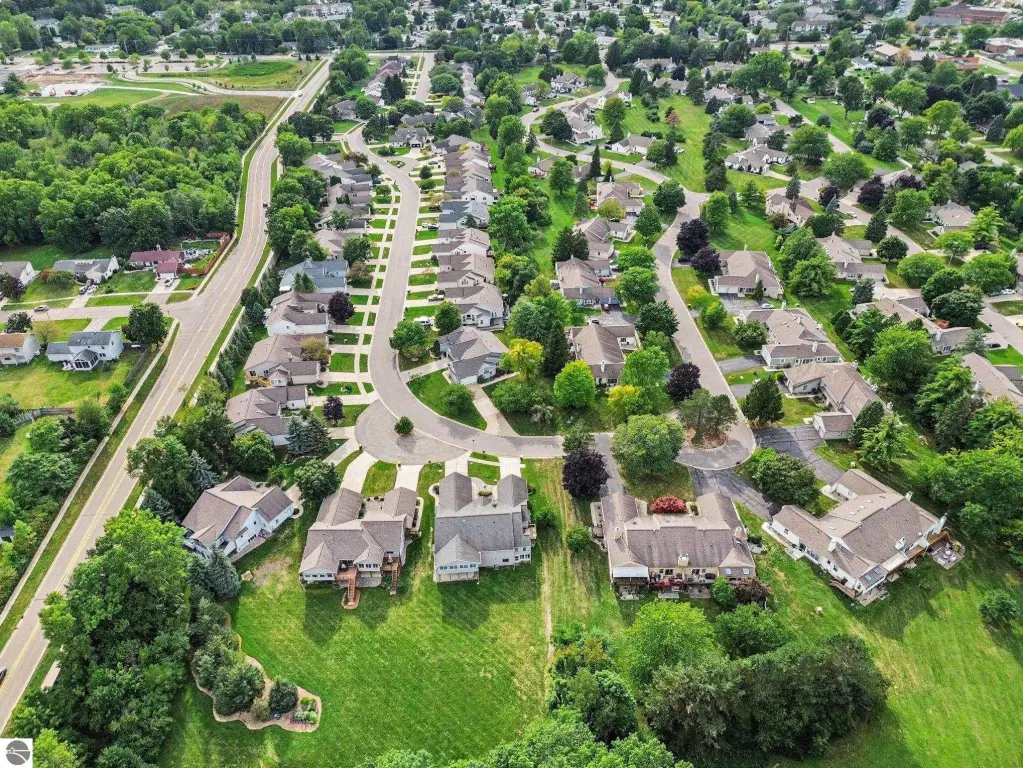
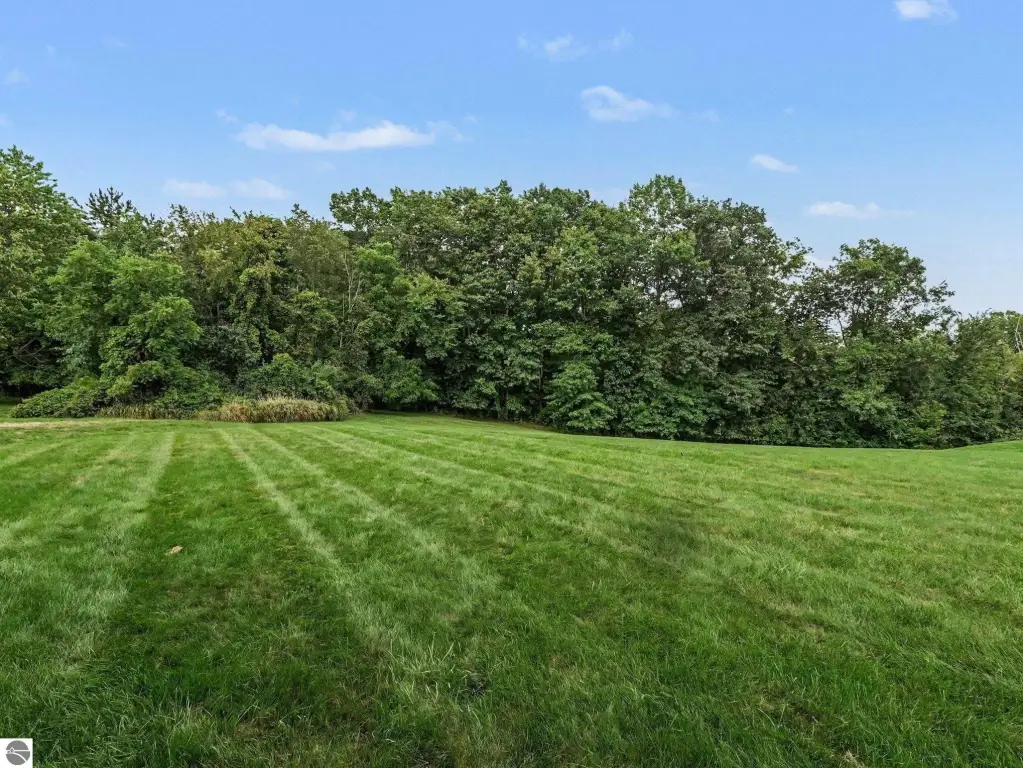
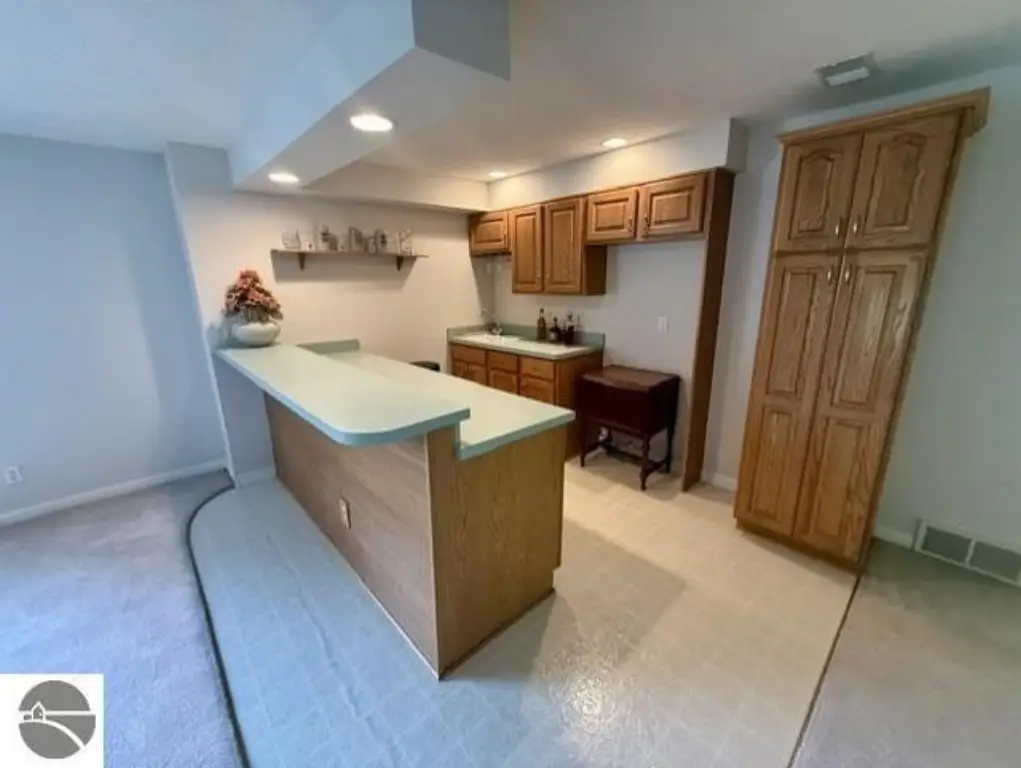
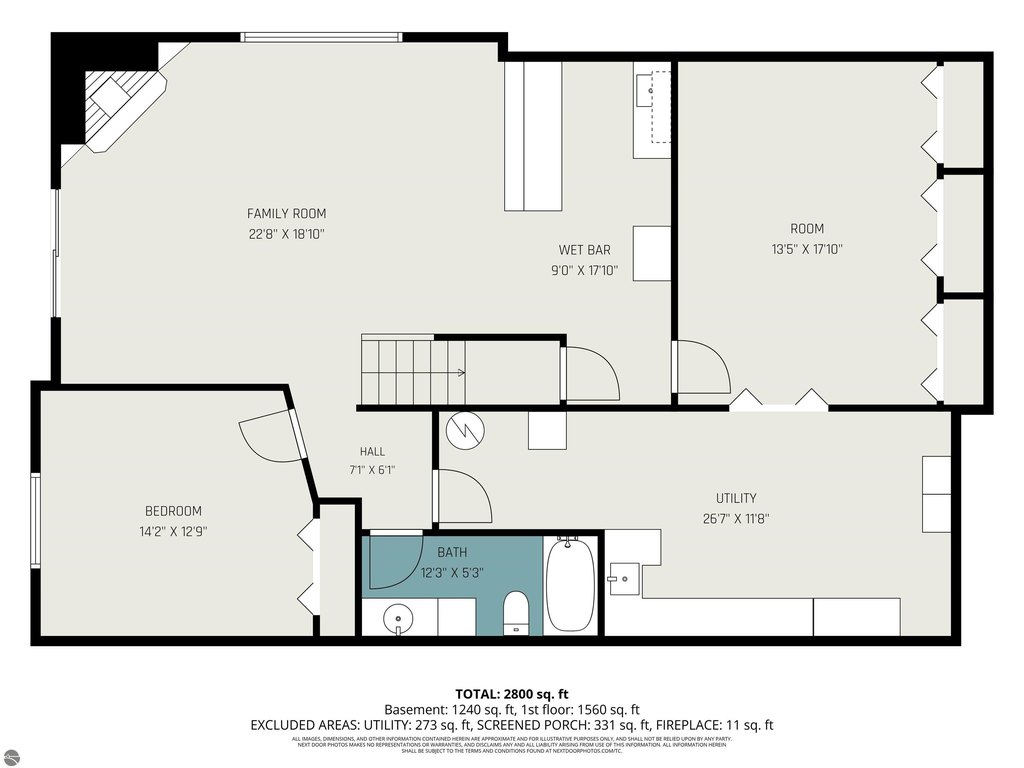
A finished walkout lower level adds a family room, wet bar, and utility or workshop space. Two direct-vent gas fireplaces serve the home, while the kitchen includes an island, pantry, wall oven, cooktop, dishwasher, and disposal. The backyard borders Carrier Creek and includes landscaped outdoor space with a patio. The property is zoned Residential and located near Horrocks Farm Market, highways, downtown Lansing, and Michigan State University.
A finished walkout lower level adds a family room, wet bar, and utility or workshop space. Two direct-vent gas fireplaces serve the home, while the kitchen includes an island, pantry, wall oven, cooktop, dishwasher, and disposal. The backyard borders Carrier Creek and includes landscaped outdoor space with a patio. The property is zoned Residential and located near Horrocks Farm Market, highways, downtown Lansing, and Michigan State University.
Key Highlights
- 3,179 square feet of finished space in a 1995‑built residence
- Two bedrooms and three bathrooms with a flexible main‑floor room
- Finished walkout lower level with family room, wet bar, and workshop space
Financial Insights
Estimated NOI and Cap Rate
NOI / Yr
$25,782
Cap Rate
6.88%
Suggested Prices Based on Cap Rates
Cap Rate 5%
$515,640
$515.6K
Cap Rate 7%
$368,314
$368.3K
Cap Rate 9%
$286,467
$286.5K
Market Conditions
NOI Build-Up for 3,179 SF
Gross rent
$50.0K $15.72/SF
− Vacancy
−$3.1K −$0.97/SF
EGI
$46.9K $14.75/SF
− OpEx
−$21.1K −$6.64/SF
NOI
$25.8K $8.11/SF
Area
Lansing, MI
Vacancy
6.20%
Lease Rate
$15.72 /SF/Yr
Expense Ratio
45.00%
Simulate Cap Rate and NOI
Suggested Prices Based on Cap Rates
Cap Rate 5%
$515,640
Cap Rate 7%
$368,314
Cap Rate 9%
$286,467
Alternative Uses
Best Use
Apartment 5plus
$368.3K
$322.3K – $429.7K
NOI $25,782 @ 7.0% cap · market cap 6.88%
Second Best
—
—
no second resolved use
Theoretical Best
Office A
$654.4K
$572.6K – $763.4K
NOI $45,806 @ 7.0% cap · market cap 12.22%
Zoning and permitted uses should be independently verified with authorities.
Property Analytics
Unlock full access to Insights
Subscribe to Realmo Intelligence
Open Analytics
Current Use
Lease Details
1
Residential units
Yes
Highway access
Location Intelligence
Trade Area within ½ mile
365
Businesses Nearby
Explore this area
Business Placement
Demographics for 48917, MI
32,679
Population
15,975
Households
2
Avg Household Size
41
Median Age
40%
College-Educated
94%
High-School Grad
24.0 sq mi
ZIP Area
1,362
Density / Sq Mi
$73,259
Median Household Income
$47,739
Median Earnings
$1,085
Median Rent
$211,300
Median Home Value
Check the figures for this property
Cap Rate, Value Estimation, Potential NOI and more
View Realmo Analytics

Questions? Ask Rey
Realmo’s AI knows this listing — price, zoning, demand, history. Ask anything.




Frequently Asked Questions
What type of property is this?
Residential income property - Condo residence with flexible living areas, updated finishes, and a natural setting along Carrier Creek.
Where is this residential income property located?
The property is located at 7115 Glen Terra Drive Lansing, MI.
What is the asking price?
The asking price for this property is $374,900.
What are key features of this property?
This property features: 3,179 square feet of finished space in a 1995‑built residence; Two bedrooms and three bathrooms with a flexible main‑floor room; Finished walkout lower level with family room, wet bar, and workshop space



